[Welcome to WeChat Public Number: Xiamen Weiss Network]
Weiss Network (Official): https://www.xmws.cn/
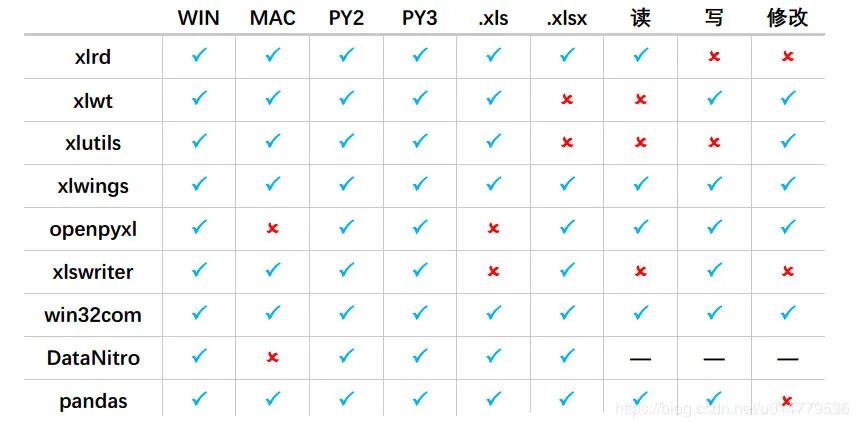
0 Python Excel library comparison
Let's start with a comparison of nine libraries in python that can operate on Excel:
1 Python xlrd read operation Excel
Introduction to 1.1 xlrd module
(1) What is an xlrd module?
python operation excel is mainly used in xlrd and xlwt libraries, that is, xlrd is a library for reading excel and xlwt is a library for writing excel.
(2) Why use the xlrd module?
Data maintenance is a core part of UI automation or interface automation, so this module is very useful.
The xlrd module can be used to read data from Excel, which is very fast. Recommended!
Official documents: https://xlrd.readthedocs.io/en/latest/
1.2 Install xlrd module
Download on python's website http://pypi.python.org/pypi/xlrd Module installation, provided Python environment is installed.
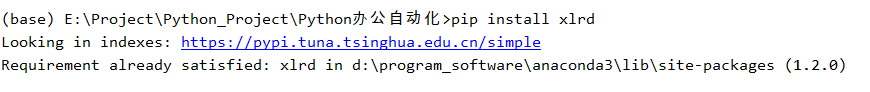
Or pip install xlrd in the cmd window
pip install xlrd
Here's anaconda with its own xlrd, so the tip is already installed:
1.3 Introduction to Use
Data type of commonly used cells
-
empty
-
string(text)
-
number
-
date
-
boolean
-
error
-
Blank (blank table)
Import Module
import xlrd
Open Excel file to read data
data = xlrd.open_workbook(filename)#File name and path, if path or file name has Chinese, add an r to the front
Common Functions
The most important method in excel is the operation of book and sheet
(1) Get a worksheet in the book (excel file)
table = data.sheets()[0]             #Get by index order
table = data.sheet_by_index(sheet_indx)  #Get by index order
table = data.sheet_by_name(sheet_name)  #Get by name

#All three functions return an xlrd.sheet.Sheet() object

names = data.sheet_names()        #Return the names of all sheets in the book
data.sheet_loaded(sheet_name or indx)    #Check if a sheet has been imported
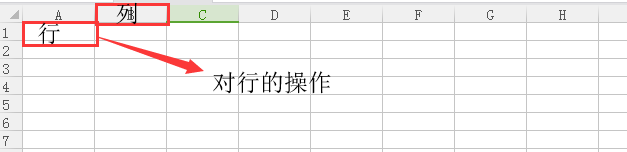
(2) Operation of rows
nrows = table.nrows
    #Get the number of rows in the sheet, note, here table.nrows are not followed by ().

table.row(rowx)
    #Returns a list of all cell objects in the row, as compared to tabel. The raw() method is not different.

table.row_slice(rowx)
    #Returns a list of all cell objects in the row

table.row_types(rowx, start_colx=0, end_colx=None)
    #Returns a list of data types for all cells in the row; *
    #Return value is a list of logical values, 0 if the type is empy, otherwise 1

table.row_values(rowx, start_colx=0, end_colx=None)
    #Returns a list of data from all cells in the row

table.row_len(rowx)
    #Returns the valid cell length of the row, that is, how much data is in the row
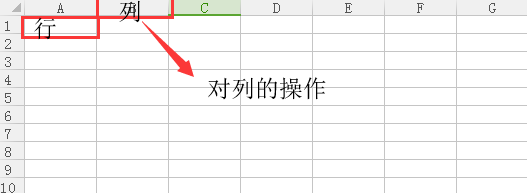
(3) Operation of columns (colnum)
ncols = table.ncols
    #Get the number of valid columns in the list

table.col(colx, start_rowx=0, end_rowx=None)
    #Returns a list of all cell objects in the column

table.col_slice(colx, start_rowx=0, end_rowx=None)
    #Returns a list of all cell objects in the column

table.col_types(colx, start_rowx=0, end_rowx=None)
    #Returns a list of data types for all cells in the column

table.col_values(colx, start_rowx=0, end_rowx=None)
    #Returns a list of data from all cells in the column
(4) Operation of cells
table.cell(rowx,colx)
    #Return Cell Object

table.cell_type(rowx,colx)
    #Returns the data type in the corresponding location cell

table.cell_value(rowx,colx)
    #Return data from the corresponding location cell
1.4 Practical Training
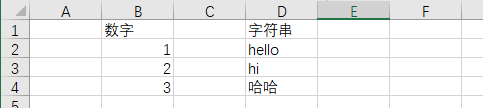
First we put the following data in the table and click Save:
Read using the xlrd module:
import xlrd
xlsx = xlrd.open_workbook('./3_1 xlrd read Practice.xlsx')
#Find by sheet name: xlsx.sheet_by_name("sheet1")
#Find by index: xlsx.sheet_by_index(3)
table = xlsx.sheet_by_index(0)
#Getting a single table value (2,1) means getting the value of the cell in row 3, column 2
value = table.cell_value(2, 1)
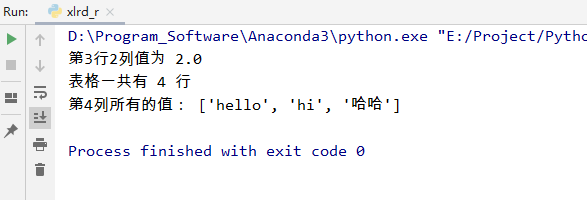
print("Row 3, column 2 values",value)
#Get the number of table rows
nrows = table.nrows
print("Tables are common",nrows,"That's ok")
#Get all the values in column 4 (list generation)
name_list = [str(table.cell_value(i, 3)) for i in range(1, nrows)]
print("All values in column 4:",name_list)
Print results:
List Generation Introduction:
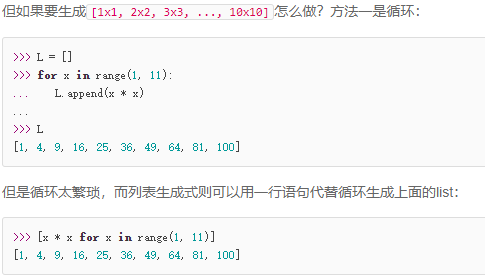
List-Generated Learning Links:
https://www.liaoxuefeng.com/wiki/1016959663602400/1017317609699776
2 Python xlwt write operation Excel (xls format only!)
xlwt can be used to write a new Excel table or to modify it on the basis of the original table. It is also fast and recommended!
Official documents: https://xlwt.readthedocs.io/en/latest/
2.1 pip installation xlwt
pip install xlwt
I'm here that anaconda comes with xlwt, so the tip is already installed:

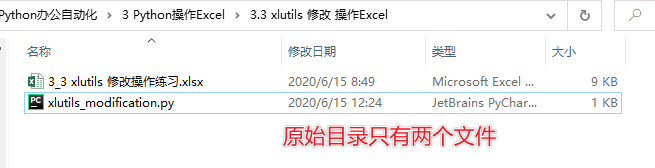
2.2 Use xlwt to create new tables and write
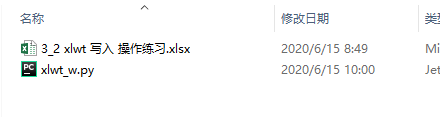
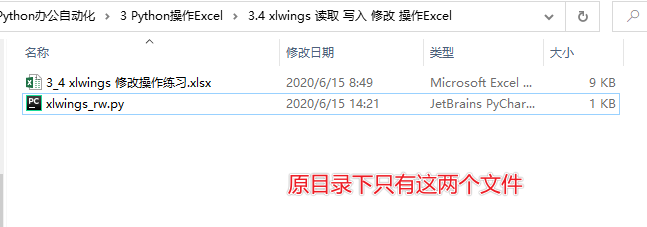
At first there were only two files in the directory:
Write a new xlwt form writer:
#3.2.2 Create a new table using xlwt and write
def fun3_2_2():
    #Create a new workbook (that is, create a new excel)
    workbook = xlwt.Workbook(encoding= 'ascii')

    #Create a new sheet table
    worksheet = workbook.add_sheet("My new Sheet")

    #Write to table
    worksheet.write(0,0, "Content 1")
    worksheet.write(2,1, "Content 2")

    #Save
    workbook.save("Newly created table.xls")
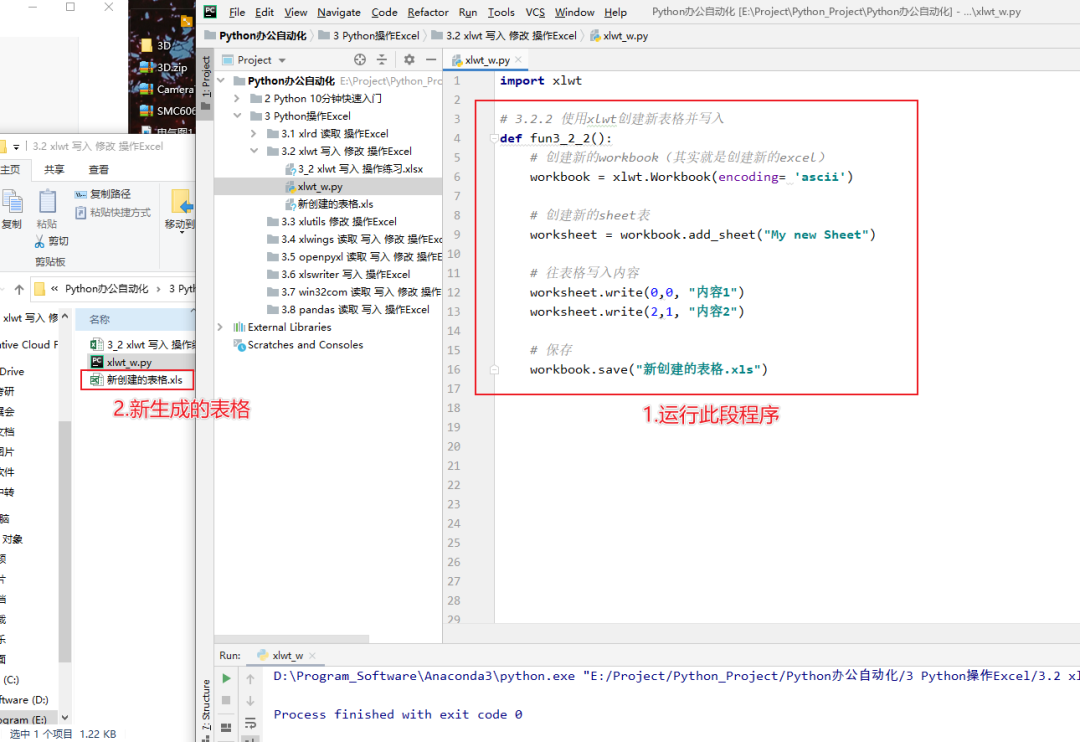
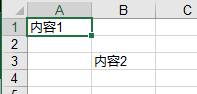
The resulting table is as follows:
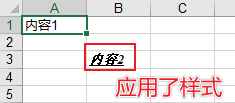
2.3 xlwt Set Font Format
Program example:
#3.2.3 xlwt Set Font Format
def fun3_2_3():
    #Create a new workbook (that is, create a new excel)
    workbook = xlwt.Workbook(encoding= 'ascii')

    #Create a new sheet table
    worksheet = workbook.add_sheet("My new Sheet")

    #Initialization Style
    style = xlwt.XFStyle()

    #Create fonts for styles
    font = xlwt.Font()
    font.name = 'Times New Roman'   #Typeface
    font.bold = True                #Bold
    font.underline = True           #Underline
    font.italic = True              #Italic

    #Set Style
    style.font = font

    #Write to table
    worksheet.write(0,0, "Content 1")
    worksheet.write(2,1, "Content 2",style)

    #Save
    workbook.save("Newly created table.xls")
The results are as follows:
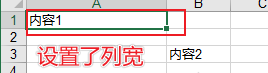
2.4 xlwt Set Column Width
The value representation of column width in xlwt: 1/256 of the default font 0 is the unit of measure.
The default width used when creating xlwt is 2960, which is a width of 11 characters 0
So we can set the column width in the following ways:
width = 256 * 20 256 is the unit of measure, and 20 represents the width of 20 characters
Program example:
#3.2.4 Set column width
def fun3_2_4():
    #Create a new workbook (that is, create a new excel)
    workbook = xlwt.Workbook(encoding= 'ascii')

    #Create a new sheet table
    worksheet = workbook.add_sheet("My new Sheet")

    #Write to table
    worksheet.write(0,0, "Content 1")
    worksheet.write(2,1, "Content 2")

    #Set Column Width
    worksheet.col(0).width = 256*20

    #Save
    workbook.save("Newly created table.xls")
The results are as follows:
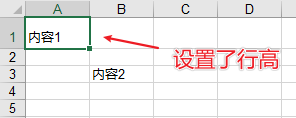
2.5 xlwt Set Line Height
There is no specific function in xlwt to set the default column width and row height
The line height is set in the cell style, and you can determine the line height by typing in the amount of text by wrapping lines automatically
Program example:
#3.2.5 Set line height
def fun3_2_5():
    #Create a new workbook (that is, create a new excel)
    workbook = xlwt.Workbook(encoding= 'ascii')

    #Create a new sheet table
    worksheet = workbook.add_sheet("My new Sheet")

    #Write to table
    worksheet.write(0,0, "Content 1")
    worksheet.write(2,1, "Content 2")

    #Set line height
    style = xlwt.easyxf('font:height 360;')  #18pt, font size of type Xiaochu
    row = worksheet.row(0)
    row.set_style(style)

    #Save
    workbook.save("Newly created table.xls")
The results are as follows:
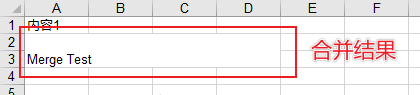
2.6 xlwt Merge Columns and Rows
Program example:
#3.2.6 Merge columns and rows
def fun3_2_6():
    #Create a new workbook (that is, create a new excel)
    workbook = xlwt.Workbook(encoding= 'ascii')

    #Create a new sheet table
    worksheet = workbook.add_sheet("My new Sheet")

    #Write to table
    worksheet.write(0,0, "Content 1")

    #Merge columns 0 through 3 of rows 1 through 2
    worksheet.write_merge(1, 2, 0, 3, 'Merge Test')

    #Save
    workbook.save("Newly created table.xls")
The results are as follows:
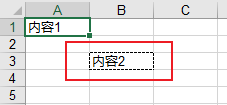
2.7 xlwt Add Border
Program example:
#3.2.7 Add Border
def fun3_2_7():
    #Create a new workbook (that is, create a new excel)
    workbook = xlwt.Workbook(encoding= 'ascii')

    #Create a new sheet table
    worksheet = workbook.add_sheet("My new Sheet")

    #Write to table
    worksheet.write(0,0, "Content 1")

    #Set border style
    borders = xlwt.Borders()  # Create Borders

    # May be:   NO_LINE, THIN, MEDIUM, DASHED, DOTTED, THICK, DOUBLE, HAIR,
    #           MEDIUM_DASHED, THIN_DASH_DOTTED, MEDIUM_DASH_DOTTED, THIN_DASH_DOT_DOTTED,
    #           MEDIUM_DASH_DOT_DOTTED, SLANTED_MEDIUM_DASH_DOTTED, or 0x00 through 0x0D.
    #DASHED dashed line
    #NO_LINE does not
    #THIN Solid Line

    borders.left = xlwt.Borders.DASHED
    borders.right = xlwt.Borders.DASHED
    borders.top = xlwt.Borders.DASHED
    borders.bottom = xlwt.Borders.DASHED
    borders.left_colour = 0x40
    borders.right_colour = 0x40
    borders.top_colour = 0x40
    borders.bottom_colour = 0x40

    style = xlwt.XFStyle()  # Create Style
    style.borders = borders  # Add Borders to Style

    worksheet.write(0, 0, 'Content 1', style)

    worksheet.write(2,1, "Content 2")

    #Save
    workbook.save("Newly created table.xls")
The results are as follows:
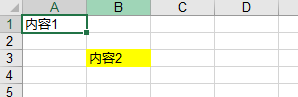
2.8 xlwt sets the background color for cells
Program example:
#Set cell background color
def fun3_2_8():
    #Create a new workbook (that is, create a new excel)
    workbook = xlwt.Workbook(encoding= 'ascii')

    #Create a new sheet table
    worksheet = workbook.add_sheet("My new Sheet")

    #Write to table
    worksheet.write(0,0, "Content 1")

    #Create Styles
    pattern = xlwt.Pattern()

    # May be: NO_PATTERN, SOLID_PATTERN, or 0x00 through 0x12
    pattern.pattern = xlwt.Pattern.SOLID_PATTERN

    # May be: 8 through 63. 0 = Black, 1 = White, 2 = Red, 3 = Green, 4 = Blue, 5 = Yellow,
    # 6 = Magenta, 7 = Cyan, 16 = Maroon, 17 = Dark Green, 18 = Dark Blue, 19 = Dark Yellow ,
    # almost brown), 20 = Dark Magenta, 21 = Teal, 22 = Light Gray, 23 = Dark Gray, the list goes on...
    pattern.pattern_fore_colour = 5
    style = xlwt.XFStyle()
    style.pattern = pattern

    #Use Styles
    worksheet.write(2,1, "Content 2",style)
The results are as follows:
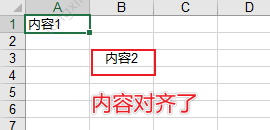
2.9 xlwt Set Cell Alignment
Use Alignment in xlwt to set the alignment of cells, where horz stands for horizontal alignment and vert for vertical alignment.
VERT_TOP = 0x00 top alignment
VERT_CENTER = 0x01 Centered Alignment (Vertical)
VERT_BOTTOM = 0x02 Low Alignment
HORZ_LEFT = 0x01 Left Alignment
HORZ_CENTER = 0x02 centered alignment (horizontal)
HORZ_RIGHT = 0x03 Right Alignment
Program example:
#Set cell alignment
def fun3_2_9():
    #Create a new workbook (that is, create a new excel)
    workbook = xlwt.Workbook(encoding= 'ascii')

    #Create a new sheet table
    worksheet = workbook.add_sheet("My new Sheet")

    #Write to table
    worksheet.write(0,0, "Content 1")

    #Set Style
    style = xlwt.XFStyle()
    al = xlwt.Alignment()
    #VERT_TOP = 0x00 Upper Alignment
    #VERT_CENTER = 0x01) Centered alignment (vertical)
    #VERT_BOTTOM = 0x02) Low Alignment
    #HORZ_LEFT = 0x01 * Left Alignment
    #HORZ_CENTER = 0x02) Centered alignment (horizontal)
    #HORZ_RIGHT = 0x03) Right Alignment
    al.horz = 0x02  #Set horizontal center
    al.vert = 0x01  #Set Vertical Centering
    style.alignment = al

    #Aligned Write
    worksheet.write(2,1, "Content 2",style)

    #Save
    workbook.save("Newly created table.xls")
The results are as follows:
3 Python xlutils modify action Excel
xlutils can be used to copy or modify the original excel and save it.
Official documents: https://xlutils.readthedocs.io/en/latest/
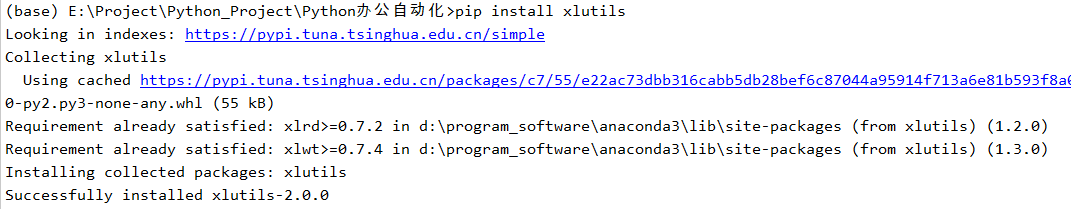
3.1 pip installation xlutils
pip install xlutils
Installation process:
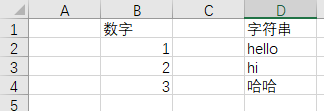
3.2 xlutils Copy Source File (required with xlrd)
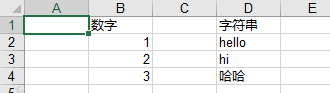
The table is as follows:
Program example:
#3.3.2 Copy source files
def fun3_3_2():
    workbook = xlrd.open_workbook('3_3 xlutils Modify operation exercises.xlsx')  #Open Workbook
    new_workbook = copy(workbook)  #Convert a copy of an xlrd object to an xlwt object
    new_workbook.save("new_test.xls")  #Save Workbook
The results are as follows:
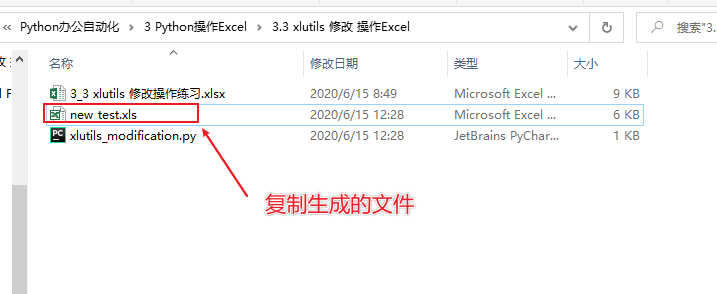
The content is:
But the table's style disappeared altogether.
3.3 xlutils Read and write (that is, modify) Excel table information
Program example:
#3.3.3 xlutils Read and Write Excel Table Information
def fun3_3_3():
# file_path: The file path, containing the full name of the file
# formatting_info=True: Keep Excel in its original format (using xlsx files)
workbook = xlrd.open_workbook('3_3 xlutils Modify operation exercises.xlsx')
new_workbook = copy(workbook) #Convert a copy of an xlrd object to an xlwt object
#Read table information
sheet = workbook.sheet_by_index(0)
col2 = sheet.col_values(1) #Remove the second column
cel_value = sheet.cell_value(1, 1)
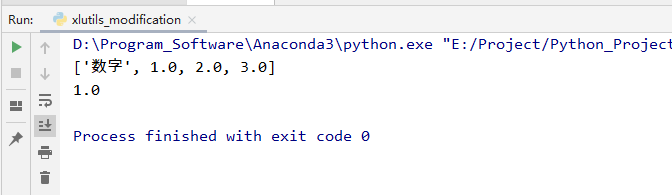
print(col2)
print(cel_value)
#Write table information
write_save = new_workbook.get_sheet(0)
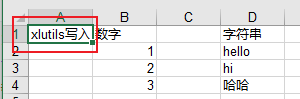
write_save.write(0, 0, "xlutils Write in!")
new_workbook.save("new_test.xls") #Save Workbook
The results are as follows:
Source file information was copied and appended:
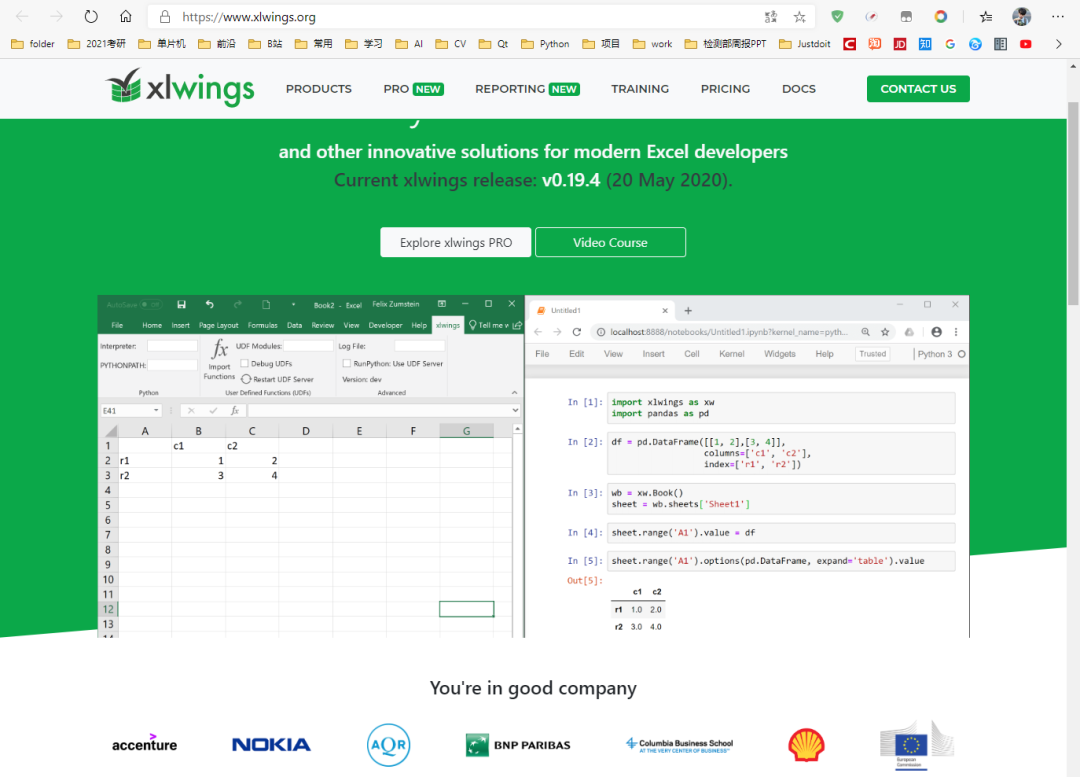
4 Python xlwings Read Write Modify Operation Excel
xlwings is much more luxurious than xlrd, xlwt and xlutils. It has the following features:
-
xlwings can easily read and write data from Excel files, and can modify cell formats
-
It can seamlessly connect with matplotlib and pandas, support reading and writing numpy, pandas data types, and import matplotlib visual charts into excel.
-
You can call programs written in VBA in Excel files, or you can let VBA call programs written in Python.
-
Open Source Free, Always Updated
Official address: https://www.xlwings.org/
Official documents: https://docs.xlwings.org/en/stable/api.html
4.1 pip installation xlwings
pip install xlwings
4.2 Basic Operations
import library
import xlwings as xw
Open Excel program, default setting: program is visible, only open no new workbook
app = xw.App(visible=True,add_book=False)
#Create a new workbook (Excel will just flash by if you don't pick up the next code, and the sale will be off)
wb = app.books.add()
Open an existing Workbook (absolute and relative paths are supported)
wb = app.books.open('example.xlsx')
#When practicing, it is recommended to use the following line directly
#wb = xw.Book('example.xlsx')
#This way, new Excel s don't open frequently
Save Workbook
wb.save('example.xlsx')
Exit Workbook (omitable)
wb.close()
Exit Excel
app.quit()
Three examples:
(1) Open an existing Excel document
#Import xlwings module
import xlwings as xw

#Open Excel program, default settings: the program is visible, only open no new workbook, screen updates close
app=xw.App(visible=True,add_book=False)
app.display_alerts=False
app.screen_updating=False

#File location: filepath, open the test document, then save, close, end the program
filepath=r'g:\Python Scripts\test.xlsx'
wb=app.books.open(filepath)
wb.save()
wb.close()
app.quit()
(2) Create a new Excel document named test.xlsx, and save on disk D
import xlwings as xw

app=xw.App(visible=True,add_book=False)
wb=app.books.add()
wb.save(r'd:\test.xlsx')
wb.close()
app.quit()
(3) Enter values in cells
Create a new test.xlsx, enter "Life" in the first cell of sheet1, then save and close, exit the Excel program.
import xlwings as xw

app=xw.App(visible=True,add_book=False)
wb=app.books.add()

#The wb is the newly created workbook, and the following assigns values to the A1 cell of sheet1 of wb
wb.sheets['sheet1'].range('A1').value='Life'
wb.save(r'd:\test.xlsx')
wb.close()
app.quit()
Open the saved test.xlsx, enter Bitter Short in the second cell of sheet2, then save and close, exit the Excel program
import xlwings as xw

app=xw.App(visible=True,add_book=False)
wb=app.books.open(r'd:\test.xlsx')

#The wb is the newly created workbook, and the following assigns values to the A1 cell of sheet1 of wb
wb.sheets['sheet1'].range('A1').value='Bitter and Short'
wb.save()
wb.close()
app.quit()
With this code in hand, you can either store Excel as a txt text or read the data from an Excel file, calculate it, and save the results in Excel.
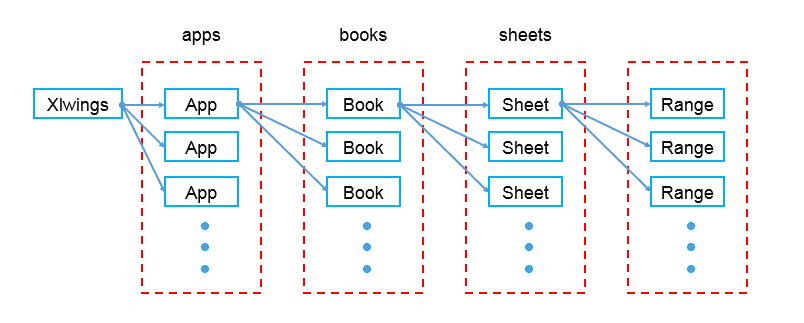
4.3 Referencing workbooks, sheets, and cells
(1) Reference the workbook by name, note that the workbook should be opened first
wb=xw.books['Name of Workbook']
(2) Workbook referencing activities
wb=xw.books.active
(3) Referencing sheet s in workbooks
sht=xw.books['Name of Workbook'].sheets['sheet Name']
#Or
wb=xw.books['Name of Workbook']
sht=wb.sheets[sheet Name]
(4) Referencing the active sheet
sht=xw.sheets.active
(5) Reference to A1 cell
rng=xw.books['Name of Workbook'].sheets['sheet Name']
#Or
sht=xw.books['Name of Workbook'].sheets['sheet Name']
rng=sht.range('A1')
(6) Referencing cells on the active sheet
#Note that the first letters of Range are capitalized
rng=xw.Range('A1')

#It is important to note that the full reference path to the cell is:
#The first cell of the first sheet of the first Excel program's First Workbook
xw.apps[0].books[0].sheets[0].range('A1')
Quickly referencing cells is done by
sht=xw.books['Name'].sheets['Name']

#A1 Cell
rng=sht['A1']

#A1:B5 Cells
rng=sht['A1:B5']

#Cells in row i+1, column j+1
#B1 Cell
rng=sht[0,1]

# A1:J10
rng=sht[:10,:10]

#PS: Cells can also be referenced with tuple s representing rows and columns
#Reference to A1 cell
xw.Range(1,1)

#References to A1:C3 cells
xw.Range((1,1),(3,3))
Reference cell:
rng = sht.range('a1')
#rng = sht['a1']
#rng = sht[0,0] The first column in the first row, a1, is equivalent to the pandas slice
Reference area:
rng = sht.range('a1:a5')
#rng = sht['a1:a5']
#rng = sht[:5,0]
4.4 Write-Read Data
1. Write data
(1) Select the starting cell A1 and write the string'Hello'
sht.range('a1').value = 'Hello'
(2) Write to list
#Row Storage: Store list [1,2,3] in A1:C1
sht.range('A1').value=[1,2,3]
#Column Storage: Store list [1,2,3] in A1:A3
sht.range('A1').options(transpose=True).value=[1,2,3]
#Store 2x2 tables, or two-dimensional arrays, in A1:B2, such as row 1, 2, row 3, 4
sht.range('A1').options(expand='table')=[[1,2],[3,4]]
Default insert by line: A1:D1 writes 1,2,3,4
sht.range('a1').value = [1,2,3,4]
Equivalent to
sht.range('a1:d1').value = [1,2,3,4]
Insert by column: A2:A5 writes 5,6,7,8, respectively
You might think:
sht.range('a2:a5').value = [5,6,7,8]
But you will find that xlwings will still be processed as rows, the above line is the same as:
sht.range('a2').value = [5,6,7,8]
Correct grammar:
sht.range('a2').options(transpose=True).value = [5,6,7,8]
Since the default is to write by line, we'll put it upside down (transpose). The words need to be paired. If you make a mistake, it won't make a mistake. It will write by default line
Multiline input uses a two-dimensional list:
sht.range('a6').expand('table').value = [['a','b','c'],['d','e','f'],['g','h','i']]
2. Read data
(1) Read a single value
#Read the value of A1 into the a variable
a=sht.range('A1').value
(2) Read the value into the list
#Read values from A1 to A2 into the a list
a=sht.range('A1:A2').value
#Read the first and second rows as a two-dimensional array
a=sht.range('A1:B2').value
Select a column of data
Calculate the number of rows in a cell first (provided that the cells are contiguous)
rng = sht.range('a1').expand('table')
nrows = rng.rows.count
Then you can read at the exact range
a = sht.range(f'a1:a{nrows}').value
Select a row of data
ncols = rng.columns.count
#With slices
fst_col = sht[0,:ncols].value
4.5 Common Functions and Methods
1.Book workbook common api
wb=xw.books['Workbook Name']
-
wb.activate() is activated as the current workbook
-
wb.fullname returns the absolute path to the workbook
-
wb.name Returns the name of the workbook
-
wb.save(path=None) saves the workbook, defaulting to the original path of the workbook, or the path of the script if not saved
-
wb. close() close the workbook
Code example:
#Reference to the current workbook in an Excel program
wb=xw.books.acitve
#Return absolute path to Workbook
x=wb.fullname
#Return the name of the workbook
x=wb.name
#Save the workbook, default path is the original Workbook path, or script path if not saved
x=wb.save(path=None)
#Close Workbook
x=wb.close()
2.sheet common api
#Reference to a specified sheet
sht=xw.books['Workbook Name'].sheets['sheet Name of']
#Activate sheet as active sheet
sht.activate()
#Clear sheet contents and formatting
sht.clear()
#Clear sheet contents
sht.contents()
#Get the name of the sheet
sht.name
#Delete sheet
sht.delete
3.range common api
#Cells that reference the current active worksheet
rng=xw.Range('A1')
#Add a hyperlink
# rng.add_hyperlink(r'www.baidu.com','Baidu','Tip: Click to link to Baidu')
#Get the address of the current range
rng.address
rng.get_address()
#Clear range content
rng.clear_contents()
#Clear formatting and content
rng.clear()
#Gets the background color of the range and returns the RGB value as a tuple
rng.color
#Set range color
rng.color=(255,255,255)
#Clear the background color of the range
rng.color=None
#Get the first column label of the range
rng.column
#Return data for cells in range
rng.count
#Return current_region
rng.current_region
#Return to ctrl + direction
rng.end('down')
#Get or enter a formula
rng.formula='=SUM(B1:B5)'
#Array Formula
rng.formula_array
#Get the absolute address of the cell
rng.get_address(row_absolute=True, column_absolute=True,include_sheetname=False, external=False)
#Get Column Width
rng.column_width
#Returns the total width of the range
rng.width
#Get hyperlinks to range s
rng.hyperlink
#Get the last cell in the lower right corner of the range
rng.last_cell
#range Shift
rng.offset(row_offset=0,column_offset=0)
#Range resize to change the size of the range
rng.resize(row_size=None,column_size=None)
#First row label of range
rng.row
#Row height, returns row height as high as all rows, returns None differently
rng.row_height
#Return the total height of the range
rng.height
#Returns the number of rows and columns of a range
rng.shape
#Return the sheet where the range is located
rng.sheet
#Return all rows of range
rng.rows
#First line of range
rng.rows[0]
#Total rows of range
rng.rows.count
#Return all columns of range
rng.columns
#Return the first column of the range
rng.columns[0]
#Number of columns returning range
rng.columns.count
#Size-adaptive for all range s
rng.autofit()
#All Column Widths Adaptive
rng.columns.autofit()
#All Line Width Adaptive
rng.rows.autofit()
4.books Of workbook collection api

#New Workbook
xw.books.add()
#Reference to the current active workbook
xw.books.active
4. Collection of sheets
#New worksheet
xw.sheets.add(name=None,before=None,after=None)
#Reference to the current active sheet
xw.sheets.active
4.6 Data Structure
1. One-dimensional data
python list, which can exchange data with rows and columns in Excel, python one-dimensional list, defaults to one row of data in Excel.
import xlwings as xw

sht=xw.sheets.active

#Write 1, 2, 3 into cells A1, B1, C1, respectively
sht.range('A1').value=[1,2,3]

#Save the values of cells A1, B1, C1 in the list 1
list1=sht.range('A1:C1').value

#Write 1, 2, 3 into cells A1, A2, A3, respectively
sht.range('A1').options(transpose=True).value=[1,2,3]

#Save the median values of A1, A2, A3 cells in the list1 list
list1=sht.range('A1:A3').value
2. Two-dimensional data
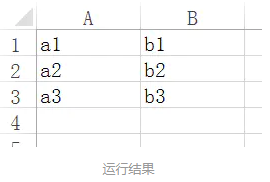
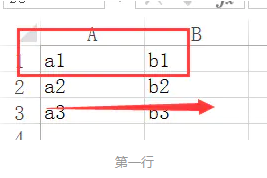
python's two-dimensional list, which can be converted to rows and columns in Excel. A two-dimensional list, that is, whether an element in the list is a list. In Excel, a list element in a two-dimensional list represents a column in an Excel table. For example:
#Enter a1,a2,a3 into the first column, b1,b2,b3 into the second column
list1=[['a1','a2','a3'],['b1','b2','b3']]
sht.range('A1').value=list1
#Assign A1:B3 value to 2-D list 1
list1=sht.range('A1:B3').value
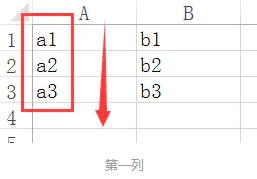
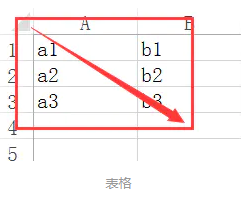
3. Selection table for areas in Excel
#Select the first column
rng=sht. range('A1').expand('down')
rng.value=['a1','a2','a3']
#Select the first row
rng=sht.range('A1').expand('right')
rng=['a1','b1']
#Select Table
rng.sht.range('A1').expand('table')
rng.value=[['a1','a2','a3'],['b1','b2','b3']]
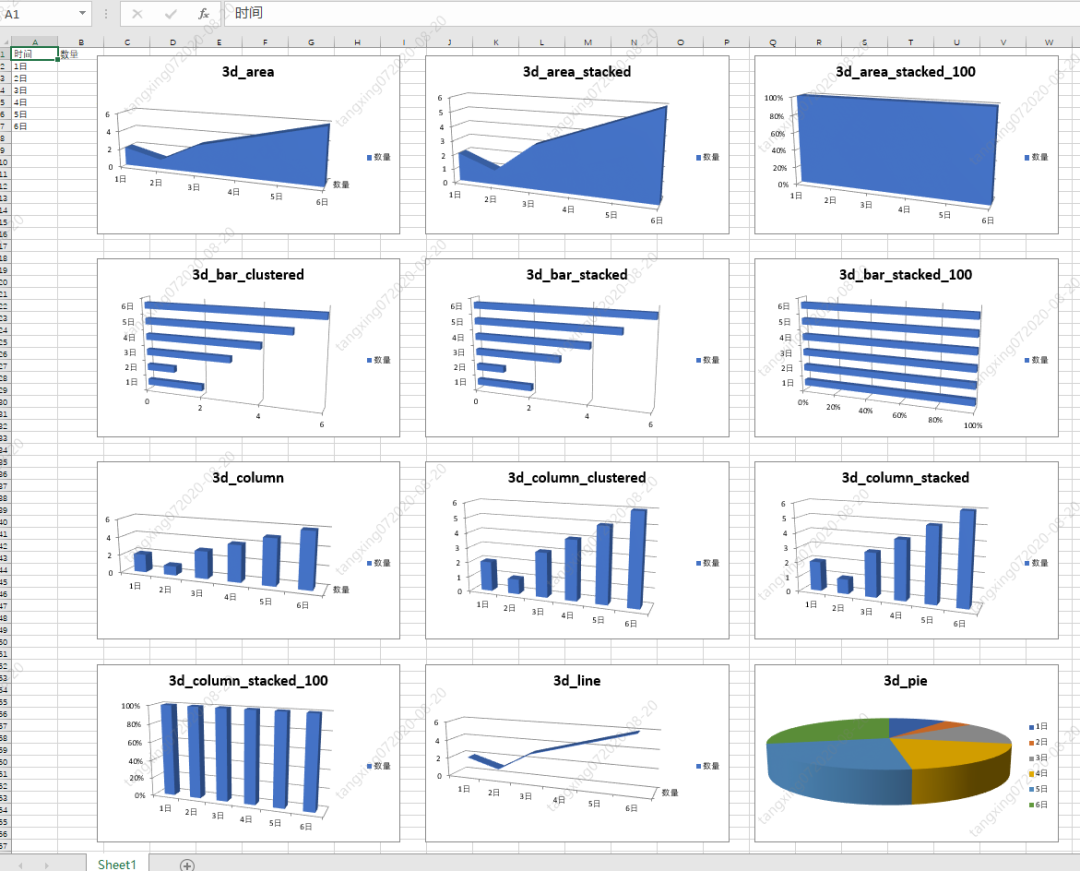
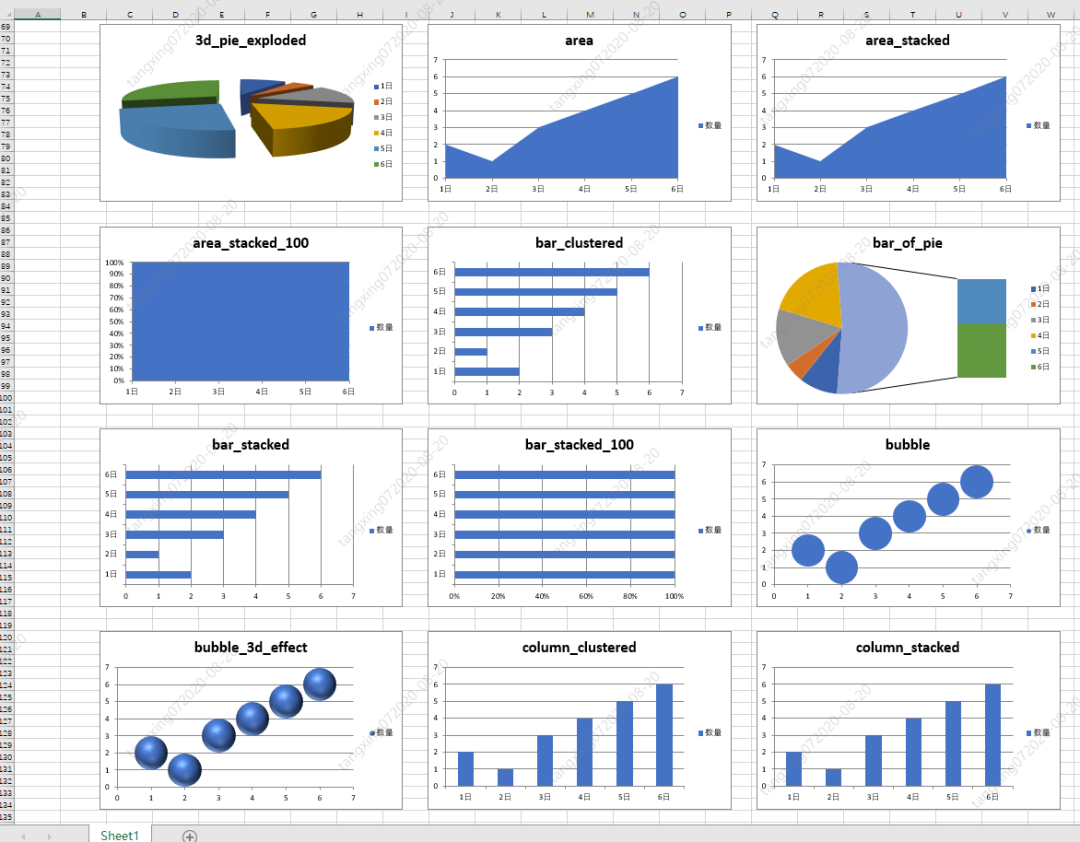
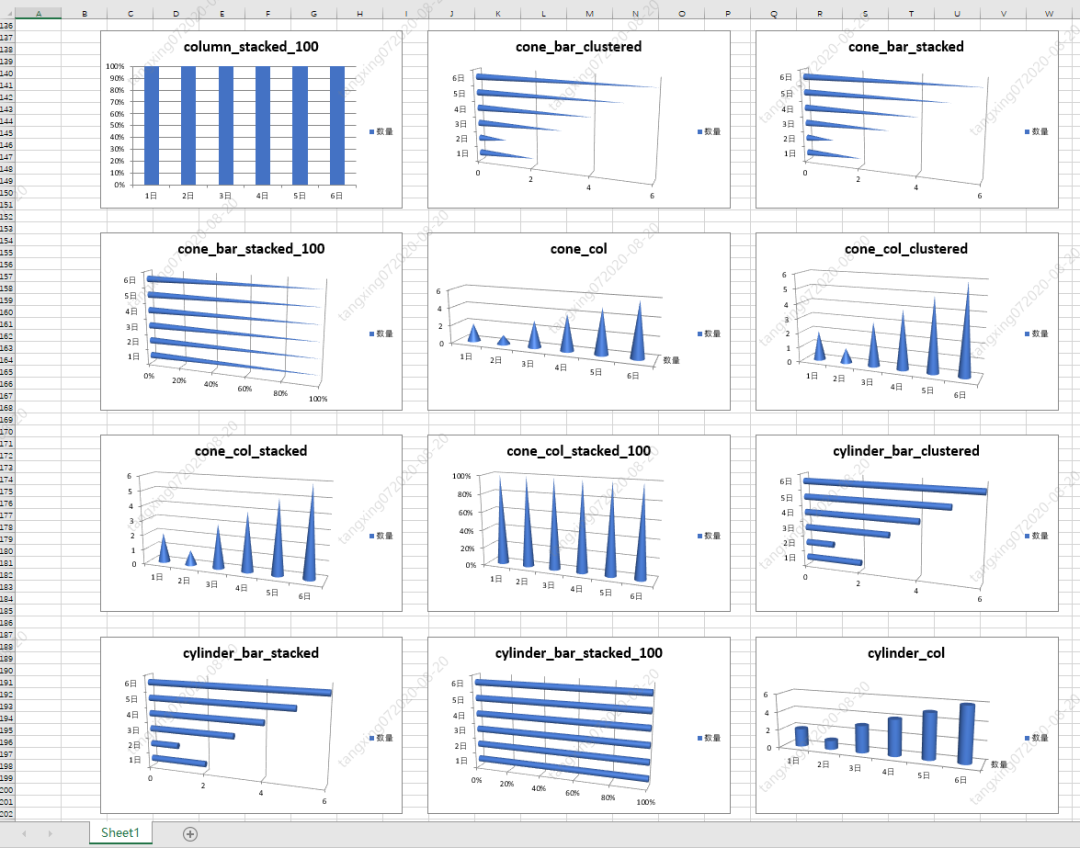
4.7 xlwings Generate Chart
Methods for generating graphs
import xlwings as xw
app = xw.App()
wb = app.books.active
sht = wb.sheets.active

chart = sht.charts.add(100, 10)  # 100,10 Positional coordinates placed for the chart. In pixels.
chart.set_source_data(sht.range('A1').expand())  #The parameter is the data area in the table.
# chart.chart_type = i               #Use to set the chart type, detailed below the specific parameters.
chart.api[1].ChartTitle.Text = i          #Sets the title of the chart.
Sample code:
import xlwings as xw
app = xw.App()
wb = app.books.active
sht = wb.sheets.active
#Data for generating charts
sht.range('A1').value = [['time', 'Number'], ['1 day', 2], ['2 day', 1], ['3 day', 3]
             , ['4 day', 4], ['5 day', 5], ['6 day', 6]]
"""Chart type parameters, the commented ones, cannot generate the corresponding chart"""
dic = {
  '3d_area': -4098,
  '3d_area_stacked': 78,
  '3d_area_stacked_100': 79,
  '3d_bar_clustered': 60,
  '3d_bar_stacked': 61,
  '3d_bar_stacked_100': 62,
  '3d_column': -4100,
  '3d_column_clustered': 54,
  '3d_column_stacked': 55,
  '3d_column_stacked_100': 56,
  '3d_line': -4101,
  '3d_pie': -4102,
  '3d_pie_exploded': 70,
  'area': 1,
  'area_stacked': 76,
  'area_stacked_100': 77,
  'bar_clustered': 57,
  'bar_of_pie': 71,
  'bar_stacked': 58,
  'bar_stacked_100': 59,
  'bubble': 15,
  'bubble_3d_effect': 87,
  'column_clustered': 51,
  'column_stacked': 52,
  'column_stacked_100': 53,
  'cone_bar_clustered': 102,
  'cone_bar_stacked': 103,
  'cone_bar_stacked_100': 104,
  'cone_col': 105,
  'cone_col_clustered': 99,
  'cone_col_stacked': 100,
  'cone_col_stacked_100': 101,
  'cylinder_bar_clustered': 95,
  'cylinder_bar_stacked': 96,
  'cylinder_bar_stacked_100': 97,
  'cylinder_col': 98,
  'cylinder_col_clustered': 92,
  'cylinder_col_stacked': 93,
  'cylinder_col_stacked_100': 94,
  'doughnut': -4120,
  'doughnut_exploded': 80,
  'line': 4,
  'line_markers': 65,
  'line_markers_stacked': 66,
  'line_markers_stacked_100': 67,
  'line_stacked': 63,
  'line_stacked_100': 64,
  'pie': 5,
  'pie_exploded': 69,
  'pie_of_pie': 68,
  'pyramid_bar_clustered': 109,
  'pyramid_bar_stacked': 110,
  'pyramid_bar_stacked_100': 111,
  'pyramid_col': 112,
  'pyramid_col_clustered': 106,
  'pyramid_col_stacked': 107,
  'pyramid_col_stacked_100': 108,
  'radar': -4151,
  'radar_filled': 82,
  'radar_markers': 81,
  # 'stock_hlc': 88,
  # 'stock_ohlc': 89,
  # 'stock_vhlc': 90,
  # 'stock_vohlc': 91,
  # 'surface': 83,
  # 'surface_top_view': 85,
  # 'surface_top_view_wireframe': 86,
  # 'surface_wireframe': 84,
  'xy_scatter': -4169,
  'xy_scatter_lines': 74,
  'xy_scatter_lines_no_markers': 75,
  'xy_scatter_smooth': 72,
  'xy_scatter_smooth_no_markers': 73
}
w = 385
h = 241
n = 0
x = 100
y = 10
for i in dic.keys():
  xx = x + n % 3*w  #The x-coordinate used to generate the placement of the chart.
  yy = y + n//3*h # is used to generate y-coordinates for the placement of the chart.
  chart = sht.charts.add(xx, yy)
  chart.set_source_data(sht.range('A1').expand())
  chart.chart_type = i
  chart.api[1].ChartTitle.Text = i
  n += 1
wb.save('chart_Chart')
wb.close()
app.quit()
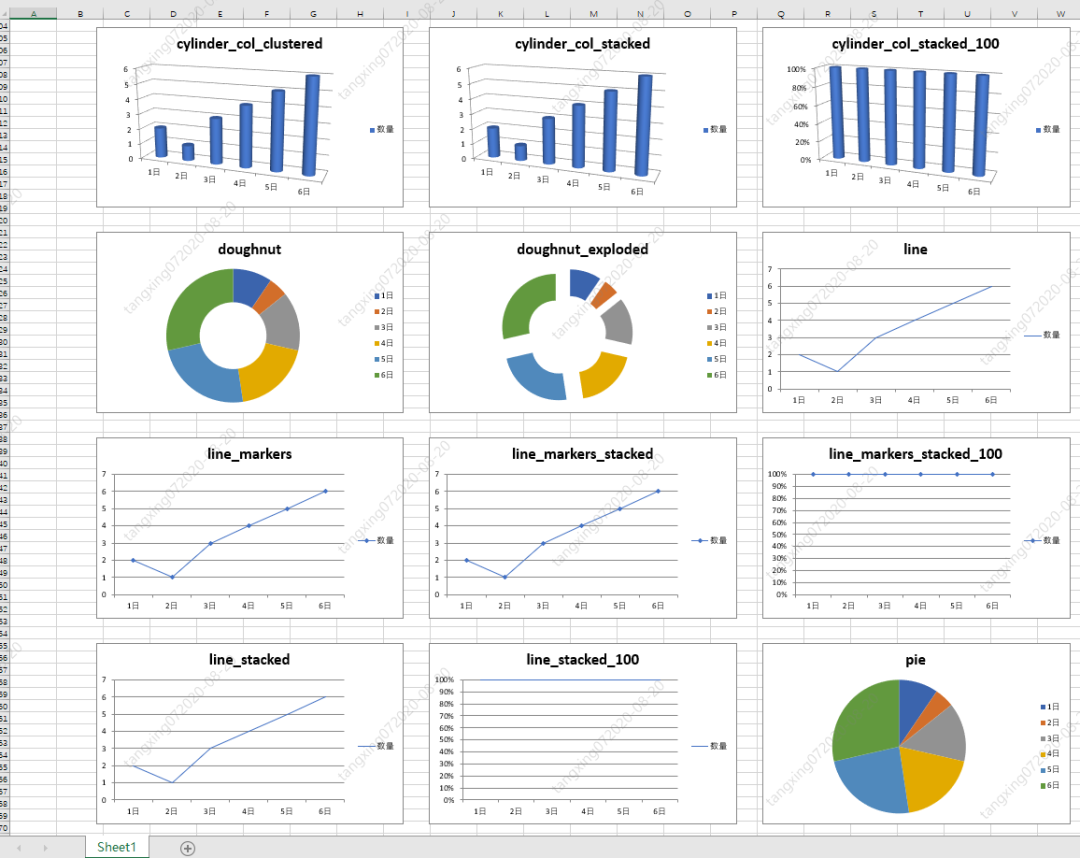
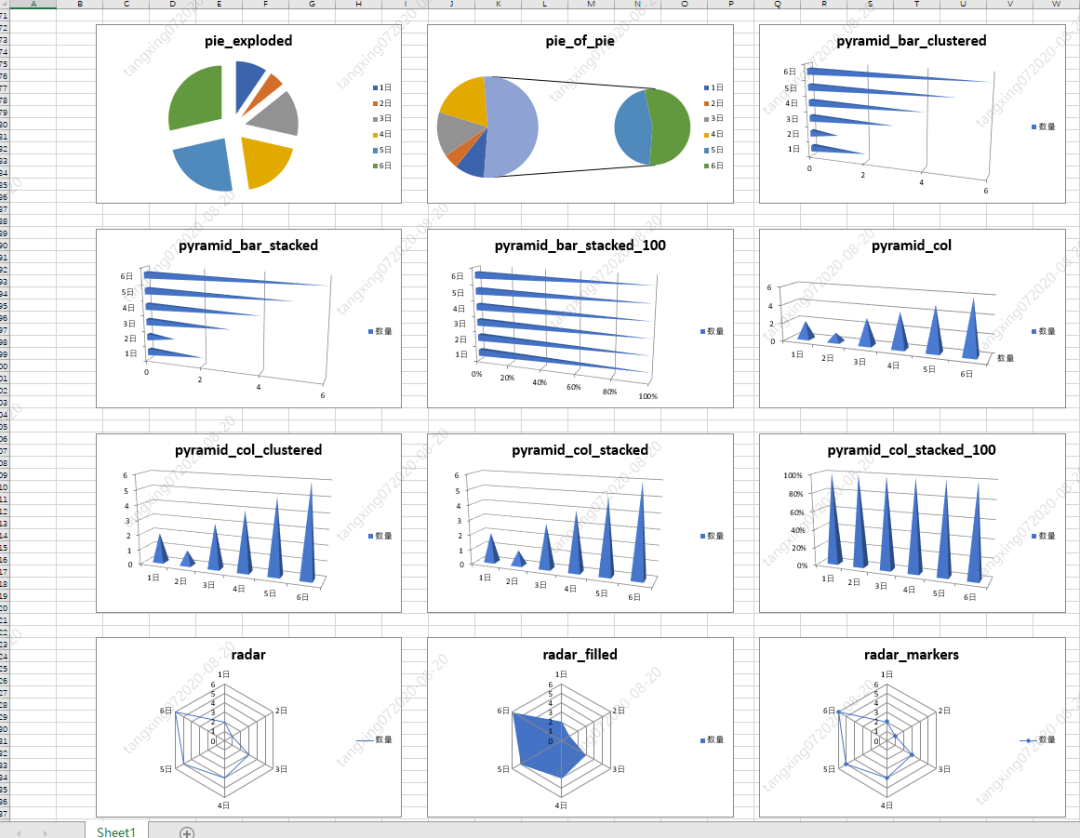
The results are as follows:
4.8 Practical Training
1.xlwings New Excel Document
Program example:
#3.4.2 xlwings New Excle Document
def fun3_4_2():
    """
    visible
    Ture: So excel
    False: Invisible excel

    add_book
    True:open excel And create a new workbook
    False: Do not create a new workbook
    """
    app = xw.App(visible=True, add_book=False)

    #Create a new workbook (Excel will just flash by if you don't pick up the next code, and the sale will be off)
    wb = app.books.add()

    #Save Workbook
    wb.save('example.xlsx')

    #Exit Workbook
    wb.close()

    #Exit Excel
    app.quit()
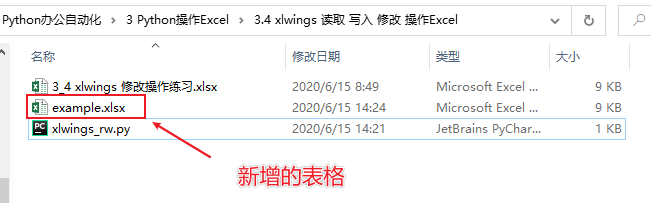
Folder added "example.xlsx" after program execution:
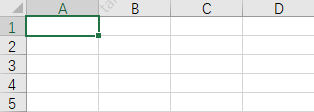
The table is empty at this time:
2.xlwings Open Existing Excel Documents
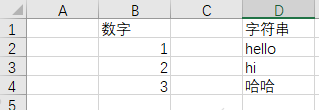
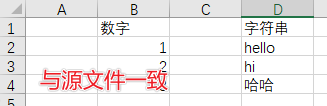
The existing table is as long as this:
Run the program:
#3.4.3 xlwings Open an existing Excel file
def fun3_4_3():
    #New Excle default settings: visible program, only open no new workbook, screen update off
    app = xw.App(visible=True, add_book=False)
    app.display_alerts = False
    app.screen_updating = False

    #Open an existing Excel file
    wb=app.books.open('./3_4 xlwings Modify operation exercises.xlsx')

    #Save Workbook
    wb.save('example_2.xlsx')

    #Exit Workbook
    wb.close()

    #Exit Excel
    app.quit()
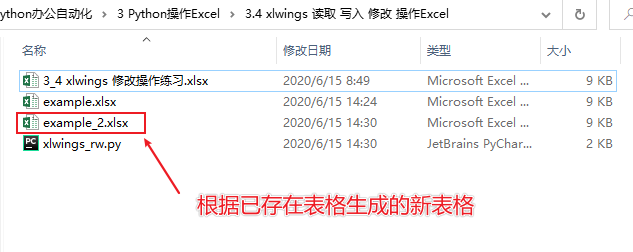
Generate a new table:
The contents are as follows:
3.xlwings Read and Write Excel
Program example:
#3.4.4 xlwings Read Write Excel
def fun3_4_4():
#New Excle default settings: visible program, only open no new workbook, screen update off
app = xw.App(visible=True, add_book=False)
app.display_alerts = False
app.screen_updating = False
#Open an existing Excel file
wb=app.books.open('./3_4 xlwings Modify operation exercises.xlsx')
#Get sheet object
print(wb.sheets)
sheet = wb.sheets[0]
# sheet = wb.sheets["sheet1"]
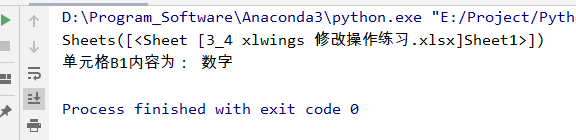
#Read Excel information
cellB1_value = sheet.range('B1').value
print("Cells B1 The content is:",cellB1_value)
#Clear cell contents and formatting
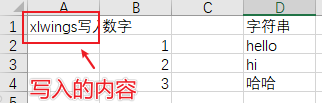
sheet.range('A1').clear()
#Write to Cell
sheet.range('A1').value = "xlwings Write in"
#Save Workbook
wb.save('example_3.xlsx')
#Exit Workbook
wb.close()
#Exit Excel
app.quit()
Execution effect:
4.9 See more
Official xlwings document
Plug in your wings and let Excel fly - xlwings (1)
Plug in your wings and let Excel fly - xlwings(2)
Plug in your wings and let Excel fly - xlwings(3)
Plug in your wings and let Excel fly - xlwings(4)
Python Interacts with Excel - Xlwings
5 Python openpyxl Read Write Modify Operation Excel
In openpyxl, three main concepts are used: Workbooks, Sheets, Cells.
-
Workbook is an excel worksheet;
-
Sheet is a table page in a worksheet;
-
Cell is a simple cell.
openpyxl revolves around these three concepts, reading and writing are "three axes": opening Workbook, locating Sheet, and manipulating Cell.
Official documents: https://openpyxl.readthedocs.io/en/stable/
Official example:
from openpyxl import Workbook
wb = Workbook()

# grab the active worksheet
ws = wb.active

# Data can be assigned directly to cells
ws['A1'] = 42

# Rows can also be appended
ws.append([1, 2, 3])

# Python types will automatically be converted
import datetime
ws['A2'] = datetime.datetime.now()

# Save the file
wb.save("sample.xlsx")
5.1 openpyxl Basic Operations
1. Installation
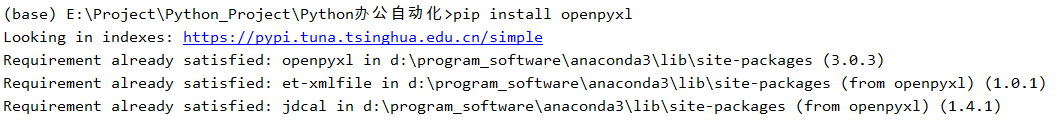
pip install openpyxl
Because I have already installed it, the following information is prompted:
2. Open Files
(1) New
from  openpyxl import  Workbook
#Instantiation
wb = Workbook()
#Activate worksheet
ws = wb.active
(2) Open the existing
from openpyxl  import load_workbook

wb = load_workbook('File Name.xlsx')
3. Writing data
#Mode 1: Data can be directly assigned to cells (formulas can be entered)
ws['A1'] = 42
#Mode 2: You can attach rows, starting with the first column (from the bottom space, to the left) (you can enter multiple rows)
ws.append([1, 2, 3])
#Mode 3: Python types are automatically converted
ws['A3'] = datetime.datetime.now().strftime("%Y-%m-%d")
4. Create a sheet
#Mode 1: Insert at the end (default)
ws1 = wb.create_sheet("Mysheet")
#Mode 2: Insert at the beginning
ws2 = wb.create_sheet("Mysheet", 0)
5. Select a sheet
#The sheet name can be indexed as a key
>>> ws3 = wb["New Title"]
>>> ws4 = wb.get_sheet_by_name("New Title")
>>> ws is ws3 is ws4
True
6. View the table name (sheet)
#Display all table names
>>> print(wb.sheetnames)
['Sheet2', 'New Title',  'Sheet1']
#Traverse all tables
>>> for sheet in  wb:
...     print(sheet.title)
7. Access cell s
(1) Single cell access
#Method 1
>>> c = ws['A4']
#Method 2: row row row; Column column
>>> d = ws.cell(row=4, column=2, value=10)
#Method 3: Create whenever accessed
>>> for i in  range(1,101):
...         for j in range(1,101):
...            ws.cell(row=i, column=j)
(2) Multiple cell access
#By slicing
>>> cell_range = ws['A1':'C2']
#By row (column)
>>> colC = ws['C']
>>> col_range = ws['C:D']
>>> row10 = ws[10]
>>> row_range = ws[5:10]
#By specifying a range (line line)
>>> for row in  ws.iter_rows(min_row=1, max_col=3, max_row=2):
...    for cell in  row:
...        print(cell)
<Cell Sheet1.A1>
<Cell Sheet1.B1>
<Cell Sheet1.C1>
<Cell Sheet1.A2>
<Cell Sheet1.B2>
<Cell Sheet1.C2>
#By specifying a range (column column)
>>> for row in  ws.iter_rows(min_row=1, max_col=3, max_row=2):
...    for cell in  row:
...        print(cell)
<Cell Sheet1.A1>
<Cell Sheet1.B1>
<Cell Sheet1.C1>
<Cell Sheet1.A2>
<Cell Sheet1.B2>
<Cell Sheet1.C2>
#Traverse all method one
>>> ws = wb.active
>>> ws['C9'] = 'hello world'
>>> tuple(ws.rows)
((<Cell Sheet.A1>, <Cell Sheet.B1>, <Cell Sheet.C1>),
(<Cell Sheet.A2>, <Cell Sheet.B2>, <Cell Sheet.C2>),
...
(<Cell Sheet.A8>, <Cell Sheet.B8>, <Cell Sheet.C8>),
(<Cell Sheet.A9>, <Cell Sheet.B9>, <Cell Sheet.C9>))
#Traverse all method 2
>>> tuple(ws.columns)
((<Cell Sheet.A1>,
<Cell Sheet.A2>,
<Cell Sheet.A3>,
...
<Cell Sheet.B7>,
<Cell Sheet.B8>,
<Cell Sheet.B9>),
(<Cell Sheet.C1>,
...
<Cell Sheet.C8>,
<Cell Sheet.C9>))
8. Save data
wb.save('File Name.xlsx')
9. Other
(1) Change the color of sheet label buttons
ws.sheet_properties.tabColor = "1072BA" #The color value is RGB16
(2) Get the largest row, the largest column
#Get the largest columns and rows
print(sheet.max_row)
print(sheet.max_column)
(3) Get each row and column
sheet.rows are generators, with data for each row wrapped in a tuple.
sheet.columns are similar, but each tuple is a cell in each column.
#Returns the order A1, B1, C1 because they are by line
for row in sheet.rows:
    for cell in row:
        print(cell.value)

#Order A1, A2, A3
for column in sheet.columns:
    for cell in column:
        print(cell.value)
(4) Get letters from numbers and numbers from letters
from openpyxl.utils import get_column_letter, column_index_from_string

#Return letters based on column numbers
print(get_column_letter(2))  # B
#Returns the number of a column based on its letters
print(column_index_from_string('D'))  # 4
(5) Delete worksheets
#Mode 1
wb.remove(sheet)
#Mode 2
del wb[sheet]
(6) Matrix Substitution
rows = [
    ['Number', 'data1', 'data2'],
    [2, 40, 30],
    [3, 40, 25],
    [4, 50, 30],
    [5, 30, 10],
    [6, 25, 5],
    [7, 50, 10]]

list(zip(*rows))

# out
[('Number', 2, 3, 4, 5, 6, 7),
 ('data1', 40, 40, 50, 30, 25, 50),
 ('data2', 30, 25, 30, 10, 5, 10)]

#Note that the method discards columns (rows) that lack data
rows = [
    ['Number', 'data1', 'data2'],
    [2, 40      ],    #One less data here
    [3, 40, 25],
    [4, 50, 30],
    [5, 30, 10],
    [6, 25, 5],
    [7, 50, 10],
]
# out
[('Number', 2, 3, 4, 5, 6, 7), ('data1', 40, 40, 50, 30, 25, 50)]
10. Set Cell Style
(1) Classes to be imported
from openpyxl.styles import Font, colors, Alignment
(2) Fonts
The code below specifies isoline 24, bold italic, and red font color. Assign a Font object to the cell using its font property directly.
bold_itatic_24_font = Font(name='Isolines', size=24, italic=True, color=colors.RED, bold=True)

sheet['A1'].font = bold_itatic_24_font
(3) Alignment
It also uses the cell's attribute aligment directly, where vertical and horizontal centering are specified. In addition to center, you can also use right, left, and so on parameters
#Set vertical and horizontal centering of data in B1
sheet['B1'].alignment = Alignment(horizontal='center', vertical='center')
(4) Setting row height and column width
#Row 2 Height
sheet.row_dimensions[2].height = 40
#Column C Width
sheet.column_dimensions['C'].width = 30
(5) Merging and splitting cells
-
The so-called merged cell refers to the cell in the upper left corner of the merged area as the base, overwriting other cells so that they are called a large cell.
-
Instead, split the cell and return the value of the large cell to its original upper left corner.
#Merge cells, write data to the top left corner
sheet.merge_cells('B1:G1') #Merge several cells in a row
sheet.merge_cells('A1:C3') #Merge cells in a rectangular area
-
After merging, only the upper left corner of the data can be written, that is, the coordinates in the interval: the left side.
-
If the cells to be merged have data, only the upper left corner will be preserved, and the others will be discarded. In other words, if data is not written in the upper left corner before merging, there will be no data in the merged cell.
-
Here is the code for splitting cells. After splitting, the value returns to A1
sheet.unmerge_cells('A1:C3')
11. Sample Code
import datetime
from random import choice
from time import time
from openpyxl import load_workbook
from openpyxl.utils import get_column_letter

#Settings file mingc
addr = "openpyxl.xlsx"
#Open File
wb = load_workbook(addr)
#Create a new table
ws = wb.create_sheet()
#First line input
ws.append(['TIME', 'TITLE', 'A-Z'])

#Enter content (500 rows of data)
for i in range(500):
    TIME = datetime.datetime.now().strftime("%H:%M:%S")
    TITLE = str(time())
    A_Z = get_column_letter(choice(range(1, 50)))
    ws.append([TIME, TITLE, A_Z])

#Get the maximum row
row_max = ws.max_row
#Get the largest column
con_max = ws.max_column
#Print the writing on the console
for j in ws.rows:    #we.rows Get each row of data
    for n in j:
        print(n.value, end="\t")   #n.value Gets the value of the cell
    print()
#Save, save (must write file name (absolute address) Default py sibling directory, only supports xlsx format)
wb.save(addr)
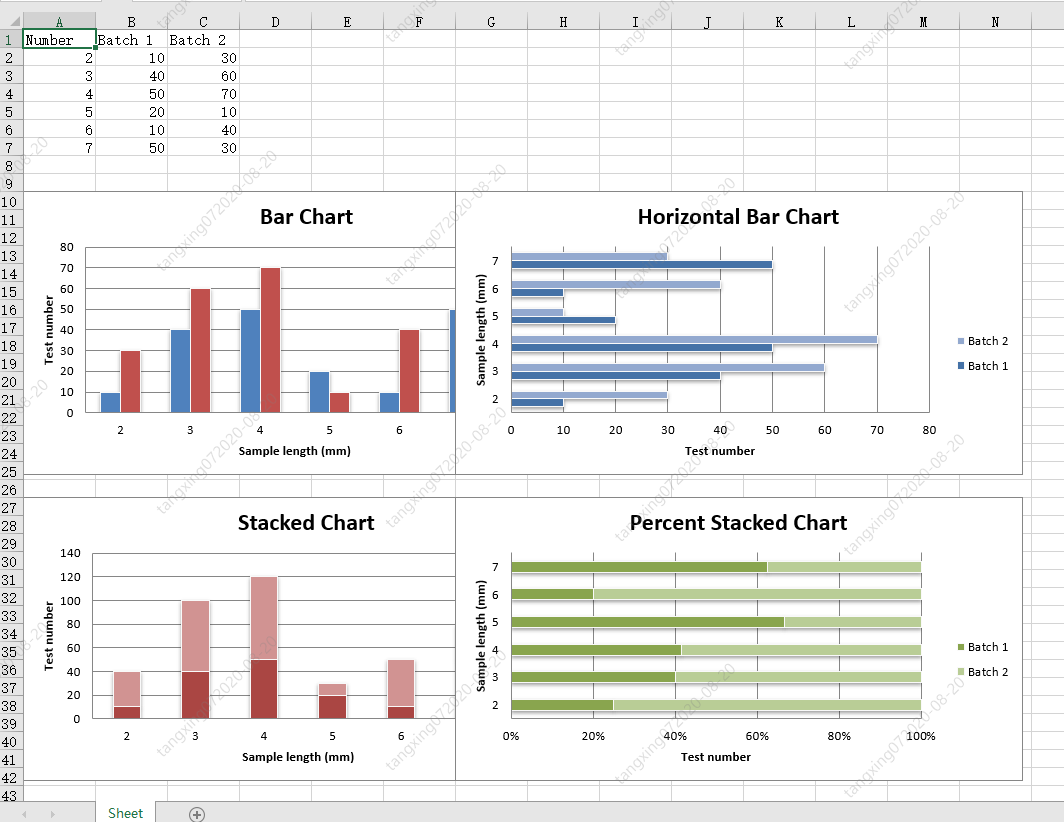
5.2 openpyxl to generate 2D charts
Sample code:
from openpyxl import Workbook
from openpyxl.chart import BarChart, Series, Reference

wb = Workbook(write_only=True)
ws = wb.create_sheet()

rows = [
    ('Number', 'Batch 1', 'Batch 2'),
    (2, 10, 30),
    (3, 40, 60),
    (4, 50, 70),
    (5, 20, 10),
    (6, 10, 40),
    (7, 50, 30),
]

for row in rows:
    ws.append(row)

chart1 = BarChart()
chart1.type = "col"
chart1.style = 10
chart1.title = "Bar Chart"
chart1.y_axis.title = 'Test number'
chart1.x_axis.title = 'Sample length (mm)'

data = Reference(ws, min_col=2, min_row=1, max_row=7, max_col=3)
cats = Reference(ws, min_col=1, min_row=2, max_row=7)
chart1.add_data(data, titles_from_data=True)
chart1.set_categories(cats)
chart1.shape = 4
ws.add_chart(chart1, "A10")

from copy import deepcopy

chart2 = deepcopy(chart1)
chart2.style = 11
chart2.type = "bar"
chart2.title = "Horizontal Bar Chart"
ws.add_chart(chart2, "G10")

chart3 = deepcopy(chart1)
chart3.type = "col"
chart3.style = 12
chart3.grouping = "stacked"
chart3.overlap = 100
chart3.title = 'Stacked Chart'
ws.add_chart(chart3, "A27")

chart4 = deepcopy(chart1)
chart4.type = "bar"
chart4.style = 13
chart4.grouping = "percentStacked"
chart4.overlap = 100
chart4.title = 'Percent Stacked Chart'
ws.add_chart(chart4, "G27")

wb.save("bar.xlsx")
The results are as follows:
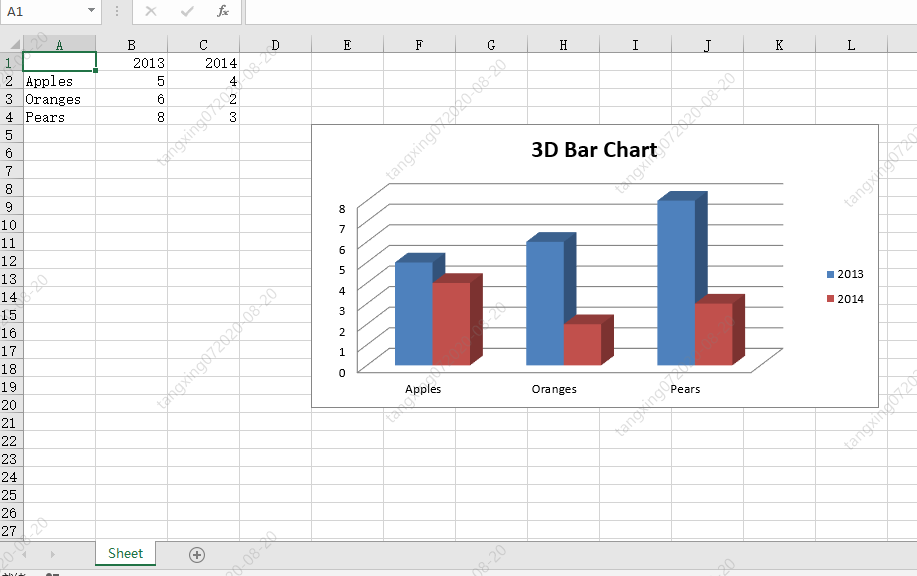
5.3 openpyxl to generate 3D charts
Sample code:
from openpyxl import Workbook
from openpyxl.chart import (
    Reference,
    Series,
    BarChart3D,
)

wb = Workbook()
ws = wb.active

rows = [
    (None, 2013, 2014),
    ("Apples", 5, 4),
    ("Oranges", 6, 2),
    ("Pears", 8, 3)
]

for row in rows:
    ws.append(row)

data = Reference(ws, min_col=2, min_row=1, max_col=3, max_row=4)
titles = Reference(ws, min_col=1, min_row=2, max_row=4)
chart = BarChart3D()
chart.title = "3D Bar Chart"
chart.add_data(data=data, titles_from_data=True)
chart.set_categories(titles)

ws.add_chart(chart, "E5")
wb.save("bar3d.xlsx")
The results are as follows:
5.4 Practical Training
1.openpyxl New Excel
Program example:
#3.5.2 openpyxl New Excel
def fun3_5_2():
wb = Workbook()
#Note: This function calls the index of the worksheet (_active_sheet_index), which defaults to 0.
#Unless you modify this value, you will always be working on the first sheet using this function.
ws = wb.active
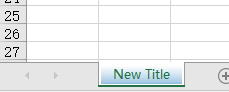
#Set sheet name
ws.title = "New Title"
#Set sheet color
ws.sheet_properties.tabColor = "1072BA"
#Save Form
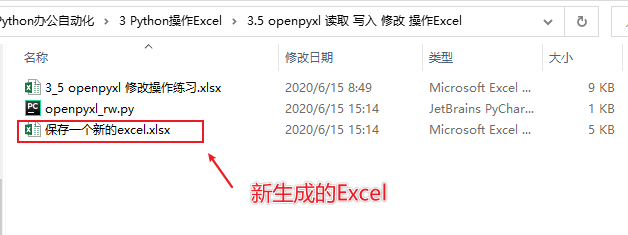
wb.save('Save a new excel.xlsx')
Execution effect:
Title and background colors are set for the sheet:
2.openpyxl Opens an existing Excel
Program example:
#3.5.3 openpyxl Open Existing Excel
def fun3_5_3():
wb = load_workbook("./3_5 openpyxl Modify operation exercises.xlsx")
#Note: This function calls the index of the worksheet (_active_sheet_index), which defaults to 0.
#Unless you modify this value, you will always be working on the first sheet using this function.
ws = wb.active
#Save Form
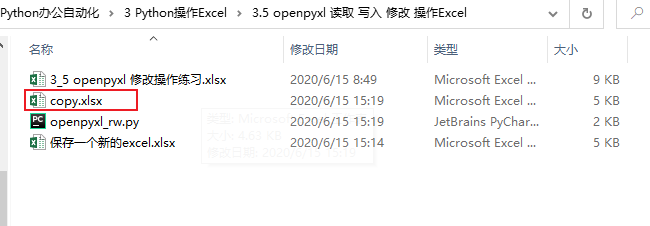
wb.save('copy.xlsx')
The results are as follows:
3.openpyxl Read and Write Excel
Program example:
#3.5.4 openpyxl Read and Write Excel
def fun3_5_4():
wb = load_workbook("./3_5 openpyxl Modify operation exercises.xlsx")
#Note: This function calls the index of the worksheet (_active_sheet_index), which defaults to 0.
#Unless you modify this value, you will always be working on the first sheet using this function.
ws = wb.active
#Read cell information
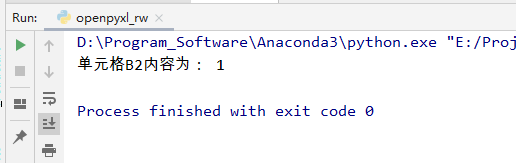
cellB2_value = ws['B2'].value
print("Cells B2 The content is:",cellB2_value)
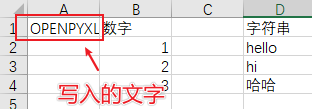
#Write to Cell
ws['A1'].value = "OPENPYXL"
#Save Form
wb.save('copy.xlsx')
Execution results:
6 Python xlswriter write operation Excel
XlsxWriter is a python module for writing Excel2007 and xlsx file formats. It can be used to write text, numbers, formulas and supports cell formatting, pictures, charts, document configuration, automatic filtering, and other features
Advantages: more features, document fidelity, extended format type, faster and configurable drawbacks: cannot be used to read and modify excel files
Official documents: https://xlsxwriter.readthedocs.io/
6.1 xlswriter Basic Operations
1. Install xlswriter module
pip install XlsxWriter
Since I have already installed it, the prompt is already installed:

2. Create excel file
#Create a file
workbook = xlsxwriter.Workbook("new_excel.xlsx")
3. Create sheet s
#Create sheet s
worksheet = workbook.add_worksheet("first_sheet")
4. Write data
(1) Writing text
#Fa I:
worksheet.write('A1', 'write something')
#Fa II:
worksheet.write(1, 0, 'hello world')
(2) Writing numbers
#Write numbers
worksheet.write(0, 1, 32)
worksheet.write(1, 1, 32.3)
(3) Write function
worksheet.write(2, 1, '=sum(B1:B2)')
(4) Write pictures
#Insert Picture
worksheet.insert_image(0, 5, 'test.png')
worksheet.insert_image(0, 5, 'test.png', {'url': 'http://httpbin.org/'})
(5) Writing date
#Write Date
d = workbook.add_format({'num_format': 'yyyy-mm-dd'})
worksheet.write(0, 2, datetime.datetime.strptime('2017-09-13', '%Y-%m-%d'), d)
(6) Setting row and column attributes
#Set row properties and row height to 40
worksheet.set_row(0, 40)

#Set column properties and set column A to B widths to 20
worksheet.set_column('A:B', 20)
5. Custom Format
Common formats:
-
Font color:
-
Bold font: bold
-
Font size: font_site
-
Date format: num_format
-
Hyperlink: url
-
Underline setting: underline
-
Cell color: bg_color
-
Border:border
-
Alignment: align
#Custom Format
f = workbook.add_format({'border': 1, 'font_size': 13, 'bold': True, 'align': 'center','bg_color': 'cccccc'})
worksheet.write('A3', "python excel", f)
worksheet.set_row(0, 40, f)
worksheet.set_column('A:E', 20, f)
6. Bulk write data to cells
#Bulk write data to cells
worksheet.write_column('A15', [1, 2, 3, 4, 5])  #Column writing, starting at A15
worksheet.write_row('A12', [6, 7, 8, 9])        #Line write, starting with A12
7. Merge cell writing
#Merge cell writes
worksheet.merge_range(7,5, 11, 8, 'merge_range')
8. Close the file
workbook.close()
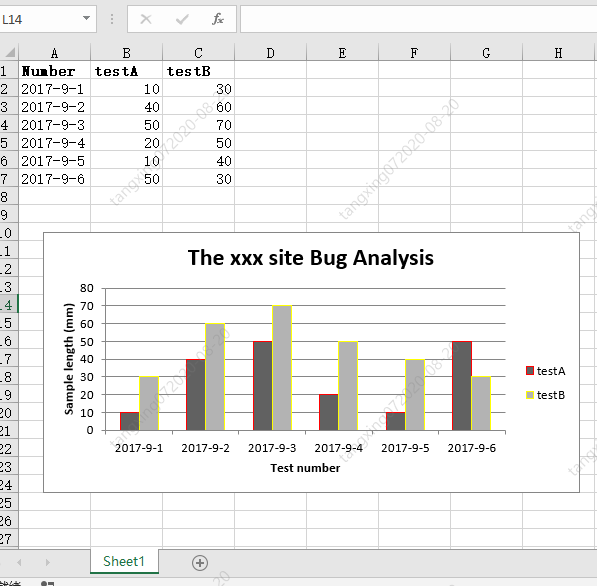
6.3 xlswriter to generate line graphs
Sample code:
# -*- coding:utf-8 -*-
import xlsxwriter
#Create an excel
workbook = xlsxwriter.Workbook("chart_line.xlsx")
#Create a sheet
worksheet = workbook.add_worksheet()
# worksheet = workbook.add_worksheet("bug_analysis")
#Custom Style, Bold
bold = workbook.add_format({'bold': 1})
#-------------1, Prepare data and write excel---------------
#Write data to excel and use when creating icons
headings = ['Number', 'testA', 'testB']
data = [
['2017-9-1', '2017-9-2', '2017-9-3', '2017-9-4', '2017-9-5', '2017-9-6'],
[10, 40, 50, 20, 10, 50],
[30, 60, 70, 50, 40, 30],
]
#Write to Header
worksheet.write_row('A1', headings, bold)
#Write data
worksheet.write_column('A2', data[0])
worksheet.write_column('B2', data[1])
worksheet.write_column('C2', data[2])
#-----------------------2, Generate a chart and insert it into excel-----------------
#Create a line chart
chart_col = workbook.add_chart({'type': 'line'})
#Configure the first series of data
chart_col.add_series({
#Sheet 1 here is the default because we did not specify a sheet name when we created the sheet
#If we set the sheet name when we create a new sheet, set it here
'name': '=Sheet1!$B$1',
'categories': '=Sheet1!$A$2:$A$7',
'values': '=Sheet1!$B$2:$B$7',
'line': {'color': 'red'},
})
#Configure the second series of data
chart_col.add_series({
'name': '=Sheet1!$C$1',
'categories': '=Sheet1!$A$2:$A$7',
'values': '=Sheet1!$C$2:$C$7',
'line': {'color': 'yellow'},
})
#Configure the second series of data (using another syntax)
# chart_col.add_series({
# 'name': ['Sheet1', 0, 2],
# 'categories': ['Sheet1', 1, 0, 6, 0],
# 'values': ['Sheet1', 1, 2, 6, 2],
# 'line': {'color': 'yellow'},
# })
#Set the title and x, y axis information of the chart
chart_col.set_title({'name': 'The xxx site Bug Analysis'})
chart_col.set_x_axis({'name': 'Test number'})
chart_col.set_y_axis({'name': 'Sample length (mm)'})
#Set the style of the chart
chart_col.set_style(1)
#Insert the chart into the worksheet and set an offset
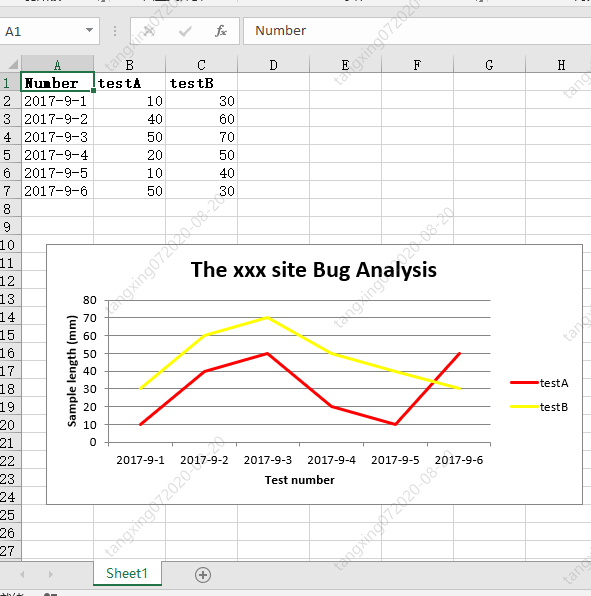
worksheet.insert_chart('A10', chart_col, {'x_offset': 25, 'y_offset': 10})
workbook.close()
The results are as follows:
6.4 xlswriter to produce a column chart
Sample code:
# -*- coding:utf-8 -*-

import xlsxwriter

#Create an excel
workbook = xlsxwriter.Workbook("chart_column.xlsx")
#Create a sheet
worksheet = workbook.add_worksheet()
# worksheet = workbook.add_worksheet("bug_analysis")

#Custom Style, Bold
bold = workbook.add_format({'bold': 1})

#-------------1, Prepare data and write excel---------------
#Write data to excel and use when creating icons
headings = ['Number', 'testA', 'testB']
data = [
    ['2017-9-1', '2017-9-2', '2017-9-3', '2017-9-4', '2017-9-5', '2017-9-6'],
    [10, 40, 50, 20, 10, 50],
    [30, 60, 70, 50, 40, 30],
]

#Write to Header
worksheet.write_row('A1', headings, bold)

#Write data
worksheet.write_column('A2', data[0])
worksheet.write_column('B2', data[1])
worksheet.write_column('C2', data[2])

#-----------------------2, Generate a chart and insert it into excel-----------------
#Create a column chart
chart_col = workbook.add_chart({'type': 'column'})

#Configure the first series of data
chart_col.add_series({
    #Sheet 1 here is the default because we did not specify a sheet name when we created the sheet
    #If we set the sheet name when we create a new sheet, set it here
    'name': '=Sheet1!$B$1',
    'categories': '=Sheet1!$A$2:$A$7',
    'values':   '=Sheet1!$B$2:$B$7',
    'line': {'color': 'red'},
})

#Configure the second series of data (using another syntax)
chart_col.add_series({
    'name': '=Sheet1!$C$1',
    'categories':  '=Sheet1!$A$2:$A$7',
    'values':   '=Sheet1!$C$2:$C$7',
    'line': {'color': 'yellow'},
})

#Configure the second series of data (using another syntax)
# chart_col.add_series({
#     'name': ['Sheet1', 0, 2],
#     'categories': ['Sheet1', 1, 0, 6, 0],
#     'values': ['Sheet1', 1, 2, 6, 2],
#     'line': {'color': 'yellow'},
# })

#Set the title and x, y axis information of the chart
chart_col.set_title({'name': 'The xxx site Bug Analysis'})
chart_col.set_x_axis({'name': 'Test number'})
chart_col.set_y_axis({'name':  'Sample length (mm)'})

#Set the style of the chart
chart_col.set_style(1)

#Insert charts into worksheet s and offsets
worksheet.insert_chart('A10', chart_col, {'x_offset': 25, 'y_offset': 10})

workbook.close()
The results are as follows:
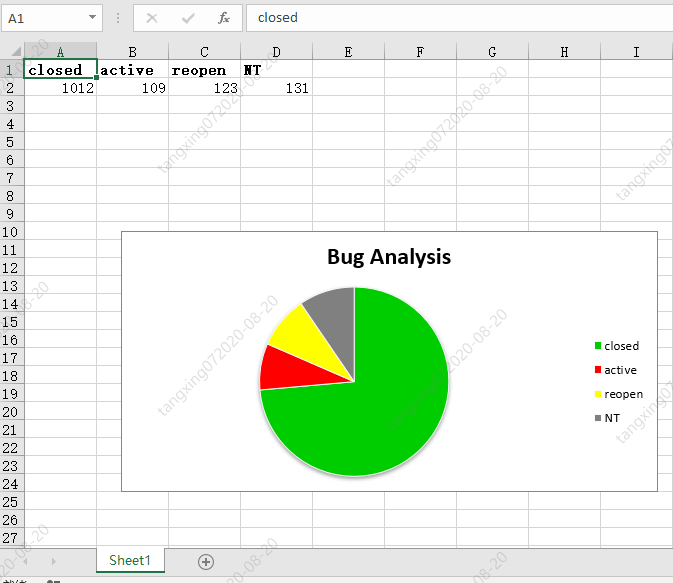
6.5 xlswriter to generate pie charts
Sample code:
# -*- coding:utf-8 -*-

import xlsxwriter

#Create an excel
workbook = xlsxwriter.Workbook("chart_pie.xlsx")
#Create a sheet
worksheet = workbook.add_worksheet()

#Custom Style, Bold
bold = workbook.add_format({'bold': 1})

#-------------1, Prepare data and write excel---------------
#Write data to excel and use when creating icons
data = [
    ['closed', 'active', 'reopen', 'NT'],
    [1012, 109, 123, 131],
]

#Write data
worksheet.write_row('A1', data[0], bold)
worksheet.write_row('A2', data[1])

#-----------------------2, Generate a chart and insert it into excel-----------------
#Create a pie chart
chart_col = workbook.add_chart({'type': 'pie'})

#Configure the first series of data
chart_col.add_series({
    'name': 'Bug Analysis',
    'categories': '=Sheet1!$A$1:$D$1',
    'values': '=Sheet1!$A$2:$D$2',
    'points': [
        {'fill': {'color': '#00CD00'}},
        {'fill': {'color': 'red'}},
        {'fill': {'color': 'yellow'}},
        {'fill': {'color': 'gray'}},
    ],

})

#Set the title and x, y axis information of the chart
chart_col.set_title({'name': 'Bug Analysis'})

#Set the style of the chart
chart_col.set_style(10)

#Insert charts into worksheet s and offsets
worksheet.insert_chart('B10', chart_col, {'x_offset': 25, 'y_offset': 10})
workbook.close()
The results are as follows:
6.6 Practical Training
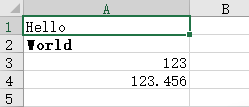
1.xlswriter New and Write Excel
Program example:
#3.6.2 xlswriter New and Write Excel
def fun3_6_2():
    #Create Exce l and add sheet s
    workbook = xlsxwriter.Workbook('demo.xlsx')
    worksheet = workbook.add_worksheet()

    #Set Column Width
    worksheet.set_column('A:A', 20)

    #Formatting
    bold = workbook.add_format({'bold': True})

    #Add text content
    worksheet.write('A1', 'Hello')

    #Add content by format
    worksheet.write('A2', 'World', bold)

    #Write some numbers
    worksheet.write(2, 0, 123)
    worksheet.write(3, 0, 123.456)

    #Add a picture
    worksheet.insert_image('B5', 'demo.png')

    workbook.close()
The results are as follows:
7 Python win32com Read Write Modify Operation Excel
python can use a third-party library called win32com for the purpose of operating com. win32com is powerful and can manipulate word s, call macros, and so on.
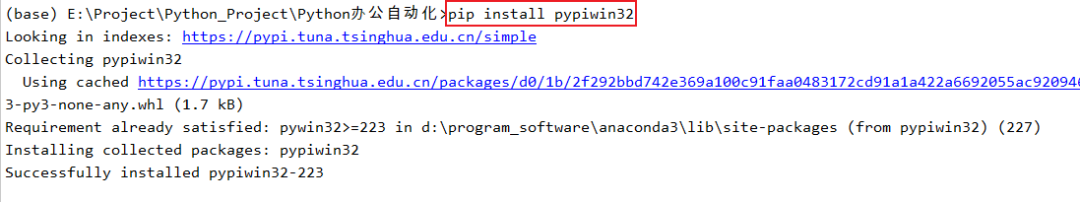
7.1 pip installation win32com
pip install pypiwin32
Since I have already installed it, the prompt is already installed:
7.2 Python uses win32com to read and write Excel
Program example:
import win32com
from win32com.client import Dispatch, constants
import os
#Get the current script path
def getScriptPath():
nowpath = os.path.split(os.path.realpath(__file__))[0]
print(nowpath)
return nowpath
#3.7.2 Python uses win32com to read and write Excel
def fun3_7_2():
app = win32com.client.Dispatch('Excel.Application')
#Run in the background, do not show, do not warn
app.Visible = 0
app.DisplayAlerts = 0
#Create a new Excel
# WorkBook = app.Workbooks.Add()
#New sheet
# sheet = WorkBook.Worksheets.Add()
#Open the existing table, note that absolute paths are used here
WorkBook = app.Workbooks.Open(getScriptPath() + "\\3_7 win32com Modify operation exercises.xlsx")
sheet = WorkBook.Worksheets('Sheet1')
#Get cell information Row n Column n n n n, do not use -1
cell01_value = sheet.Cells(1,2).Value
print("cell01 The content is:",cell01_value)
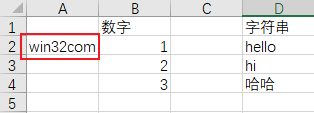
#Write table information
sheet.Cells(2, 1).Value = "win32com"
#Save Form
#WorkBook.Save()
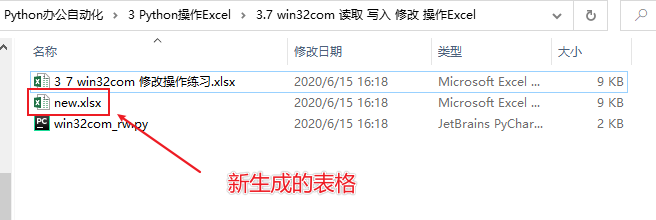
#Save as Implementation Copy
WorkBook.SaveAs(getScriptPath() + "\\new.xlsx")
#Close the table
WorkBook.Close()
app.Quit()
if __name__ == '__main__':
fun3_7_2()
The results are as follows:
The content is:
8 Python pandas read write operation Excel
Introduction:
pandas is a tool based on NumPy that was created to address data analysis tasks. pandas incorporates a number of libraries and standard data models, providing the tools needed to efficiently operate large datasets. pandas provides a number of functions and methods that enable us to process data quickly and easily. You will soon find that it is one of the key factors that makes Python a powerful and efficient data analysis environment.
Official website: https://pandas.pydata.org/
Chinese website: https://www.pypandas.cn/
Official documents: https://pandas.pydata.org/pandas-docs/stable/

8.1 pip installation pandas
pip install pandas
8.2 pandas Read Write Excel
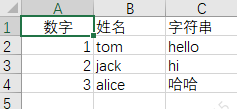
The table is as follows:
Program example:
import pandas as pd
from pandas import DataFrame
#3.8.2 pandas Read Write Excel
def fun3_8_2():
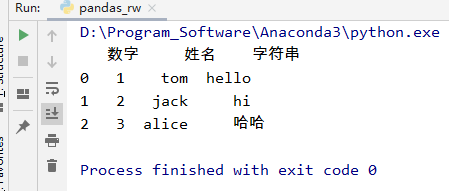
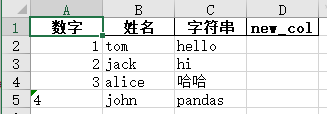
data = pd.read_excel('3_8 pandas Modify operation exercises.xlsx', sheet_name='Sheet1')
print(data)
#Add row data, add in line 5
data.loc[4] = ['4', 'john', 'pandas']
#Increase column data, given default value None
data['new_col'] = None
#Save data
DataFrame(data).to_excel('new.xlsx', sheet_name='Sheet1', index=False, header=True)
if __name__ == '__main__':
fun3_8_2()
The results are as follows:
The excel generated is as follows:
pandas are very powerful. Here are just a few simple examples. There are many other things you can do to learn from official documents or Quick Starts.