catalogue
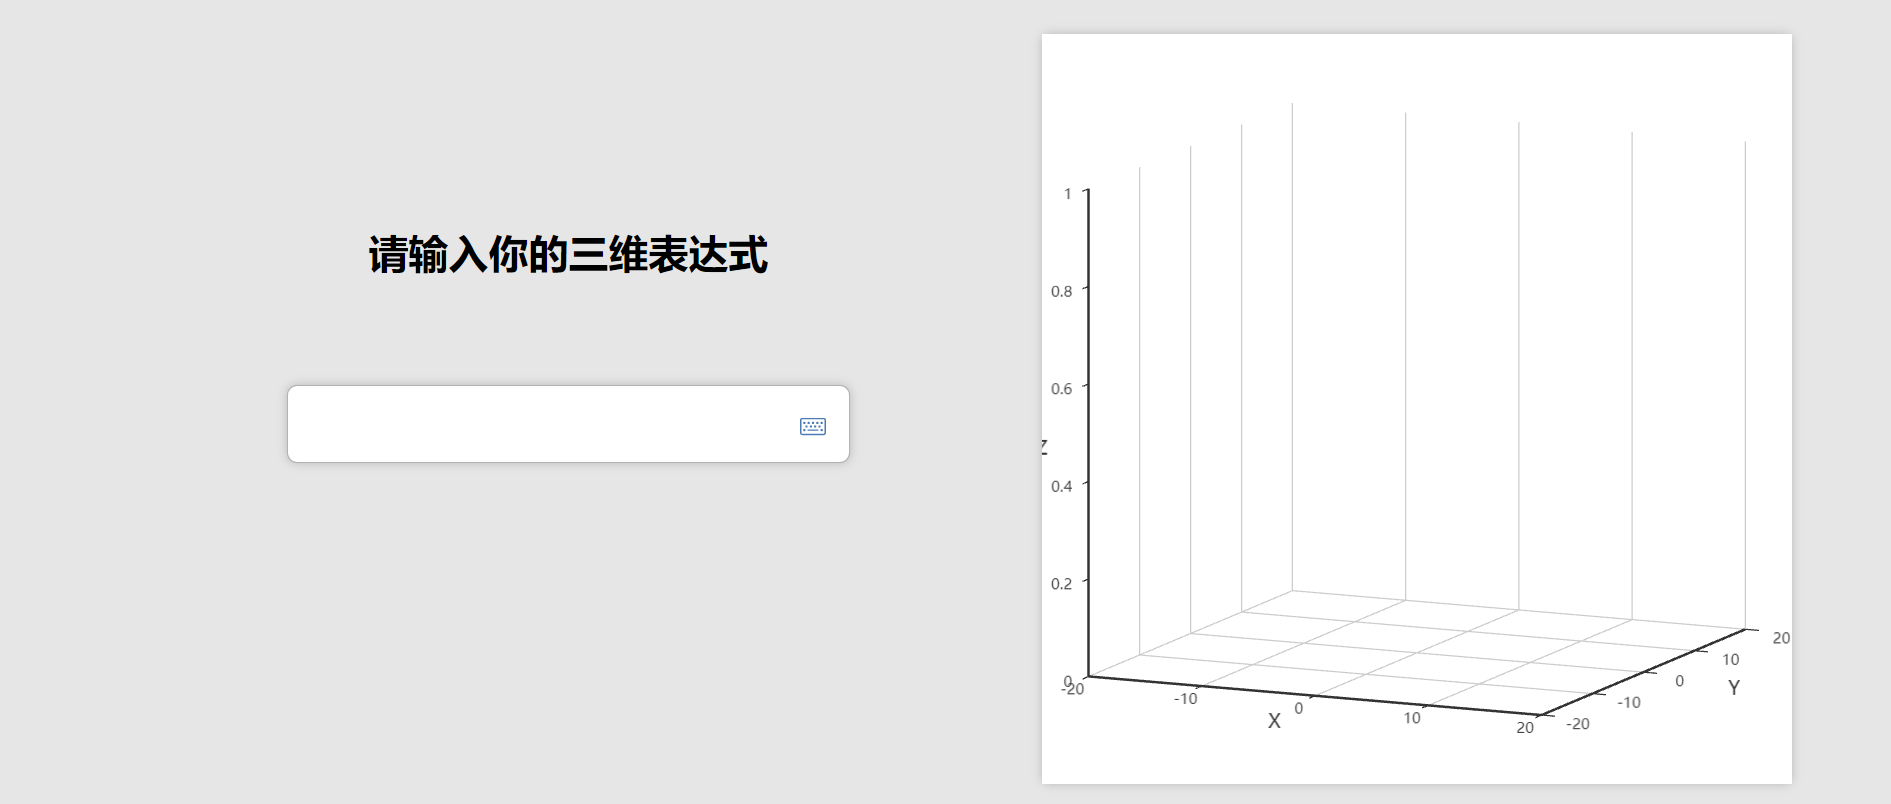
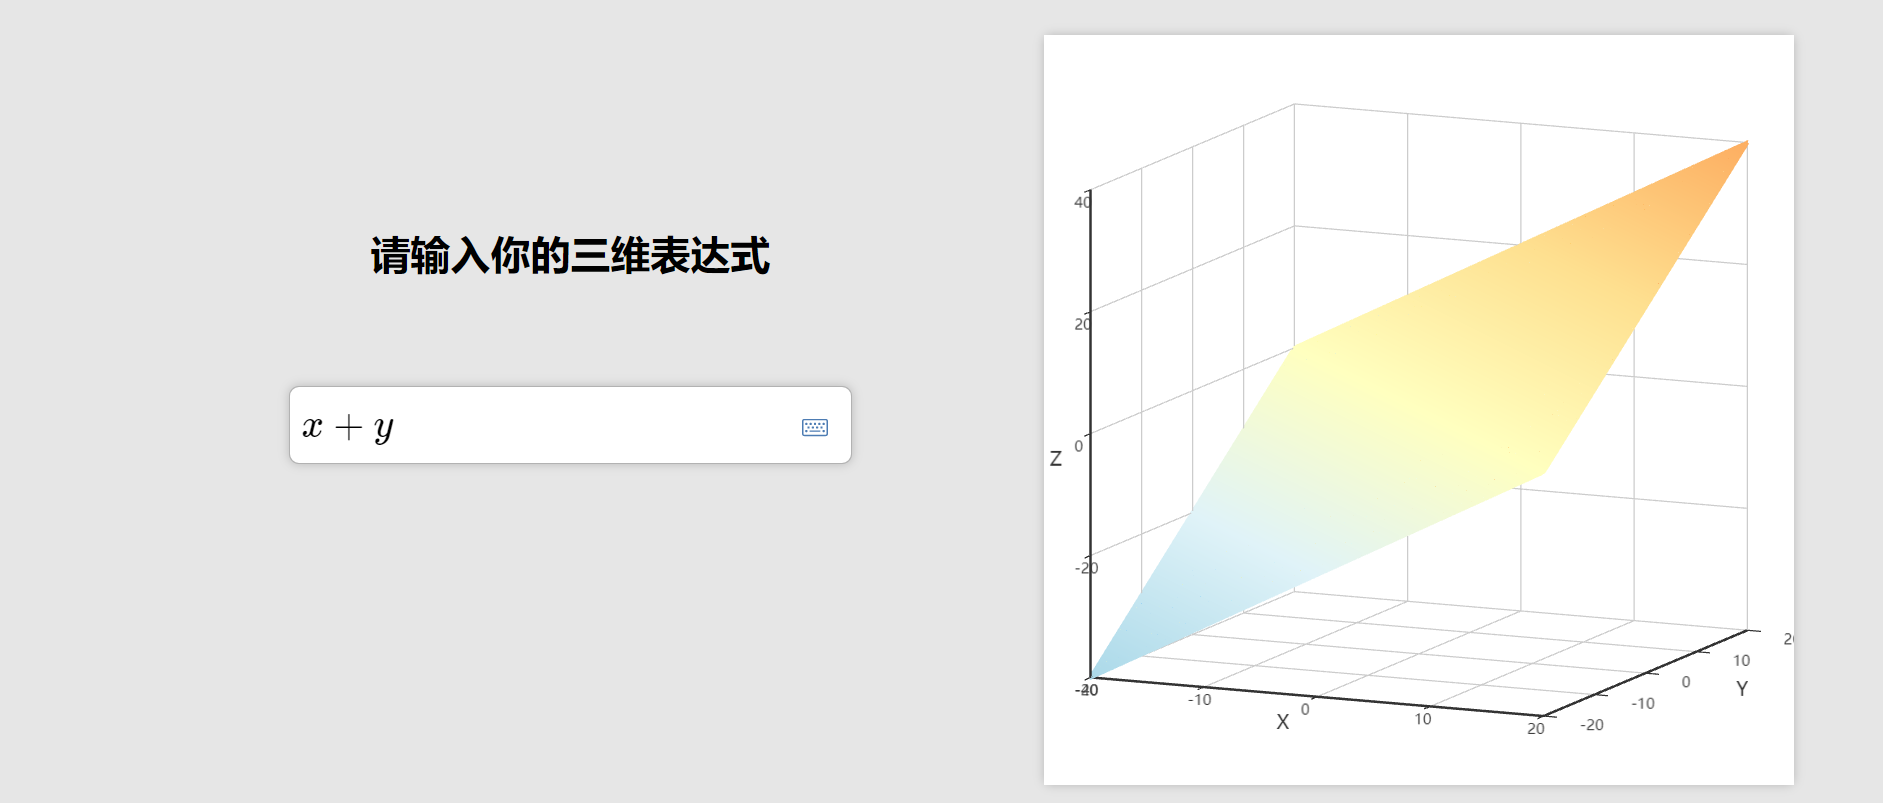
First of all, I searched the Internet for a long time, but I didn't find the information of Eckart's three-dimensional drawing, and took many detours. Therefore, after solving the problem, I recorded the difficulties and solutions here. This pure front-end implementation method is extremely not recommended, because a large number of calculations will lead to the direct collapse or error of the browser page, Here, we only show the effect of z=x+y, which minimizes the amount of calculation and results.
The author's intention of using mathlive is to calculate the complex mathematical expression and then visualize it with eckarts. However, due to the difference between the mathematical expression of js and the back-end language, we can't carry out complex calculation simply from the front-end (or there may be other methods that the author didn't think of temporarily), so this method can only be used with the back-end, The blog only provides ideas and records.
1. Quote mathlive
First of all, I encountered a problem here. According to the official npm installation method, I tried many times, and neither the method of changing the reference path nor the method of changing the configuration can be solved. So I went online to consult the information, but the problem can not be solved in my page. So she you and I studied for more than an hour and finally solved the problem. I quote here
import Vue from 'vue/dist/vue.min'
import * as MathLive from "../public/js/mathlive.min";

Vue.use(MathfiledComponent, MathLive);
Note that Vue references here must use this reference method to avoid errors, but such references lead to a problem, that is, the chrome Vue devtool I installed directly strikes, and the author has not found a solution
But it's not over yet! Friends who have installed routing should pay attention! After I did this, I found that the direct rendering of the page failed, so I opened a new project to try to find that there was no error. After I thought hard, I found that the author was in the index of routing JS page also references Vue, but the reference method of the above code is not changed, resulting in rendering failure! When quoting like this, friends must pay attention to the consistency of other Vue references!!!
2. Quote echarts
Here, the code is directly referenced according to the official document npm installation
import echarts from 'echarts'

Vue.prototype.$echarts = echarts
Here I encountered another problem. I found that installing seals alone can not draw three-dimensional pictures. The controller will report the error "angular seals component series" line3D not exists. Load it first. The author has never used ecarts 3D mapping before, so he is a little confused. According to the information, we also need to install ecarts GL to support 3D mapping. So the author again foolishly reported an error (name conflict, refused to download) according to the official document NPM install echarts GL. Here I went to check the data and got the following installation methods:
npm i echarts-gl@1.1.0 -S
Re reference
import 'echarts-gl'
As a result, the controller of the page reported an error s.getLabelsCoords is not a function
After consulting the materials, we know that we need to update the version of echarts GL to avoid
(thank you for your help from github.)
So we input directly from the terminal
npm i echarts-gl@1.1.1 -S
Finally solve the problem!
3.methods
<script>
export default {
  methods: {
    e() {
      this.drawLine();
    },
    //Convert the expression into points and store them in the array. Too many points here will cause the browser to crash directly or report an error
    generateData() {
      let data = [];
      let x,y
      for (let i = -200; i <= 200; i += 1) {
        for (let j = -200; j <= 200; j += 1) {
          x= i/10
          y= j/10
          let z = eval(this.formula);
          data.push([x,y,z])
        }
      }
      return data;
    },
    drawLine() {
      // Initialize the ecarts instance based on the prepared dom
      let myChart = this.$echarts.init(document.getElementById("myChart"));
      // Draw a chart
      myChart.setOption({
        tooltip: {},
        backgroundColor: "#fff",
        visualMap: {
          show: false,
          dimension: 2,
          min: 100,
          max: -100,
          inRange: {
            color: [
              "#313695",
              "#4575b4",
              "#74add1",
              "#abd9e9",
              "#e0f3f8",
              "#ffffbf",
              "#fee090",
              "#fdae61",
              "#f46d43",
              "#d73027",
              "#a50026",
            ],
          },
        },
        xAxis3D: {
          type: "value",
        },
        yAxis3D: {
          type: "value",
        },
        zAxis3D: {
          type: "value",
        },
        grid3D: {
          viewControl: {
            projection: "orthographic",
          },
        },
        series: [
          {
            type: "line3D",
            data: this.generateData(),
            lineStyle: {
              width: 4,
            },
          },
        ],
      });
    },
    //mathlive related methods
    sayIt: function (event) {
      this.$refs.mathfield.perform(["speak", "all"]);
    },
    setIt: function (event) {
      this.formula = "x=-b\\pm \\frac {\\sqrt{b^2-4ac}}{2a}";
    },
    displayKeystroke: function (keystroke, _ev) {
      this.keystroke = keystroke;
      return true;
    },
    asSpokenText: function () {
      return this.$refs.mathfield
        ? this.$refs.mathfield.getValue("spoken")
        : "";
    },
  },
};
</script>
4. Code display
<template>
  <div class="Paint3D-container">
    <div class="Paint3D-left">
      <h1>Please enter your 3D expression</h1>
      <mathlive-mathfield
        id="mf"
        ref="mathfiled"
        :options="{
          smartFence: false,
          virtualKeyboardMode: 'manual',
          virtualKeyboards: 'numeric symbols',
        }"
        :on-keystroke="displayKeystroke"
        @blur="e"
        v-model="formula"
        style="
          font-size: 32px;
          margin: 2em;
          padding: 8px;
          border-radius: 8px;
          border: 1px solid rgba(0, 0, 0, 0.3);
          box-shadow: 0 0 8px rgba(0, 0, 0, 0.2);
          width: 100%;
          background: #fff;
        "
      >
      </mathlive-mathfield>
    </div>

    <div id="myChart" :style="{ width: '600px', height: '600px' }"></div>
  </div>
</template>
<script>
export default {
  name: "Paint3D",
  data() {
    return {
      //expression
      formula: "",
      keystroke: "",
    };
  },
  mounted() {
    this.drawLine();
  },
  methods: {
    e() {
      this.drawLine();
    },
    //Convert the expression into points and store them in the array. Too many points here will cause the browser to crash directly or report an error
    generateData() {
      let data = [];
      let x,y
      for (let i = -200; i <= 200; i += 1) {
        for (let j = -200; j <= 200; j += 1) {
          x= i/10
          y= j/10
          let z = eval(this.formula);
          data.push([x,y,z])
        }
      }
      return data;
    },
    drawLine() {
      // Initialize the ecarts instance based on the prepared dom
      let myChart = this.$echarts.init(document.getElementById("myChart"));
      // Draw a chart
      myChart.setOption({
        tooltip: {},
        backgroundColor: "#fff",
        visualMap: {
          show: false,
          dimension: 2,
          min: 100,
          max: -100,
          inRange: {
            color: [
              "#313695",
              "#4575b4",
              "#74add1",
              "#abd9e9",
              "#e0f3f8",
              "#ffffbf",
              "#fee090",
              "#fdae61",
              "#f46d43",
              "#d73027",
              "#a50026",
            ],
          },
        },
        xAxis3D: {
          type: "value",
        },
        yAxis3D: {
          type: "value",
        },
        zAxis3D: {
          type: "value",
        },
        grid3D: {
          viewControl: {
            projection: "orthographic",
          },
        },
        series: [
          {
            type: "line3D",
            data: this.generateData(),
            lineStyle: {
              width: 4,
            },
          },
        ],
      });
    },
    //mathlive related methods
    sayIt: function (event) {
      this.$refs.mathfield.perform(["speak", "all"]);
    },
    setIt: function (event) {
      this.formula = "x=-b\\pm \\frac {\\sqrt{b^2-4ac}}{2a}";
    },
    displayKeystroke: function (keystroke, _ev) {
      this.keystroke = keystroke;
      return true;
    },
    asSpokenText: function () {
      return this.$refs.mathfield
        ? this.$refs.mathfield.getValue("spoken")
        : "";
    },
  },
};
</script>
<style lang='less' scoped>
math-field:focus-within {
  outline: 1px solid rgba(64, 158, 255);
  border-radius: 8px;
}
.Paint3D-container {
  background: #e6e6e6;
  .Paint3D-left {
    display: flex;
    flex-direction: column;
    align-items: center;
    width: 60vh;
  }
  display: flex;
  flex-direction: row;
  align-items: center;
  justify-content: space-around;
  height: 100vh;
  #myChart {
    margin: 60px 0px 0px 0px;
    border-radius: 5px;
    background: #fff;
    box-shadow: 0 0 8px rgba(0, 0, 0, 0.2);
  }
}
</style>
5. Attention
The author's intention of using mathlive is to calculate complex mathematical expressions and then visualize them with eckarts. However, due to the difference between js mathematical expressions and back-end languages, we can't perform complex calculations simply from the front-end (or there may be other methods that the author didn't think of temporarily), so this method can only be used in conjunction with the back-end, The blog only provides ideas, records and reflections.