In the last blog post, I explained how to introduce Prometheus to ASP Net core project, because it is a Demo, Prometheus and Grafana are both windows versions, which are executed locally. In the production environment, these services can be put into a suitable environment according to the company's architecture. Now these services support cross platform and container. The basic information template of http request is shown in the previous blog. This blog introduces the user-defined promethesr indicator type.
Prometheus has four indicator types: Counter, Gauge, Histogram and Summary. If the indicators of the business are collected and displayed, it is intrusive programming in the project. If the project uses Prometheus Net through the static method metrics CreateCounter(),Metrics. CreateGauge(),Metrics. CreateSummary(),Metrics. Createhistogram() to create a static indicator collector to complete the collection of business indicators.
Let's look at the specific Demo first.
1. Counter: counter, only increasing but not decreasing
First set up a business scenario: for example, to build a mall, there are four API s: user registration (/ register), order placement (/ order), payment (/ pay), and shipment (/ ship). The codes are as follows:
using Microsoft.AspNetCore.Mvc;
using Microsoft.Extensions.Logging;
using PrometheusSample.Models;
using PrometheusSample.Services;
using System;
using System.Threading.Tasks;

namespace PrometheusSample.Controllers
{
    [ApiController]
    [Route("[controller]")]
    public class BusinessController : ControllerBase
    {
        private readonly ILogger<BusinessController> _logger;
        private readonly IOrderService _orderService;

        public BusinessController(ILogger<BusinessController> logger, IOrderService orderService)
        {
            _orderService = orderService;
            _logger = logger;
        }
        /// <summary>
        /// register
        /// </summary>
        /// <param name="username">user name</param>
        /// <returns></returns>
        [HttpPost("/register")]
        public async Task<IActionResult> RegisterUser([FromBody] User user)
        {
            try
            {
                _logger.LogInformation("User registration");
                var result = await _orderService.Register(user.UserName);
                if (result)
                {
                    return new JsonResult(new { Result = true });
                }
                else
                {
                    return new JsonResult(new { Result = false });
                }
            }
            catch (Exception exc)
            {
                _logger.LogCritical(exc, exc.Message);
                return new JsonResult(new { Result = false, Message = exc.Message });
            }
        }

        [HttpGet("/order")]
        public IActionResult Order(string orderno)
        {
            try
            {
                _logger.LogInformation("place an order");
                return new JsonResult(new { Result = true });
            }
            catch (Exception exc)
            {
                _logger.LogCritical(exc, exc.Message);
                return new JsonResult(new
                {
                    Result = false,
                    Message = exc.Message
                });
            }
        }
        [HttpGet("/pay")]
        public IActionResult Pay()
        {
            try
            {
                _logger.LogInformation("payment");
                return new JsonResult(new { Result = true });
            }
            catch (Exception exc)
            {
                _logger.LogCritical(exc, exc.Message);
                return new JsonResult(new { Result = false, Message = exc.Message });
            }
        }
        [HttpGet("/ship")]
        public IActionResult Ship()
        {
            try
            {
                _logger.LogInformation("deliver goods");
                return new JsonResult(new { Result = true });
            }
            catch (Exception exc)
            {
                _logger.LogCritical(exc, exc.Message);
                return new JsonResult(new { Result = false, Message = exc.Message });
            }
        }
    }
}
The above is the basic business Controller. In order to reduce dependence, our business indicators are collected in a middleware. The middleware collects the business indicator data according to the requested url and the returned data result data, Of course, you can also introduce intermediary mode components such as action filter or MediatR to isolate the development of business logic and the collection of monitoring data.
In this example, a static indicator collector is defined in the way of middleware:
 public class MetricsHub
    {
        private static Dictionary<string, Counter> _counterDictionary = new Dictionary<string, Counter>();
         public Counter GetCounter(string key)
        {
            if (_counterDictionary.ContainsKey(key))
            {
                return _counterDictionary[key];
            }
            else
            {
                return null;
            }
        }
        public void AddCounter(string key, Counter counter)
        {
            _counterDictionary.Add(key, counter);
        }
    }
Defining middleware BusinessMetricsMiddleware
using Microsoft.AspNetCore.Http;
using PrometheusSample.Models;
using System.IO;
using System.Threading.Tasks;

namespace PrometheusSample.Middlewares
{
    /// <summary>
    /// Request recording Middleware
    /// </summary>
    public class BusinessMetricsMiddleware
    {
        private readonly RequestDelegate _next;
        public BusinessMetricsMiddleware(RequestDelegate next)
        {
            _next = next;
        }

        public async Task InvokeAsync(HttpContext context, MetricsHub metricsHub)
        {
            var originalBody = context.Response.Body;
            try
            {
                using (var memStream = new MemoryStream())
                {
                    //Returned from management Response Take out the return data and count the monitoring indicators according to the return value
                    context.Response.Body = memStream;
                    await _next(context);

                    memStream.Position = 0;
                    string responseBody = new StreamReader(memStream).ReadToEnd();
                    memStream.Position = 0;
                    await memStream.CopyToAsync(originalBody);
                    if (metricsHub.GetCounter(context.Request.Path) != null || metricsHub.GetGauge(context.Request.Path) != null)
                    {
                        //All agreed here action The return value is a APIResult type
                        var result = System.Text.Json.JsonSerializer.Deserialize<APIResult>(responseBody, new System.Text.Json.JsonSerializerOptions { PropertyNameCaseInsensitive = true });
                        if (result != null && result.Result)
                        {
                            //Get Counter
                            var counter = metricsHub.GetCounter(context.Request.Path);
                            if (counter != null)
                            {
                                //count
                                counter.Inc();
                            }
                        }
                    }
                }
            }
            finally
            {
                context.Response.Body = originalBody;
            }
        }
    }
}
In middleware, as long as the Result returned by the action request is true, it will be counted. The prerequisite for this is that there is a unified Convention on the business return value; However, the return of each action cannot be the same. If there is a special case, you can use the action filter or the mediator pattern component to correspond.
Take another look at how the middleware is configured in Starup:
using Microsoft.AspNetCore.Builder;
using Microsoft.AspNetCore.Hosting;
using Microsoft.AspNetCore.Mvc;
using Microsoft.Extensions.Configuration;
using Microsoft.Extensions.DependencyInjection;
using Microsoft.Extensions.Hosting;
using Microsoft.Extensions.Logging;
using Microsoft.OpenApi.Models;
using Prometheus;
using PrometheusSample.Middlewares;
using PrometheusSample.Services;
using System;
using System.Collections.Generic;
using System.Linq;
using System.Threading.Tasks;

namespace PrometheusSample
{
    public class Startup
    {
        public Startup(IConfiguration configuration)
        {
            Configuration = configuration;
        }

        public IConfiguration Configuration { get; }

        public void ConfigureServices(IServiceCollection services)
        {
            MetricsHandle(services);
            services.AddScoped<IOrderService, OrderService>();
            services.AddControllers();
            services.AddSwaggerGen(c =>
            {
                c.SwaggerDoc("v1", new OpenApiInfo { Title = "PrometheusSample", Version = "v1" });
            });
        }

        public void Configure(IApplicationBuilder app, IWebHostEnvironment env)
        {
            if (env.IsDevelopment())
            {
                app.UseDeveloperExceptionPage();
                app.UseSwagger();
                app.UseSwaggerUI(c => c.SwaggerEndpoint("/swagger/v1/swagger.json", "PrometheusSample v1"));
            }

            app.UseRouting();
            //http Requested Middleware
            app.UseHttpMetrics();
            app.UseAuthorization();

            //Custom business tracking
            app.UseBusinessMetrics();

            app.UseEndpoints(endpoints =>
            {
                //The mapping monitoring address is  /metrics
                endpoints.MapMetrics();
                endpoints.MapControllers();
            });
        }
        /// <summary>
        /// Handle monitoring matters
        /// </summary>
        /// <param name="services"></param>
        void MetricsHandle(IServiceCollection services)
        {
            var metricsHub = new MetricsHub();
            //counter
            metricsHub.AddCounter("/register", Metrics.CreateCounter("business_register_user", "Number of registered users."));
            metricsHub.AddCounter("/order", Metrics.CreateCounter("business_order_total", "Total number of orders."));
            metricsHub.AddCounter("/pay", Metrics.CreateCounter("business_pay_total", "Total payments."));
            metricsHub.AddCounter("/ship", Metrics.CreateCounter("business_ship_total", "Total number of shipments."));
            services.AddSingleton(metricsHub);
        }
    }
}
In MetricsHandle, we add four action s and four counters corresponding to each other. In this way, when the four URLs have requests and the result in the return value is true, they will be counted on the corresponding counters.
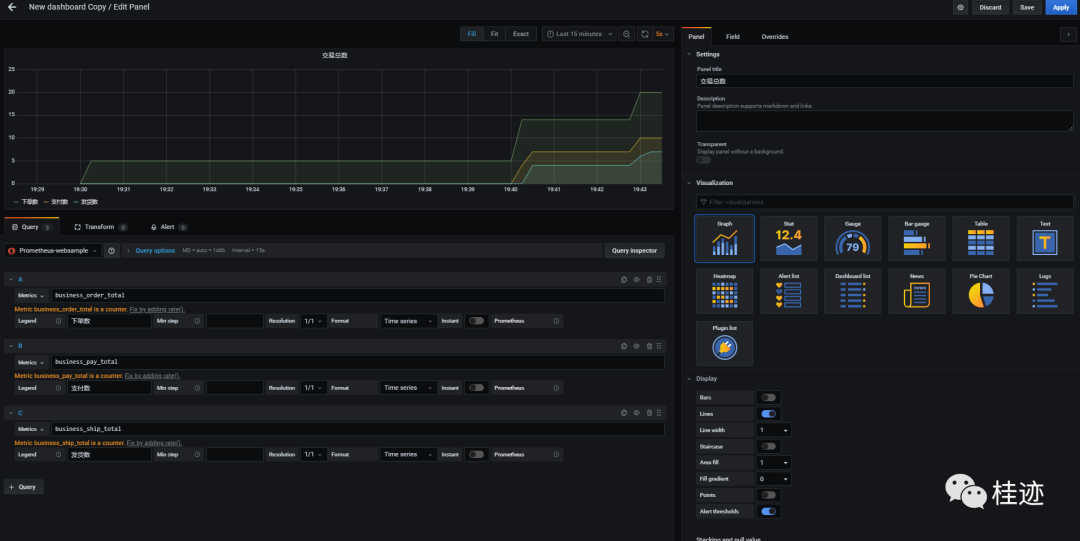
Now that the data is collected, you can configure the displayed chart in Grafana:
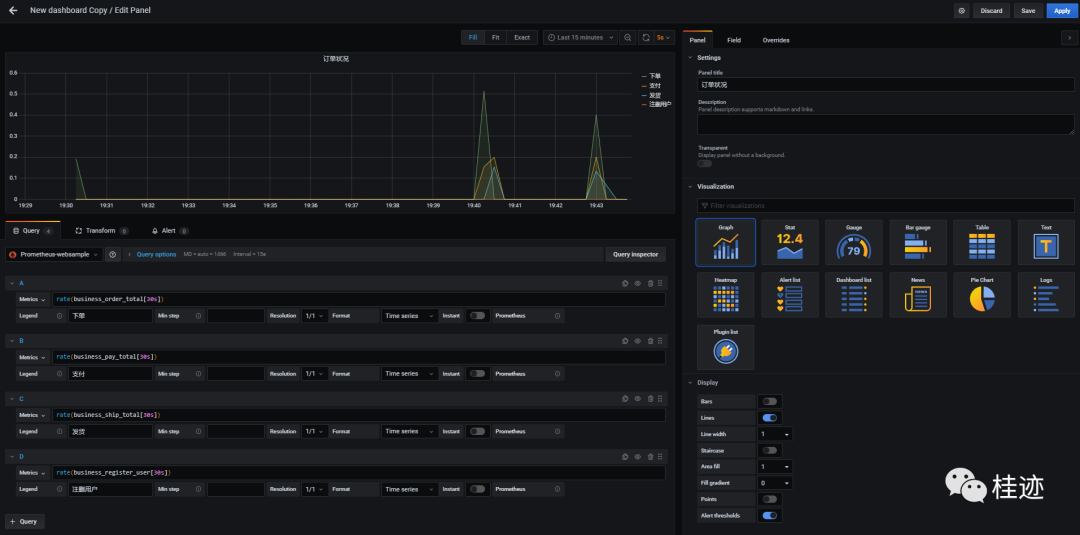
Total number of order statuses configuration:
Quantity tracking broken line within 30 seconds in each order status
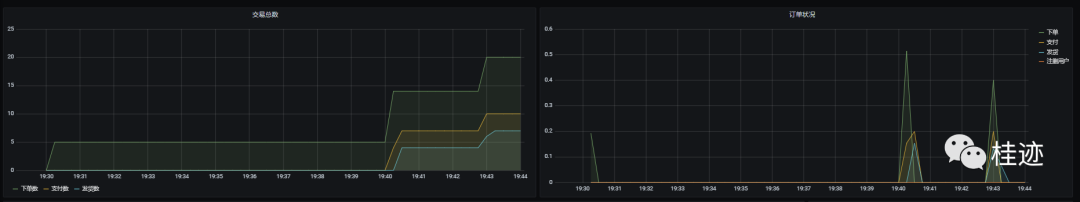
The final running result is:
Summarize the steps to implement custom business counters:
1. Analyze the business and plan the monitoring and tracking indicators
2. Define indicator collector
3. Intrusion programming (try to separate the collection code of business realization and monitoring instructions during development) collection indicators
4. Develop grafana display template and complete the display