filebeat stores the collected logs in the specified es index library and displays the log data on kibana
1. Why should I specify the name of the index library
Since there are more than one application service on a machine, such as web machine, there must be tomcat, nginx and redis services on it. If we do not specify the index name of the logs collected by each application stored in the es cluster, filebeat will store all logs in an index library called filebeat XXX. In this way, We think it will be very difficult to see the log of an application
Therefore, when filebeat collects logs and stores them in es, it is necessary to specify different index names corresponding to different applications. In this way, tomcat's index library in tomcat and nginx's index library in nginx can be realized without mutual interference
2. Detailed explanation of configuration file
filebeat.inputs:							//What logs are collected
- type: log										//Collection type. If there are multiple application systems, configure multiple
  enabled: true									//Whether to enable it. true means enabled and false means disabled. After enabling, the index library will be created on es
  paths:										//Log path
    - /var/log/nginx/access.log
    - /var/log/nginx/error.log
  fields:										//Add an additional field in the es library, which is also similar to the label
    index: nginx								//Field name: value
  json.keys_under_root: true						//Parsing json format logs
  json.overwrite_keys: true

output.elasticsearch:								//Which es cluster is the log stored in
  hosts: ["192.168.81.210:9200"]					//Cluster address
  indices:											//Index information
    - index: "elk-nginx-%{+yyyy.MM.dd}"				//Index name
      when.equals:						//Which label does it match
        fields:							//Configure label type as field
          index: "nginx"					//Configure the specified field. When the value of the index field is nginx, it is stored in the elk nginx index
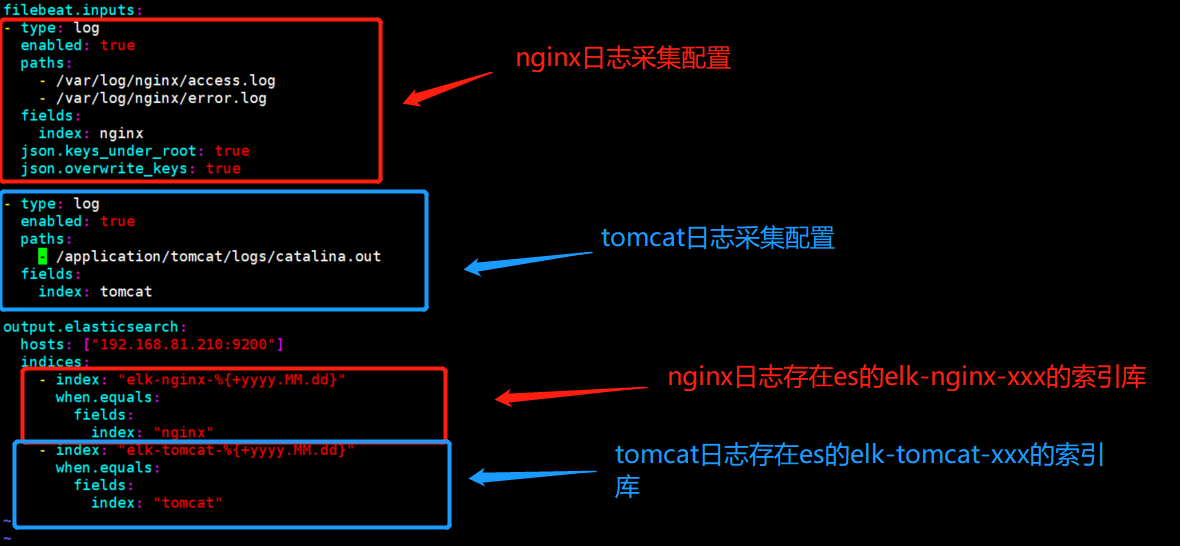
3.filebeat configures multiple application logs to be collected and stored in different index libraries
3.1. Modify profile
[root@logsj ~]# vim /etc/filebeat/filebeat.yml
filebeat.inputs:
- type: log
  enabled: true
  paths:
    - /var/log/nginx/access.log
    - /var/log/nginx/error.log
  fields:
    index: nginx
  json.keys_under_root: true
  json.overwrite_keys: true

- type: log
  enabled: true
  paths:
    - /application/tomcat/logs/catalina.out
  fields:
    index: tomcat

output.elasticsearch:
  hosts: ["192.168.81.210:9200"]
  indices:
    - index: "elk-nginx-%{+yyyy.MM.dd}"
      when.equals:
        fields:
          index: "nginx"
    - index: "elk-tomcat-%{+yyyy.MM.dd}"
      when.equals:
        fields:
          index: "tomcat"
3.2. Restart filebeat
[root@logsj ~]# systemctl restart filebeat
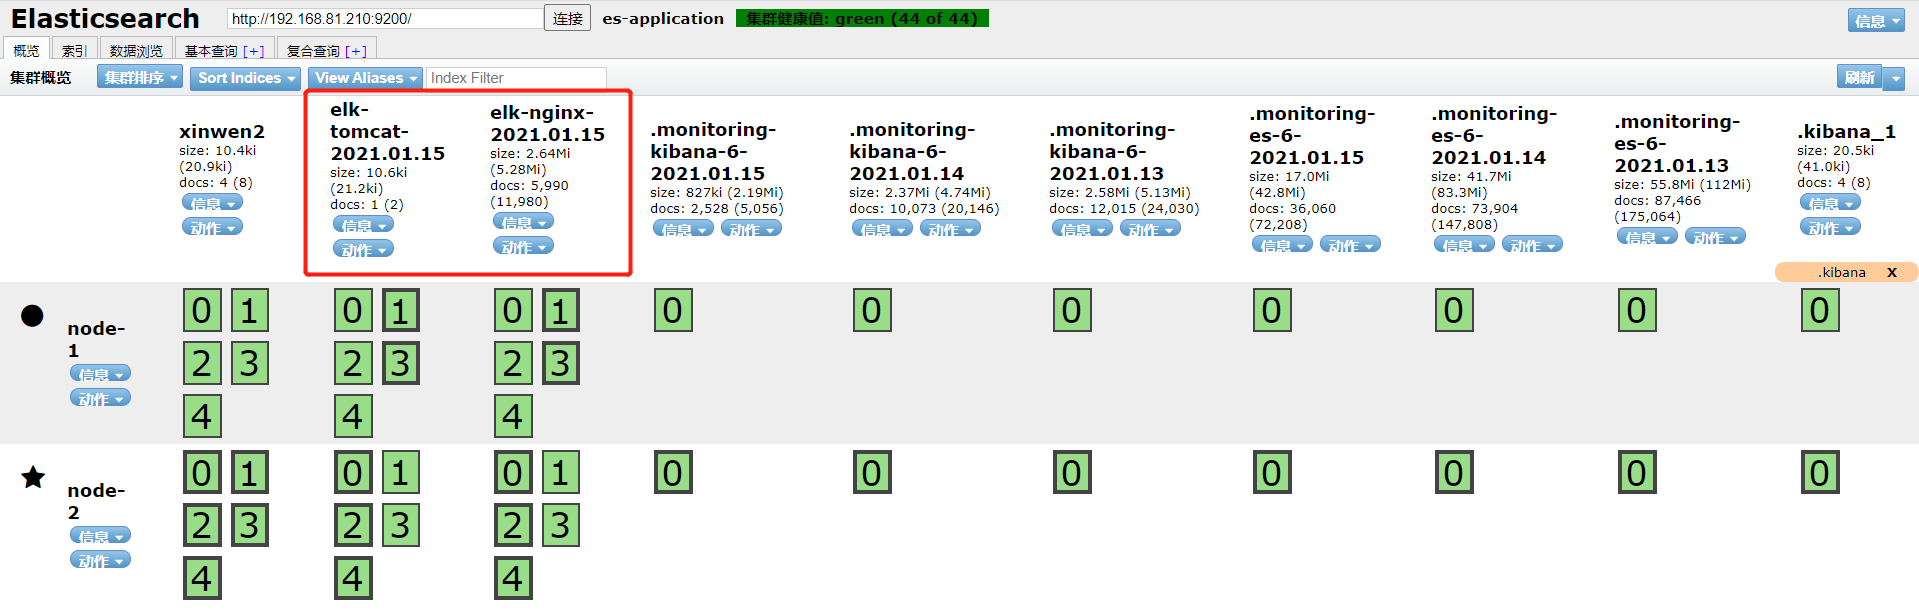
3.3. View index libraries created on es
With the tomcat index and nginx index, we can see that they are not the default three indexes, because we have also modified the default template. As long as we customize the index name, the new template configuration is enabled by default, which becomes the default five slices and one copy of es
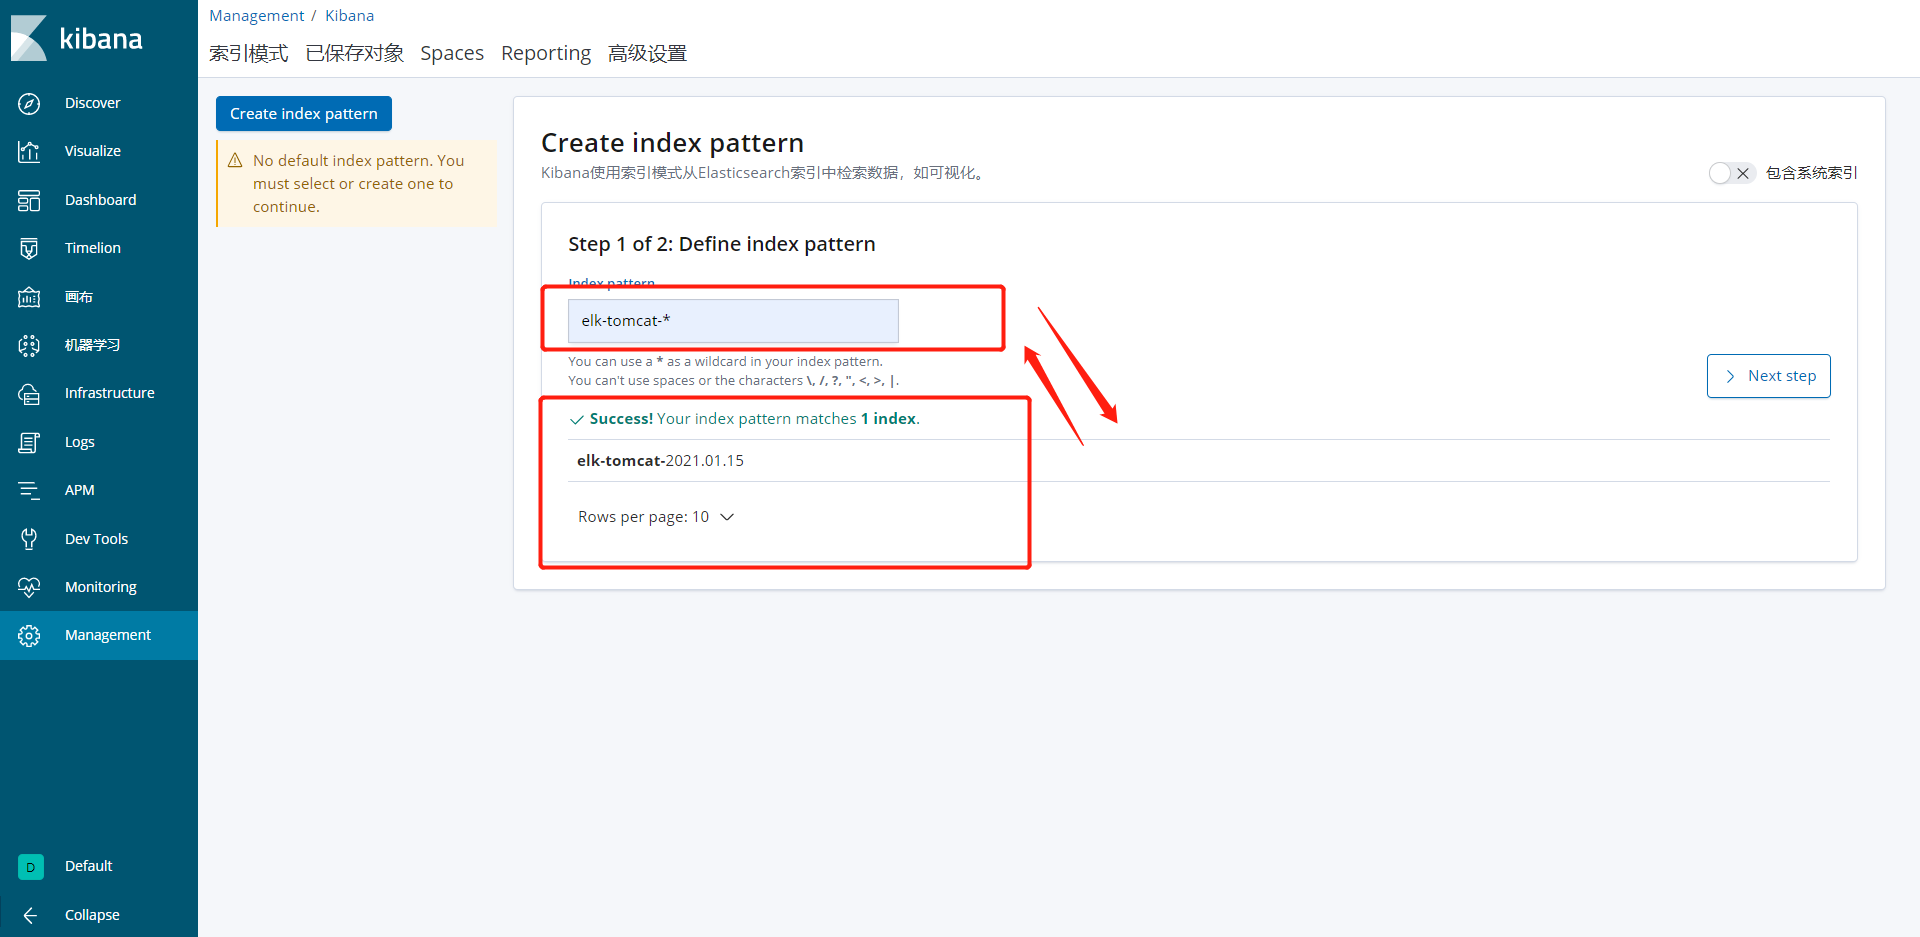
4. Create tomcat and nginx index libraries on kibana
In fact, the index is created on banes
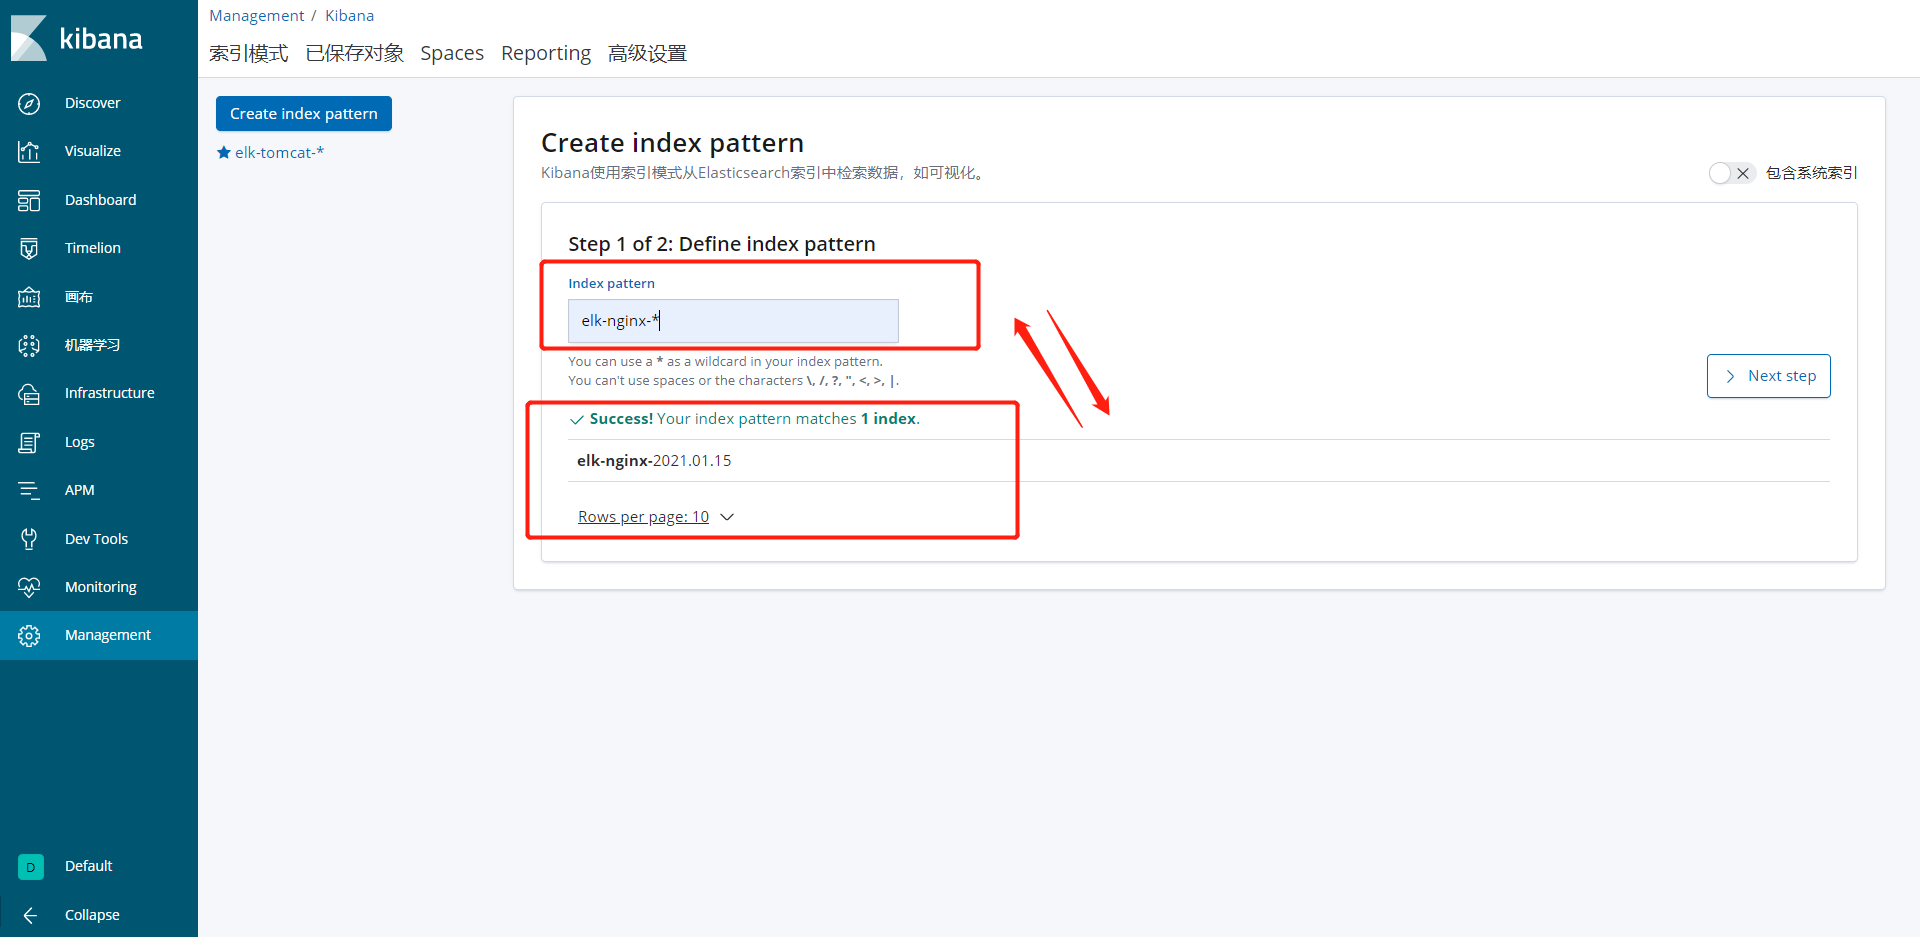
After filling in the name of es index library here, the matching index libraries will be listed automatically, so it is equivalent to calling
When filling in the name, you should write wildcards, such as elk nginx - *, because the logs collected by filebeat every day are stored separately in the unused index library, such as elk-nginx-01 on the first day and elk-nginx-02 on the second day. In this way, if you write the index name, you need to add an index library every day, which is very troublesome, so you need to fill in wildcards, In this way, the daily logs will be merged together, and different dates can be compared and queried
4.1. Create elk Tomcat index library
Click the management kibana column index mode
Fill in elk Tomcat for the name-*
Select @ timestamp in the field
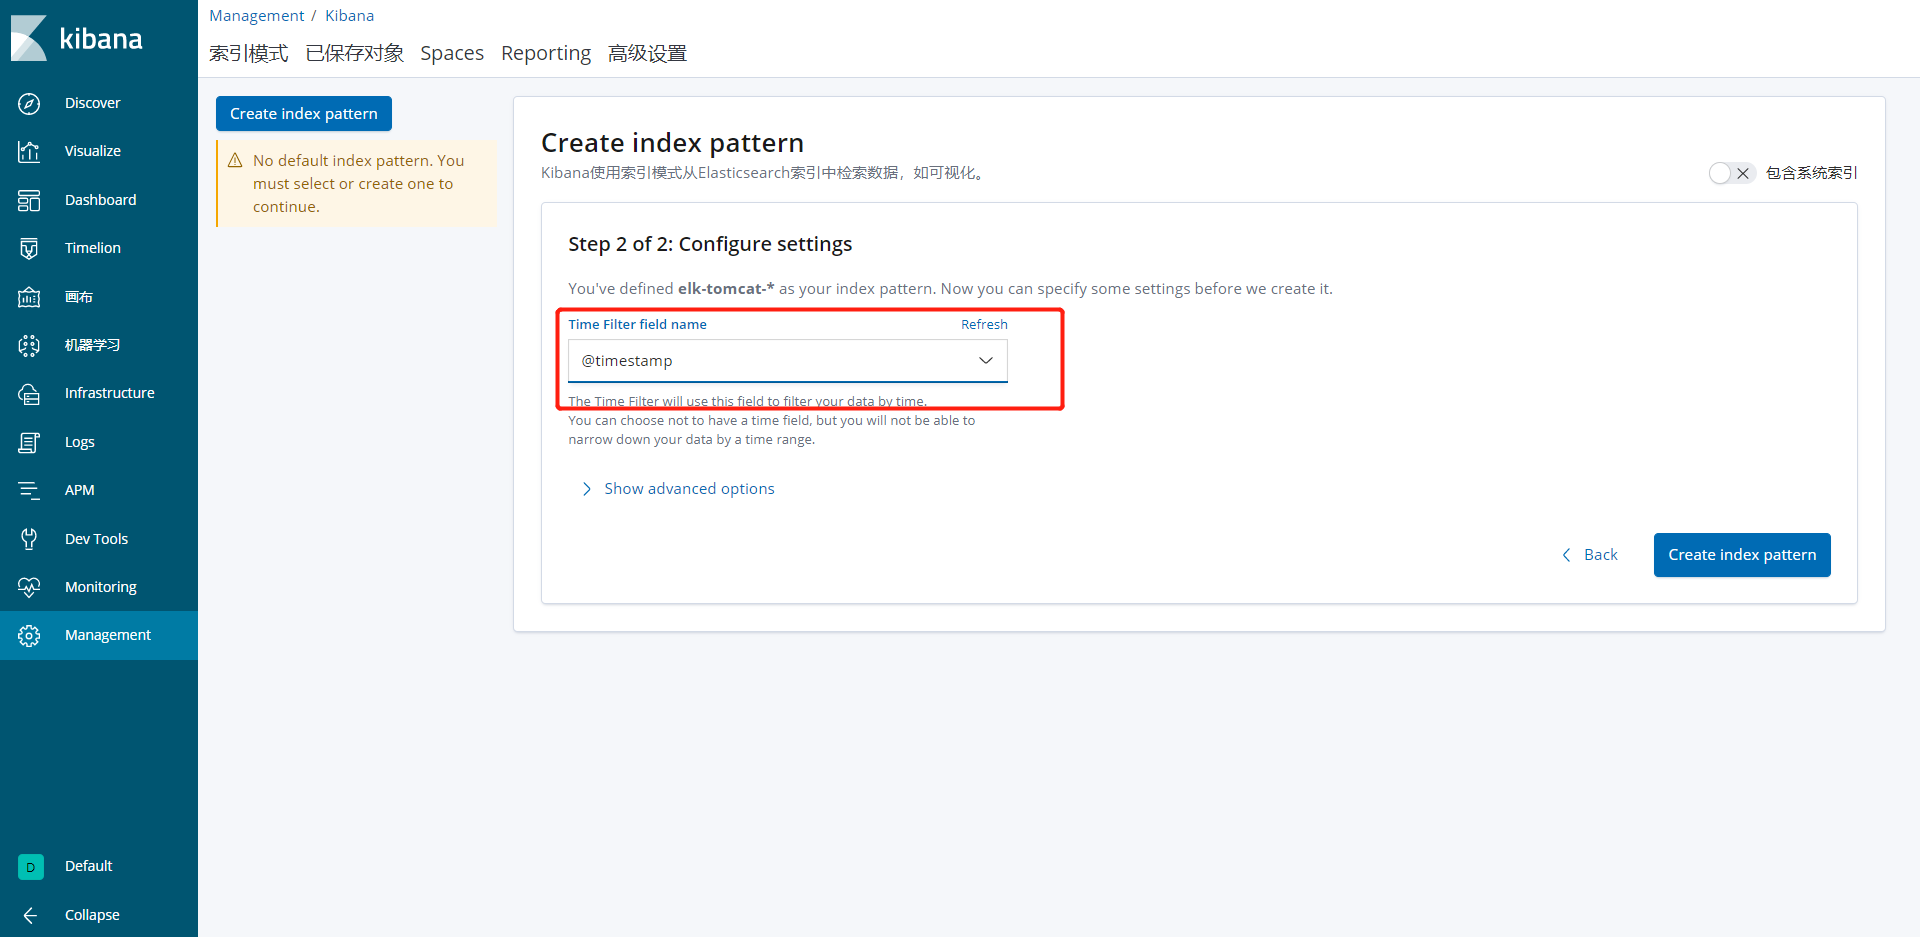
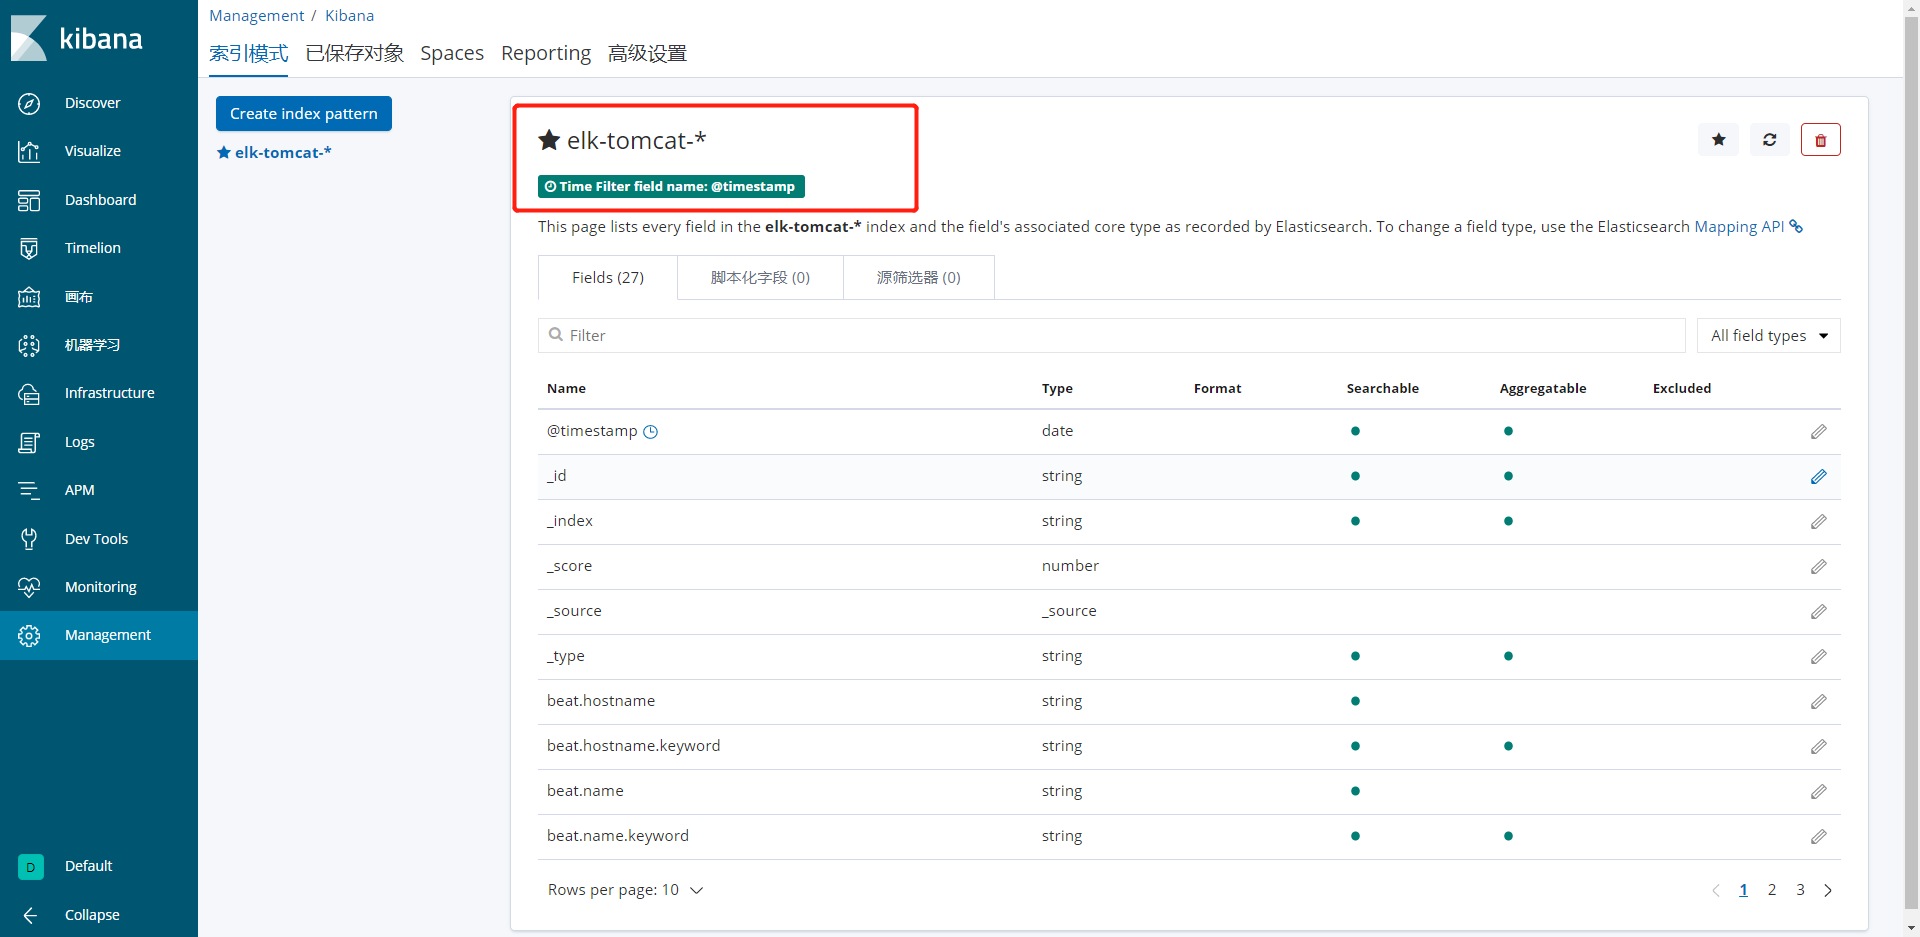
Creation complete
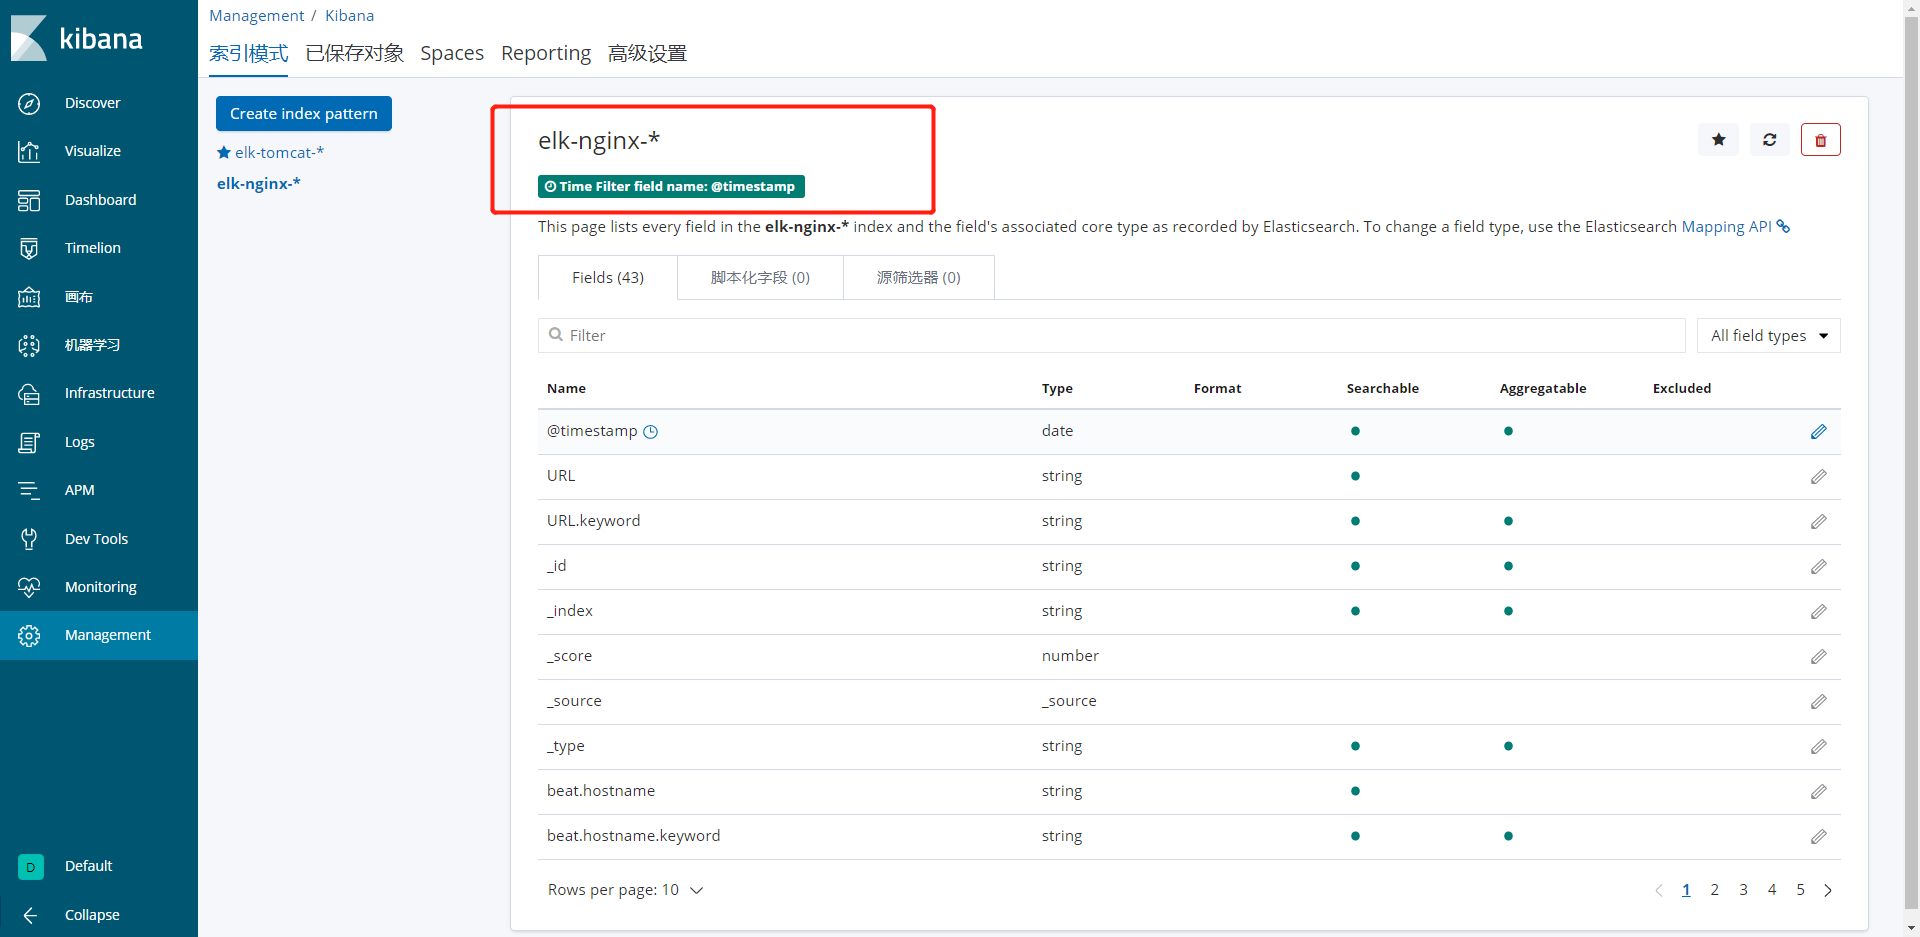
4.2. Create elk nginx index library
Fill in elk nginx for the name-*
Automatically select @ timestamp
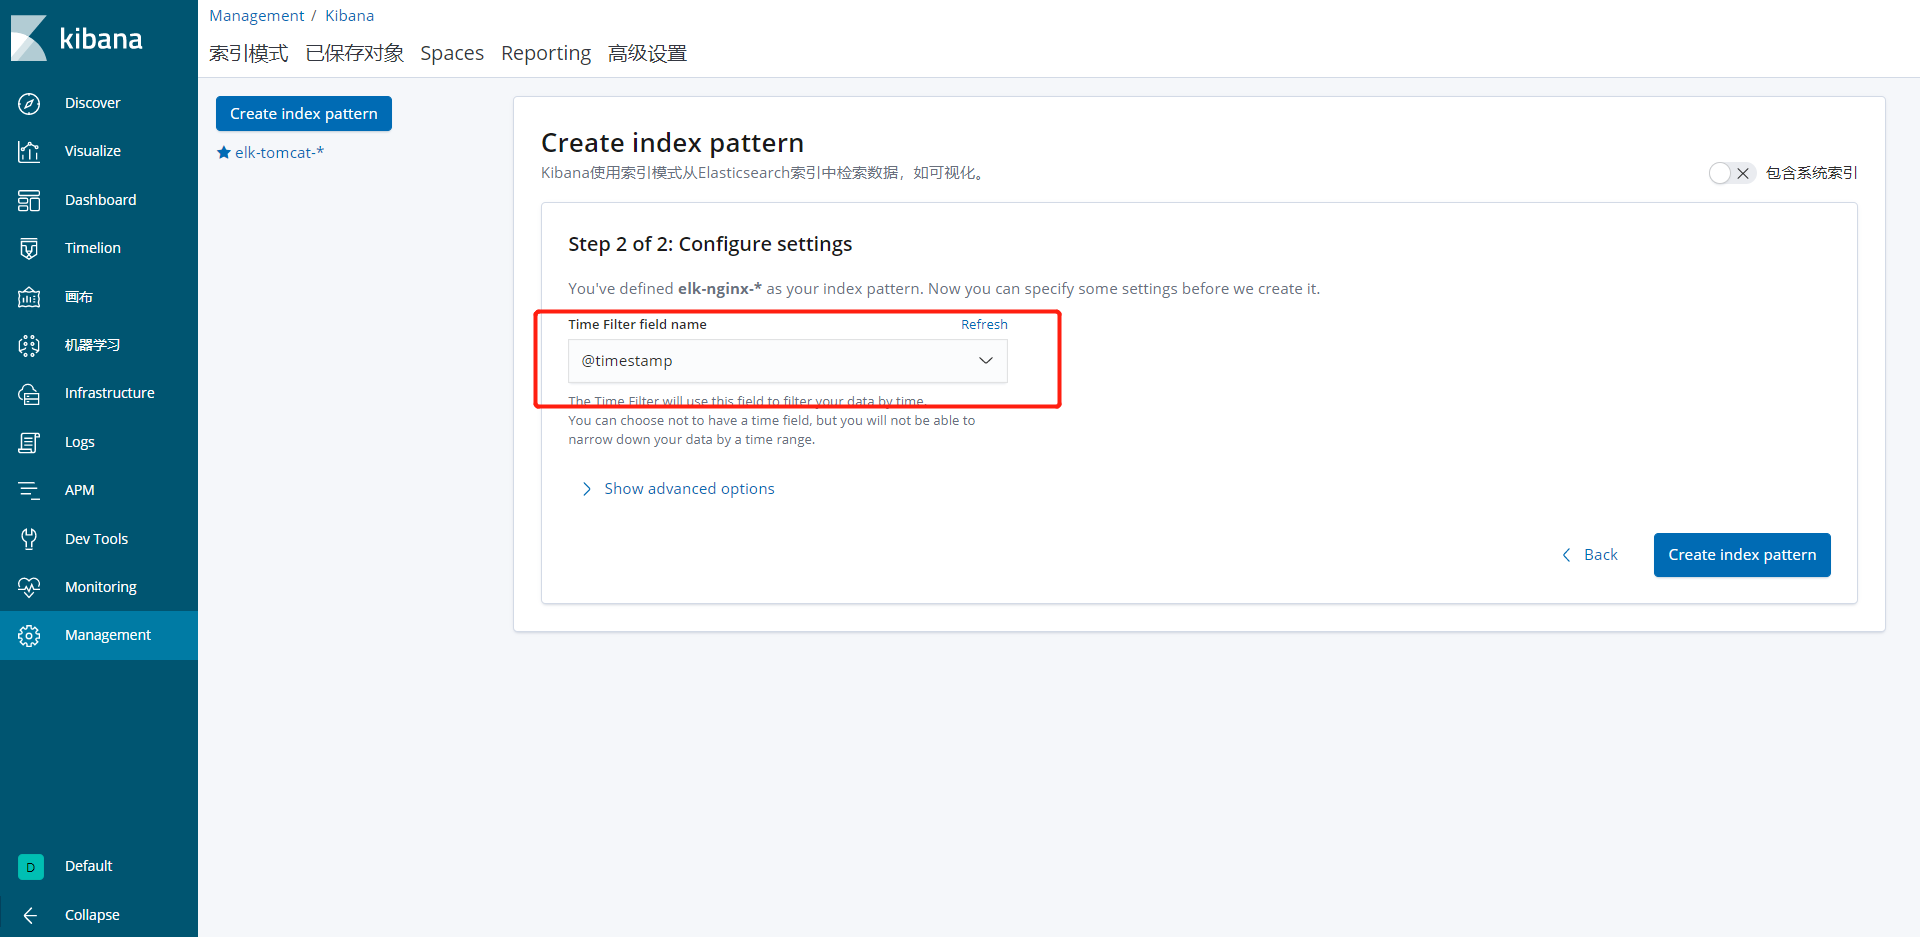
4.3. Creation complete
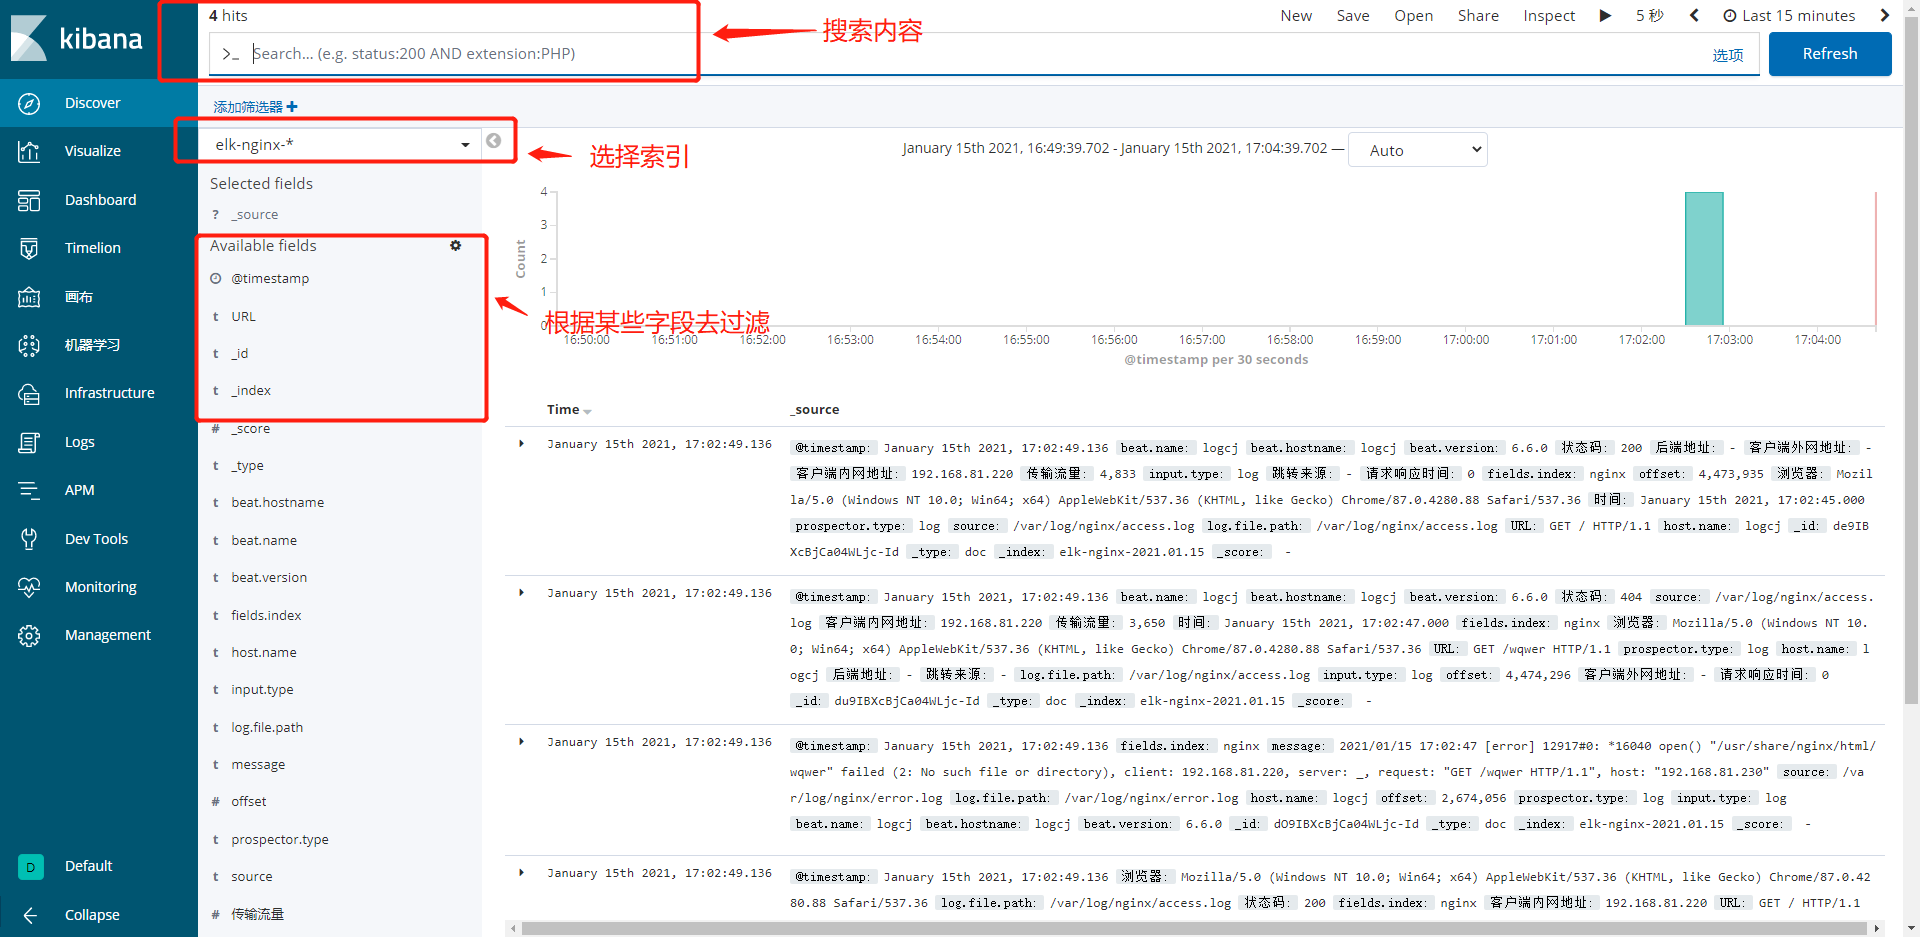
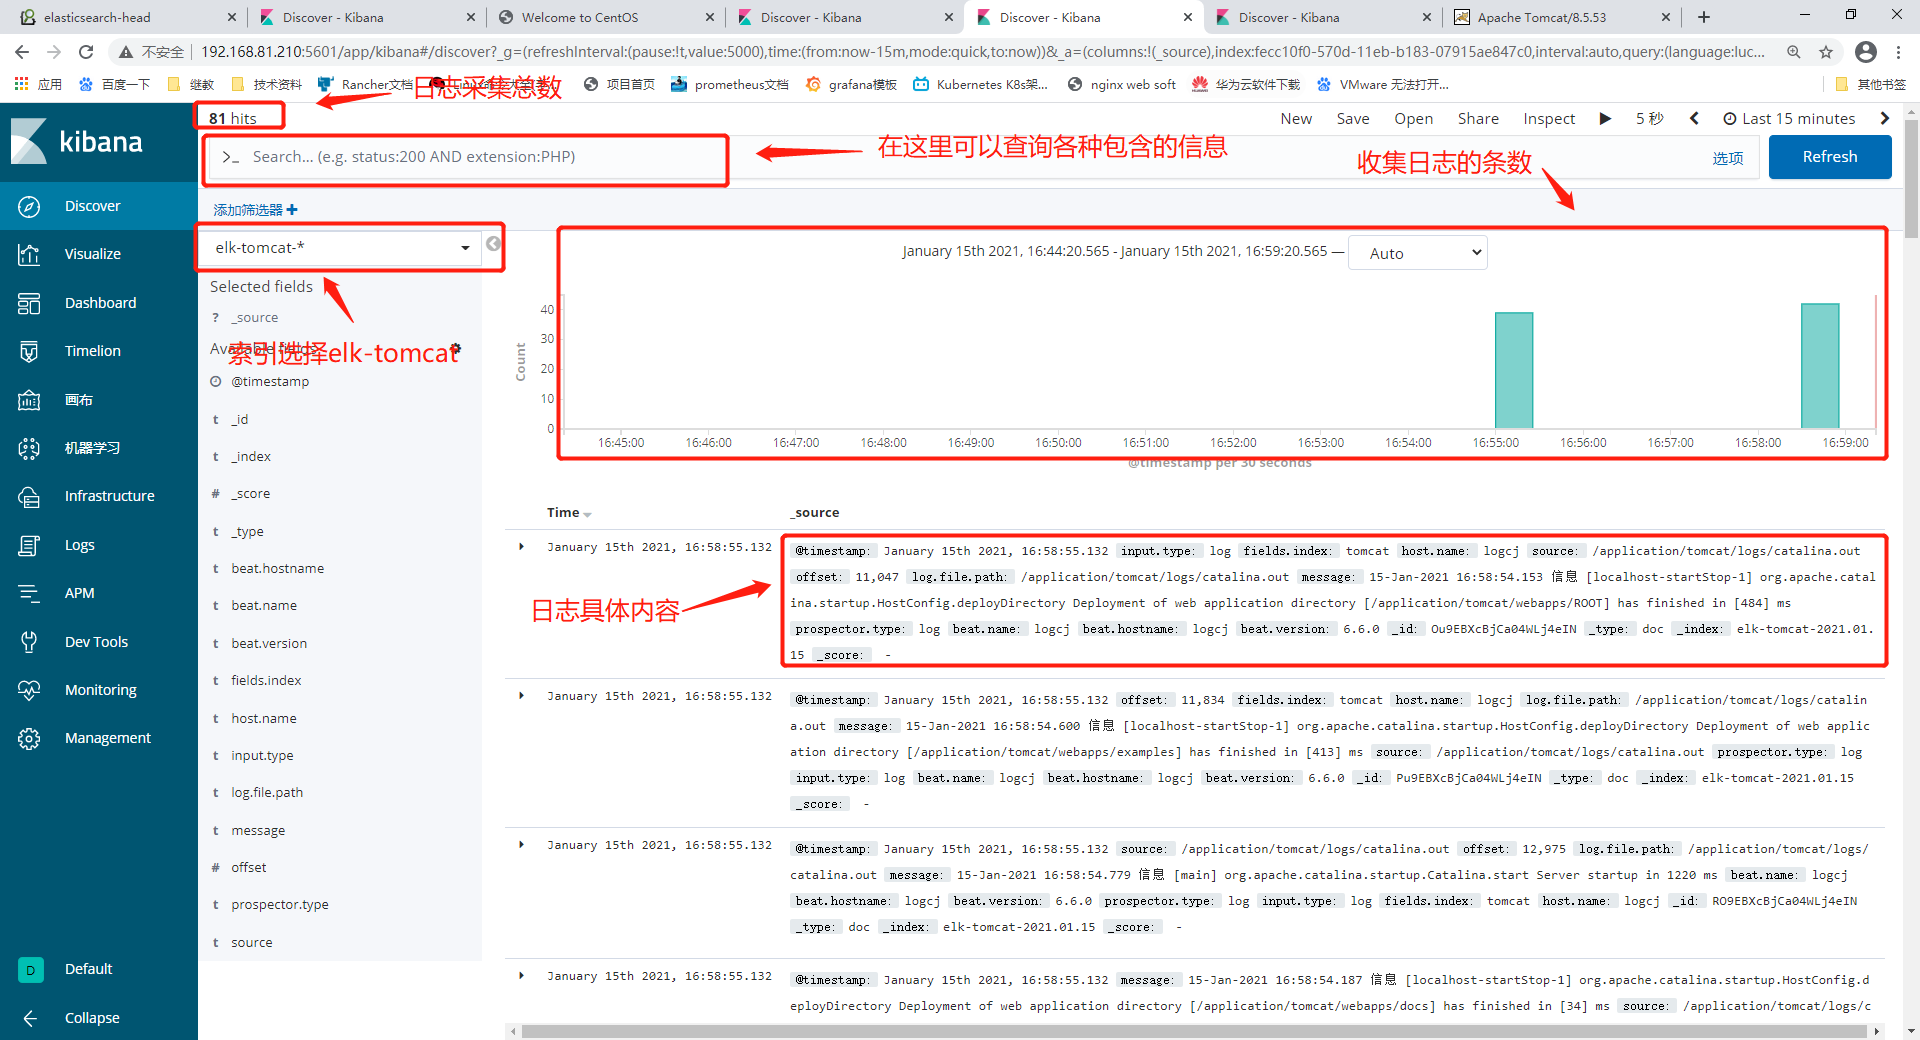
5. Count the logs of different applications on kibana
5.1. Statistics tomcat log
Click Discovery - select the corresponding tomcat index
Fill in the filter for what needs to be counted. If the search content is above >_ Li sou
5.2. Statistics nginx log
nginx opens the json format log, so the statistics are more complete