summary
As we all know, we often encounter many exceptions and error messages in the production environment. We need to check the log information to check the errors. Most of the current systems are complex. Even behind a service, there is a cluster of machines running. It is obviously laborious and unrealistic to check the logs one by one.
If you can collect all the logs on one platform, and then search out the relevant logs through keywords like Baidu and Google, wouldn't it be nice. So there is a centralized log system. ELK is one of the most used open source products.
1, What is ELK
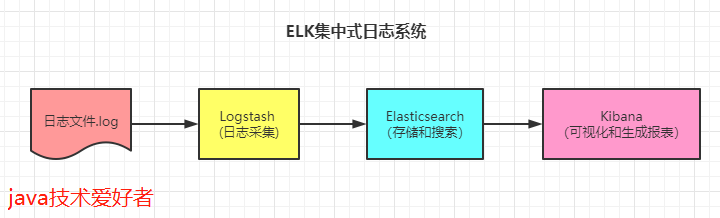
ELK is actually the acronym of Elasticsearch, Logstash and Kibana, all of which are open source products.
Elastic search (ES) is a real-time distributed search and analysis engine, which can be used for full-text search, structured search and analysis.
Logstash is a data collection engine, which is mainly used for data collection, analysis and sending data to ES. Supported data sources include local files, ElasticSearch, MySQL, Kafka, and so on.
Kibana provides Elasticsearch with analysis and Web visualization interfaces, and generates various dimensional tables and graphs.
2, Build ELK
Environment dependency: centos7 5,JDK1.8,ElasticSearch7.9.3,Logstash 7.9.3,Kibana7.9.3.
2.1 installing ElasticSearch
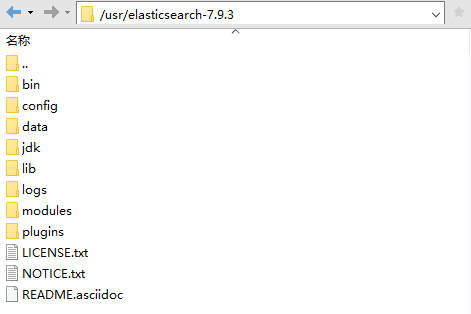
First, download the installation package from the official website, and then use the tar -zxvf command to unzip it.
Find elasticsearch. In the config directory YML file, modify configuration:
cluster.name: es-application
node.name: node-1
#Open to all IP
network.host: 0.0.0.0
#HTTP port number
http.port: 9200
#elasticsearch data file storage directory
path.data: /usr/elasticsearch-7.9.3/data
#elasticsearch log file storage directory
path.logs: /usr/elasticsearch-7.9.3/logs
After configuration, because ElasticSearch starts with a non root user, create a user.
# Create user
useradd yehongzhi
# Set password
passwd yehongzhi
# Give user permission
chown -R yehongzhi:yehongzhi /usr/elasticsearch-7.9.3/
Then switch users and start:
# Switch users
su yehongzhi
# Start - d indicates background start
./bin/elasticsearch -d
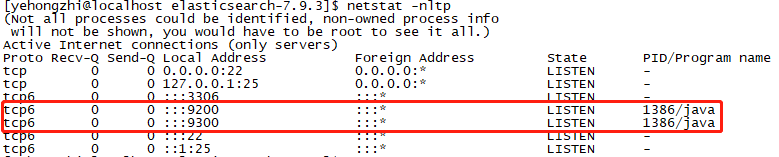
Use the command netstat -nltp to view the port number:
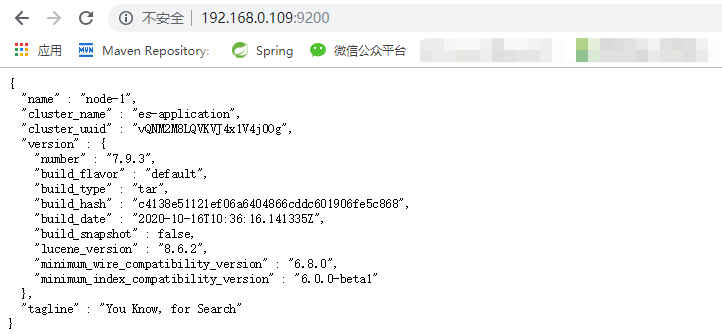
visit http://192.168.0.109:9200/ You can see the following information, indicating that the installation is successful.
2.2 installing Logstash
First download and install the compressed package on the official website, then unzip it and find logstash sample. Exe in the / config directory Conf file, modify the configuration:
input {
  file{
    path => ['/usr/local/user/*.log']
    type => 'user_log'
    start_position => "beginning"
  }
}

output {
  elasticsearch {
    hosts => ["http://192.168.0.109:9200"]
    index => "user-%{+YYYY.MM.dd}"
  }
}
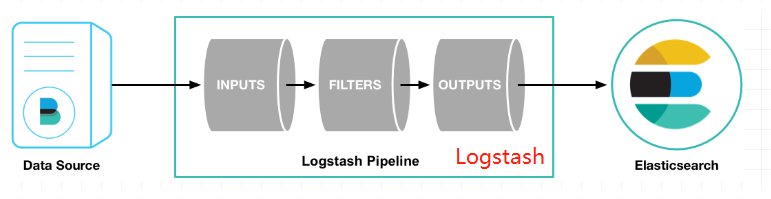
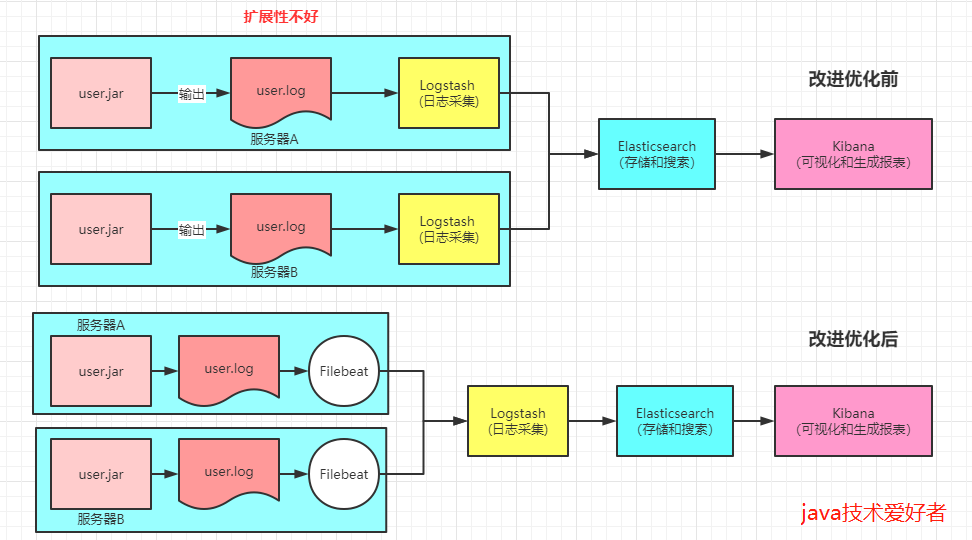
Input represents the input source and output represents the output. filter filtering can also be configured. The architecture is as follows:
After configuration, you should have a data source, that is, a log file, and prepare a user user.jar, and then start the application log file and output it to the background Log, the command is as follows:
nohup java -jar user.jar >/usr/local/user/user.log &
Then start Logstash in the background. The command is as follows:
nohup ./bin/logstash -f /usr/logstash-7.9.3/config/logstash-sample.conf &
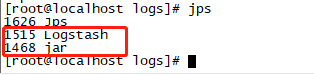
After startup, use the jps command to see two processes running:
2.3 installation of Kibana
First, download the compressed package from the official website, then unzip it and find kibana. Com in the / config directory YML file, modify configuration:
server.port: 5601
server.host: "192.168.0.111"
elasticsearch.hosts: ["http://192.168.0.109:9200"]
Like elasticSearch, it cannot be started by root user. You need to create a user:
# Create user
useradd kibana
# Set password
passwd kibana
# Give user permission
chown -R kibana:kibana /usr/kibana/
Then start with the command:
#Switch users
su kibana
#If it is not started in the background, close the shell window and exit
./bin/kibana
#Background start
nohup ./bin/kibana &
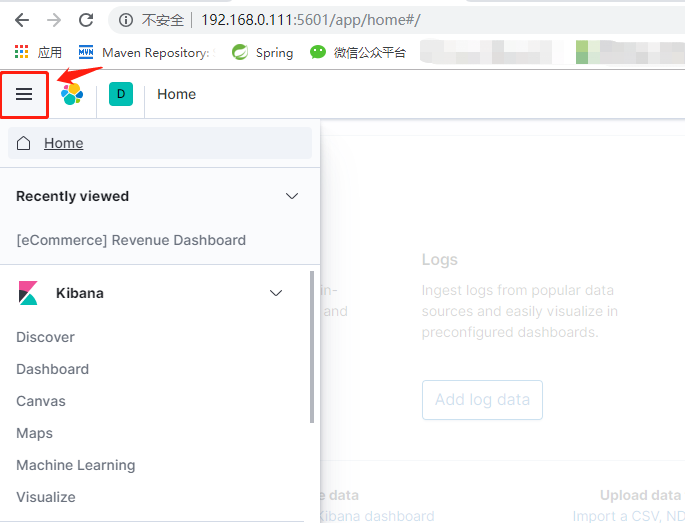
Open in browser after startup http://192.168.0.111:5601 , you can see kibana's web interactive interface:
2.4 effect display
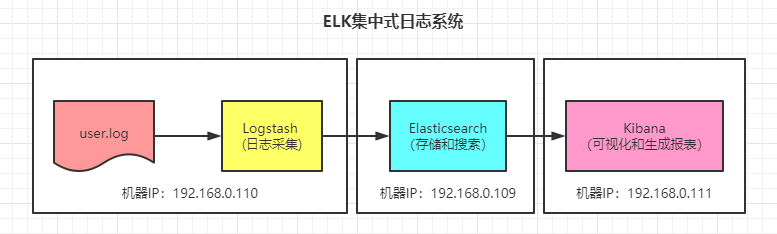
After successful startup, the whole process should be like this. Let's take a look:
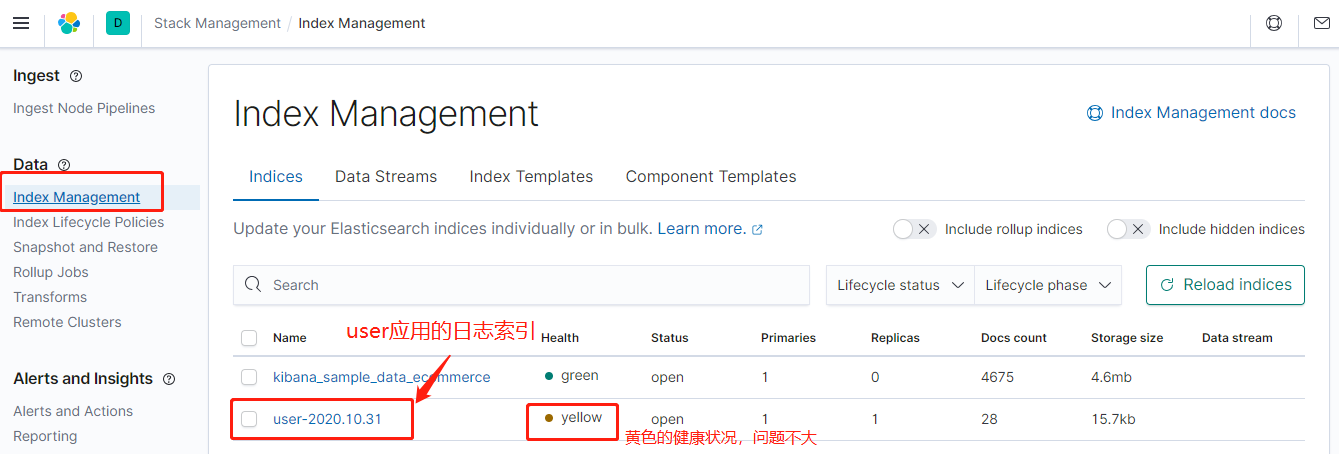
Browser open http://192.168.0.111:5601 , in the management interface, click "Index Management" to see that there is an index of user-2020.10.31.
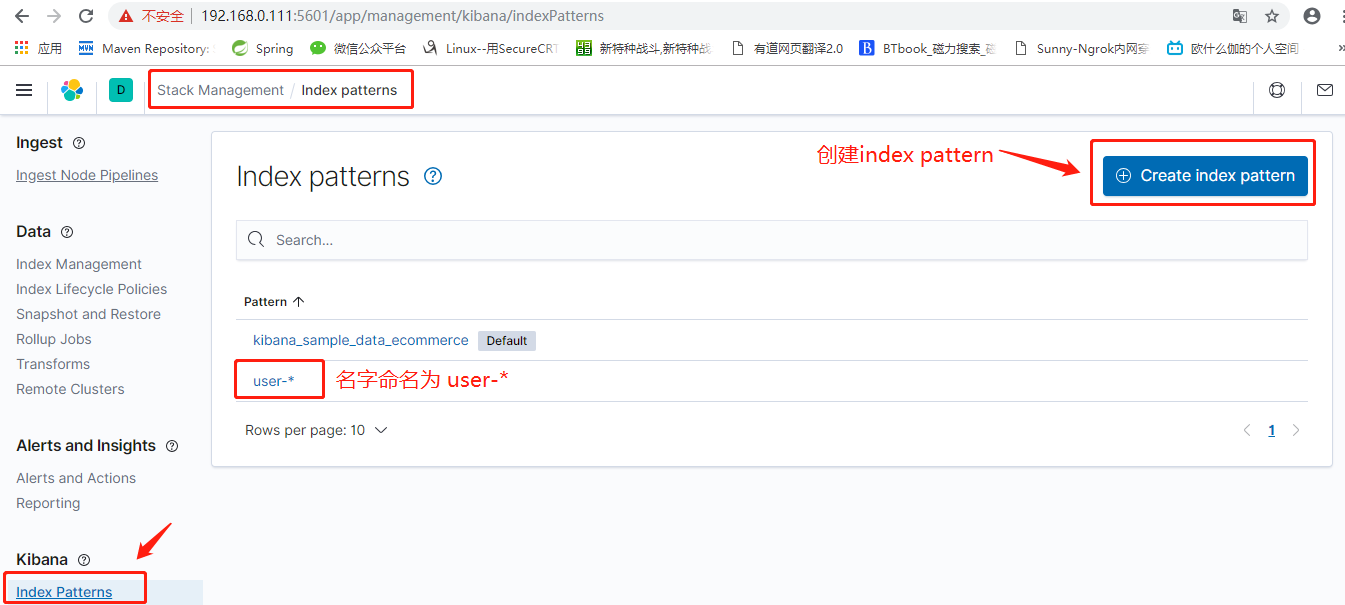
Click the Index Patterns menu bar, and then create, named user - *.
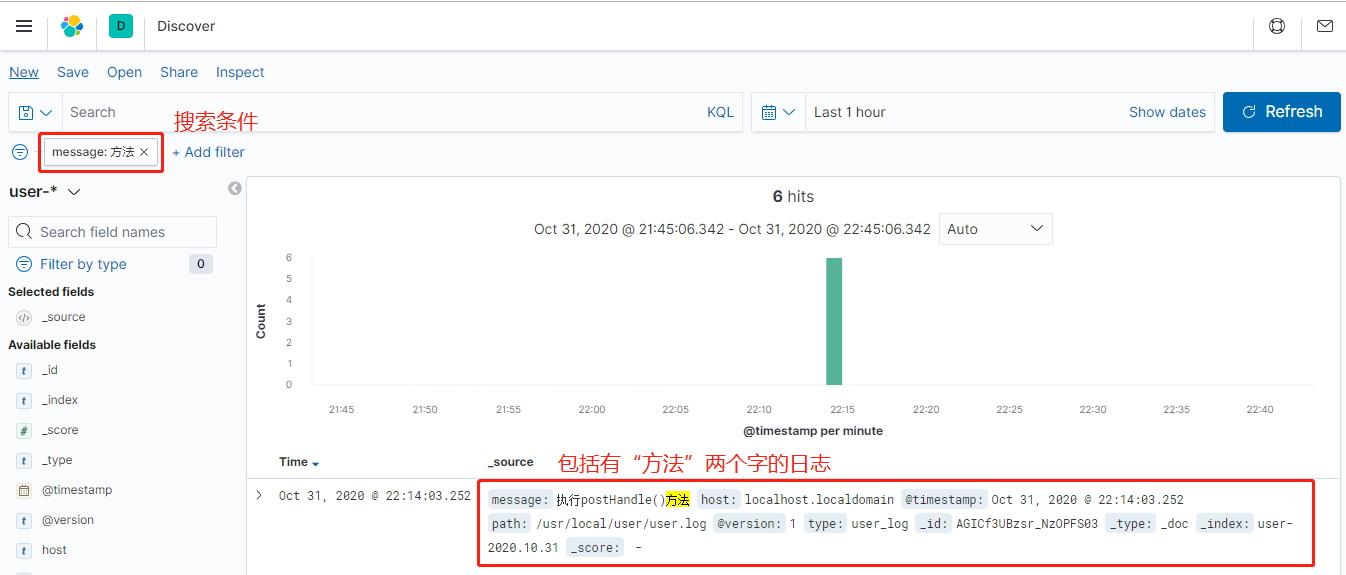
Finally, you can go to the Discover column to select, select the Index Pattern of user - *, and then search the keyword to find the relevant log!
3, Improved optimization
The above only uses the three core components. ELK, which is simply built, is actually defective. If Logstash needs to add plug-ins, plug-ins should be added to Logstash of all servers, which has poor scalability. So there is FileBeat, which takes up less resources. It is only responsible for collecting logs and does nothing else. In this way, it is lightweight. Extract Logstash and do some filtering.
FileBeat is also an official recommended log collector. First download the Linux Installation Package:
https://artifacts.elastic.co/downloads/beats/filebeat/filebeat-7.9.3-linux-x86_64.tar.gz
After downloading, unzip. Then modify filebeat YML profile:
#Input source
filebeat.inputs:
- type: log
  enabled: true
  paths:
    - /usr/local/user/*.log
#Output, server address of Logstash
output.logstash:
  hosts: ["192.168.0.110:5044"]
#Output. If it is directly output to ElasticSearch, fill in this field
#output.elasticsearch:
  #hosts: ["localhost:9200"]
  #protocol: "https"
Then the Logstash configuration file Logstash - sample Conf, also change:
#Change the input source to beats
input {
  beats {
    port => 5044
    codec => "json"
  }
}
Then start FileBeat:
#Background start command
nohup ./filebeat -e -c filebeat.yml >/dev/null 2>&1 &
Restart Logstash:
#Background start command
nohup ./bin/logstash -f /usr/logstash-7.9.3/config/logstash-sample.conf &
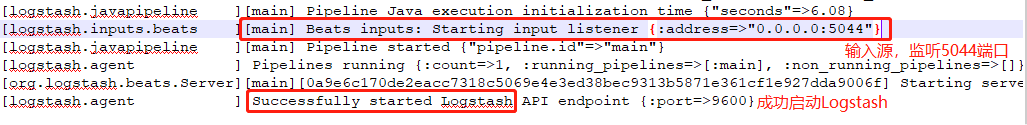
How to judge the success of startup? Look at Logstash-plain in the / logs directory of the Logstash application Log file:
Write at the end
At present, many Internet companies use ELK as a centralized log system for a simple reason: open source, many plug-ins, easy to expand, many data sources supported, active community, out of the box and so on. I've seen a company add a Kafka cluster to the above architecture, mainly based on the consideration of a large amount of log data. However, the three basic components ElasticSearch, Logstash and Kibana are indispensable. I hope this article can help you have some preliminary understanding of ELK. Thank you for reading.
After reading, you can leave a message below to discuss what you don't understand
Thank you for watching.
If you think the article is helpful to you, remember to pay attention to me and give me some praise and support!
Author: java technology enthusiast
K is a centralized log system for simple reasons: open source, many plug-ins, easy to expand, many data sources supported, active community, out of the box, etc. I've seen a company add a Kafka cluster to the above architecture, mainly based on the consideration of a large amount of log data. However, the three basic components ElasticSearch, Logstash and Kibana are indispensable. I hope this article can help you have some preliminary understanding of ELK. Thank you for reading.
After reading, you can leave a message below to discuss what you don't understand
Thank you for watching.
If you think the article is helpful to you, remember to pay attention to me and give me some praise and support!
Author: java technology enthusiast