Operation and maintenance - Practice (III) - Construction of basic Prometheus monitoring environment
In the previous article "building a basic Docker development environment", we have built a basic Docker environment for Linux servers, and we have made a custom network mode configuration. We can configure the specified IP for subsequent Docker containers, because the Prometheus monitoring system we want to build next needs the fixed IP address of the container.
| Revision time | Revised content | remarks |
|---|---|---|
| 2022/01/29 | Complete the construction of basic Prometheus monitoring environment | create |
1, Preliminary preparation for building basic monitoring environment
1. Preliminary preparations
Please be sure to install Docker and configure relevant network according to the previous article. Of course, it doesn't matter if there is no configuration. It's just that some optional parameters may need to be adjusted in subsequent operations, and the actual allocated container IP of the monitoring container may be queried.
It is recommended to read the full text first, and then carry out the actual operation. Because the common sense is to build a monitoring system first; Then build visualization; Then build relevant data source services, configure monitoring, and restart. Here, for the sake of the fluency of the full text, we choose to configure the data source first, configure the data monitoring, and then visualize the data.
1.1. Pull the subsequent required Docker image resources
prometheus: system monitoring and alarm, etc
grafana: visual monitoring data service
Node exporter: monitor server CPU, memory, disk, I/O information, etc
cadvisor: monitor container information, etc
# Pull related docker images
docker pull prom/prometheus
docker pull grafana/grafana
docker pull prom/node-exporter
docker pull google/cadvisor
II Configure data source environment
There are also two Docker containers with fixed IP and non fixed IP to run scripts. If you don't want to specify IPAddress, remove the corresponding optional parameter -- Network = code net -- IP 172.18.0*
2.1 node exporter server monitoring data source
2.1.1 start node exporter docker container
# Specify IPAddress
docker run --network=code-net --ip 172.18.0.3 -d --name node-exporter --restart=always -p 9100:9100 -v "/proc:/host/proc:ro" -v "/sys:/host/sys:ro" -v "/:/rootfs:ro" prom/node-exporter
# Unspecified IPAddress
docker run -d --name node-exporter --restart=always -p 9100:9100 -v "/proc:/host/proc:ro" -v "/sys:/host/sys:ro" -v "/:/rootfs:ro" prom/node-exporter
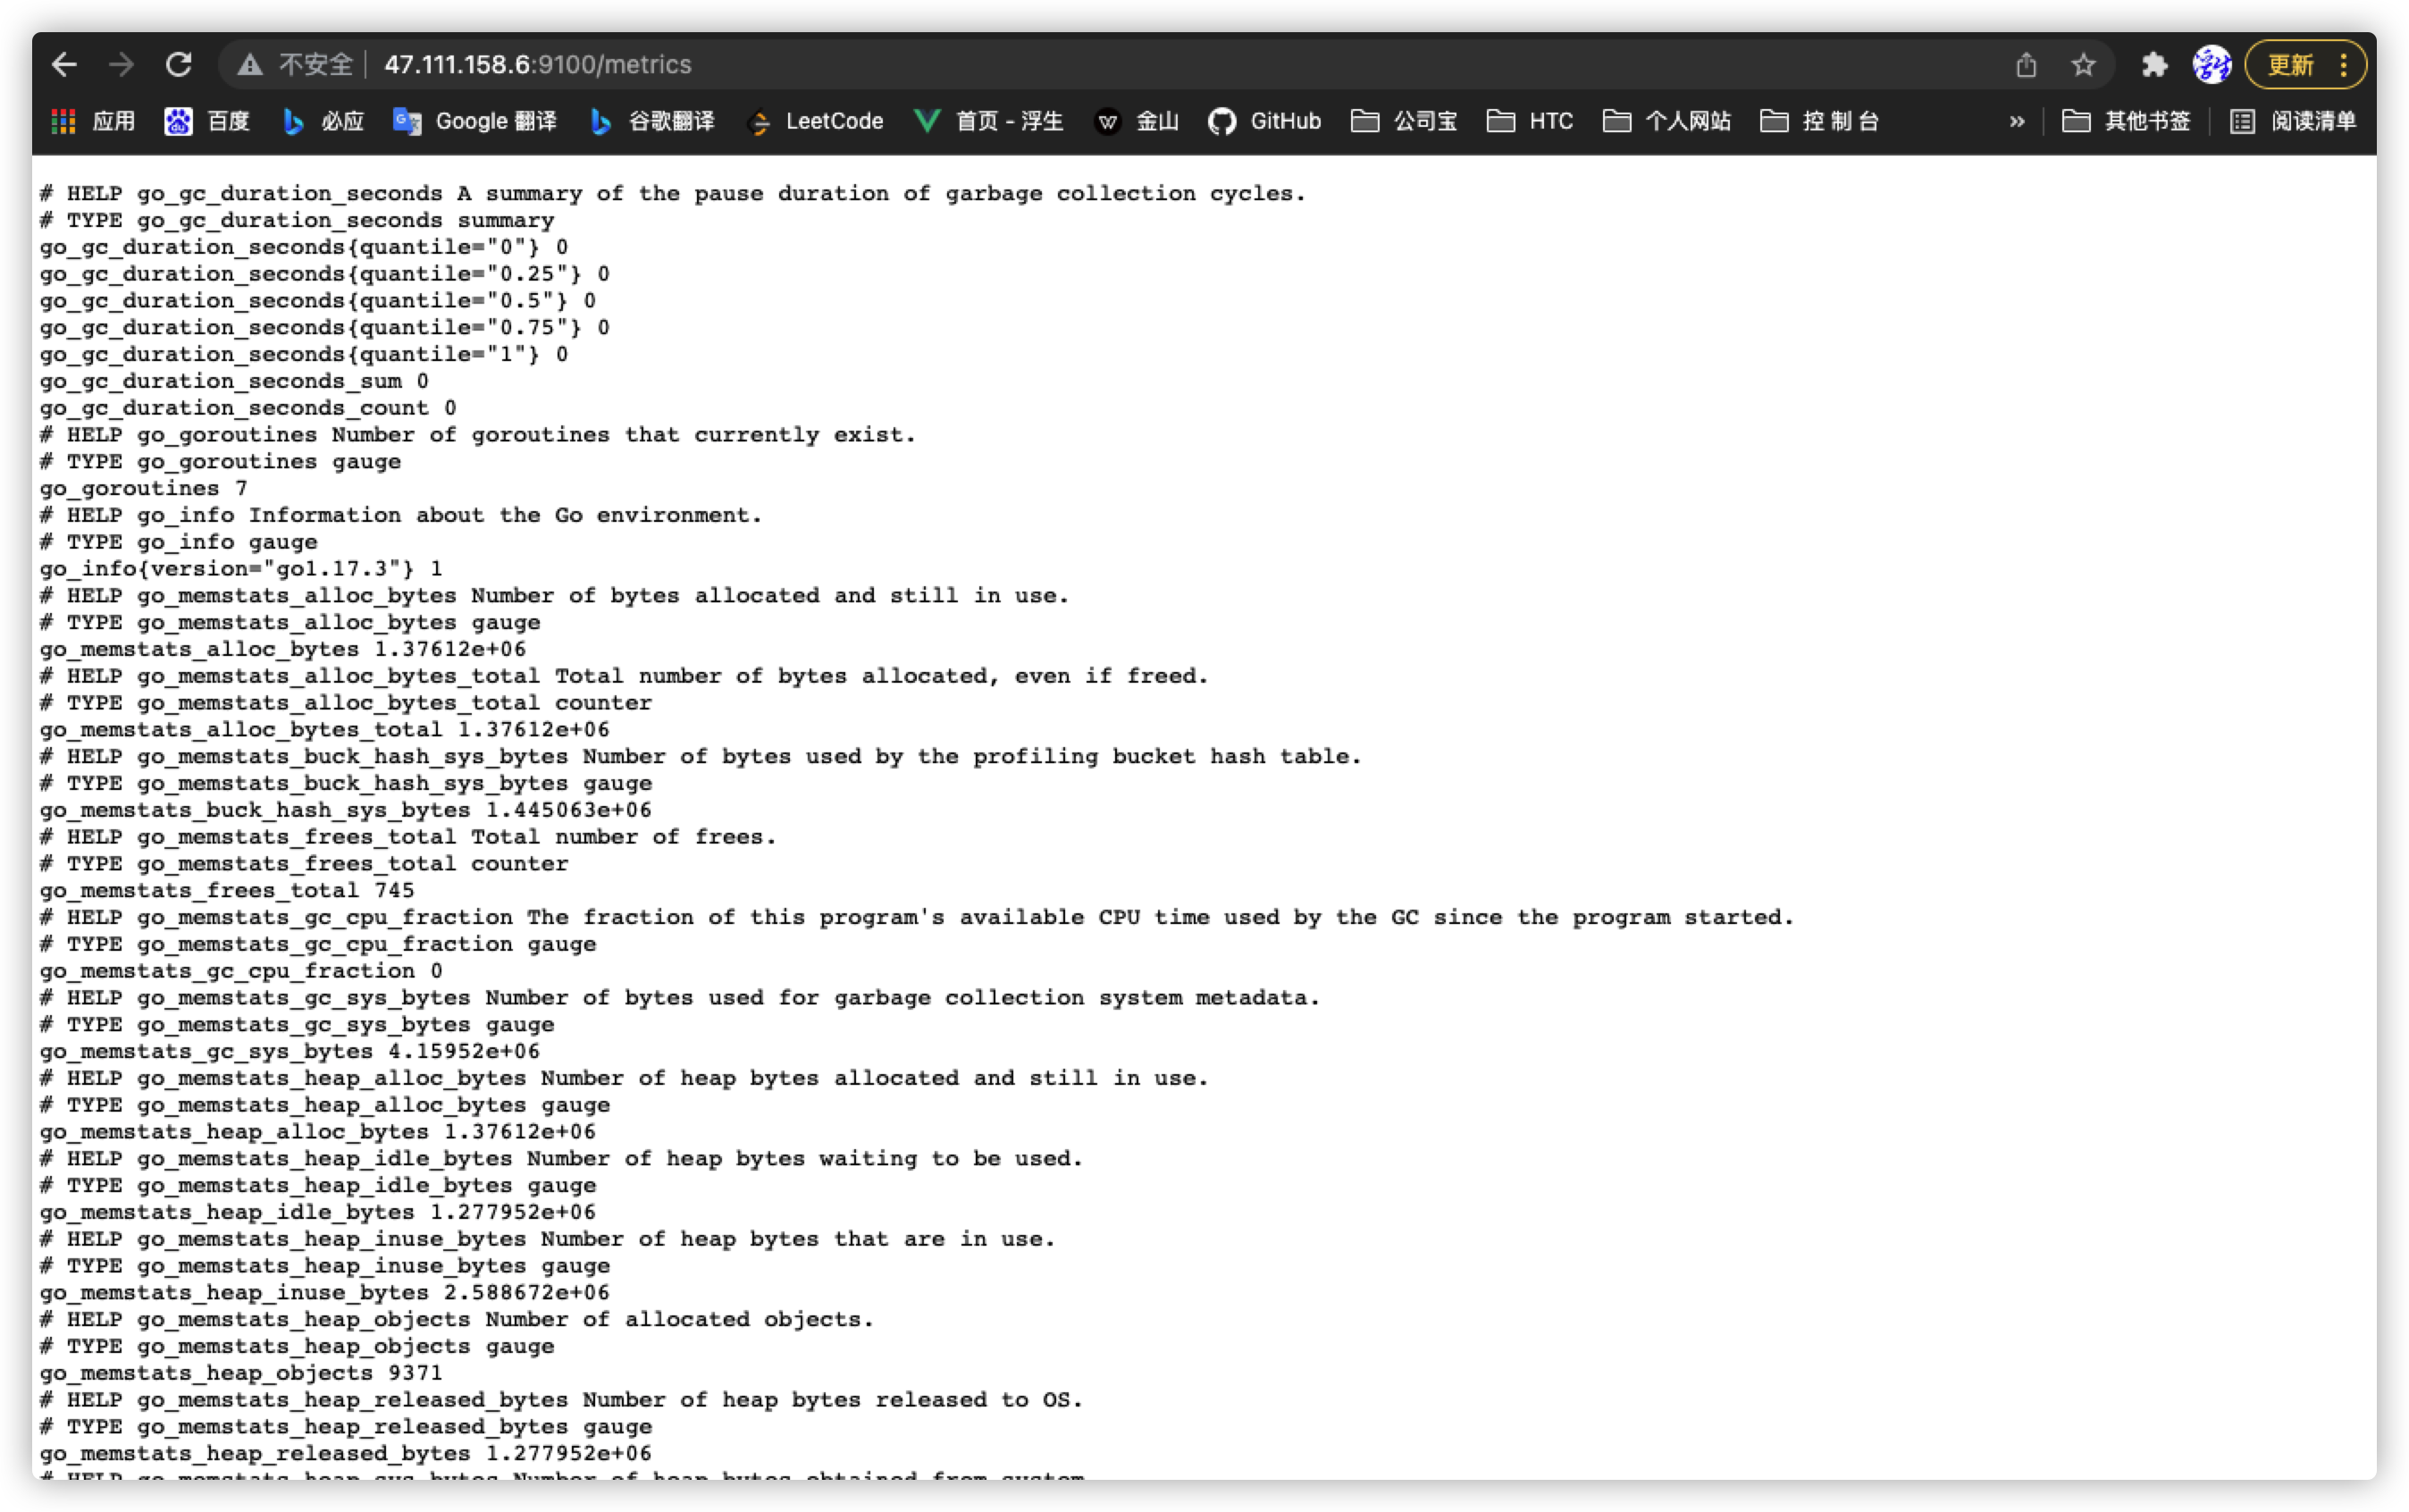
2.1.2 access test
Test address: http://47.111.158.6:9100/metrics
2.2 cadvisor container monitoring data source
2.2.1 cadvisor docker container startup
The external exposure port of docker container is adjusted here. 8080 is not recommended to be occupied by inherent services.
It should be noted that when prometheus configures IP and ports later, port 8080 should be configured here, because the container communication adopts the internal mechanism. The 8090 is used for server IP:Port access
# Specify IPAddress
docker run --network=code-net --ip 172.18.0.4 -v /:/rootfs:ro -v /var/run:/var/run:rw -v /sys:/sys:ro -v /var/lib/docker/:/var/lib/docker:ro -v /dev/disk/:/dev/disk:ro -p 9080:8080 -d --name=cadvisor --restart=always google/cadvisor:latest
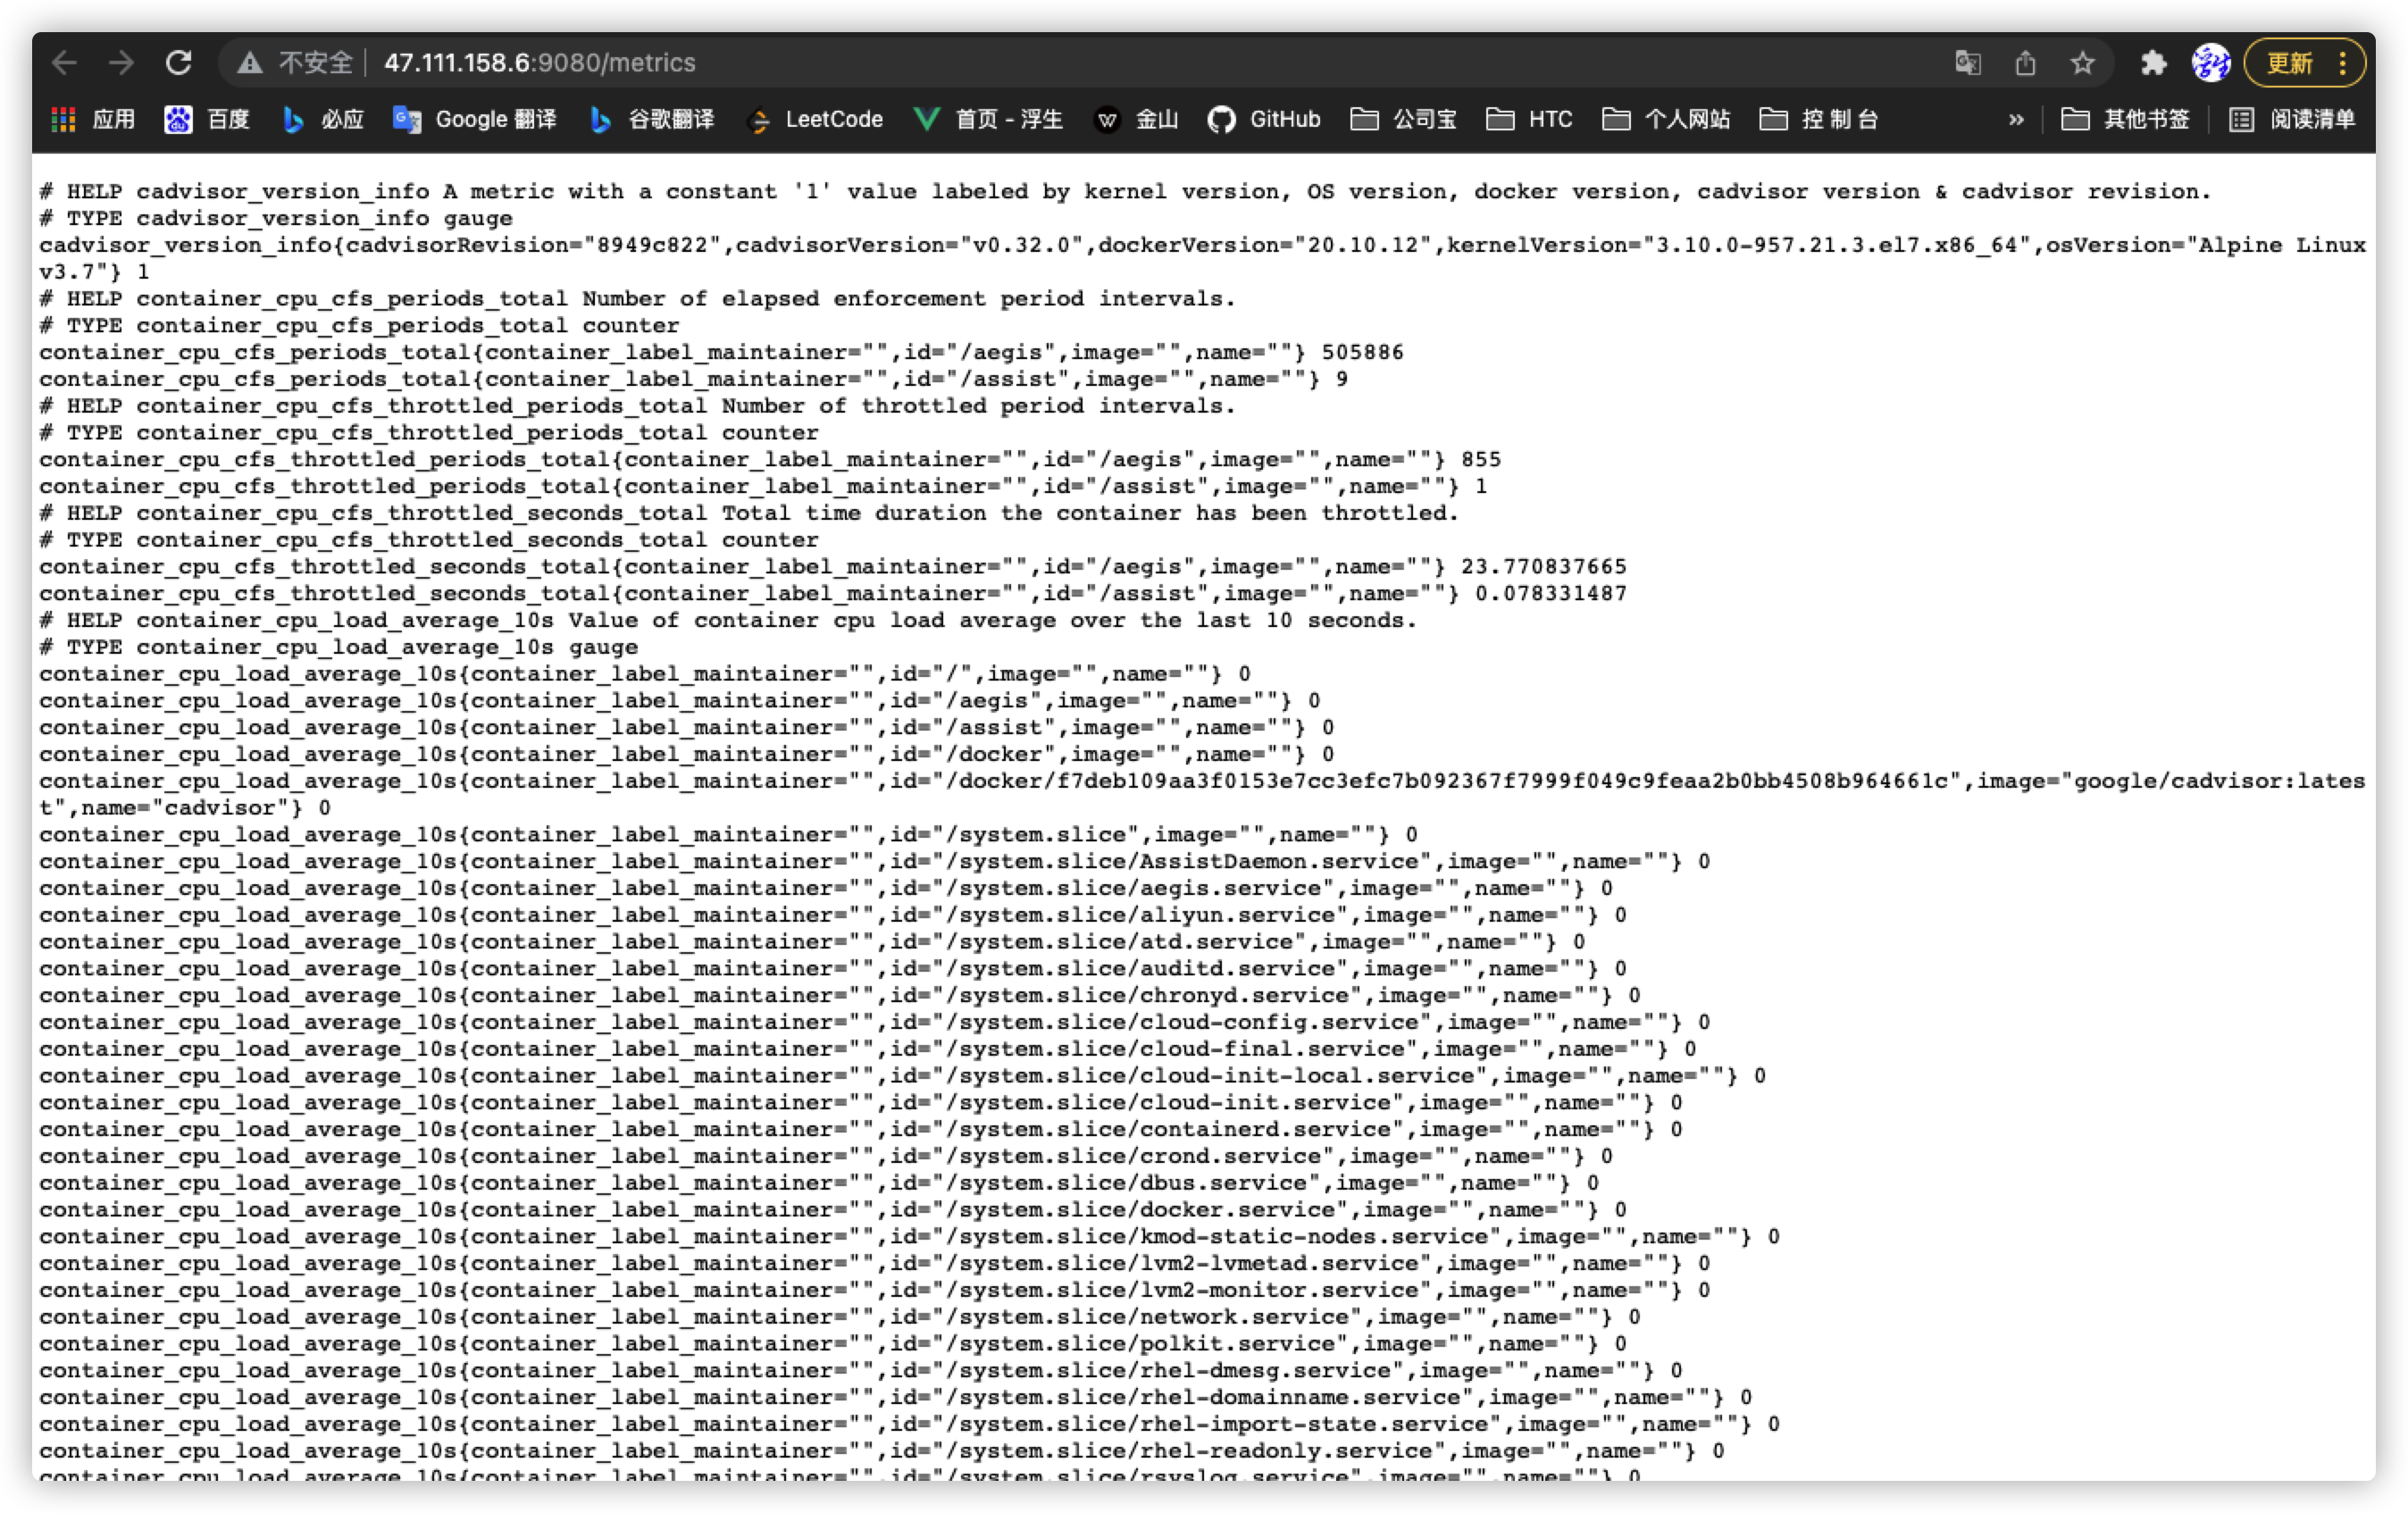
2.2.2 access test
Access test http://47.111.158.6:9080/metrics
3, Configure system monitoring
3.1 prometheus installation configuration
# Create a folder to store relevant configuration files of prometheus
mkdir /usr/local/prometheus
# switch
cd /usr/local/prometheus
# Create profile and edit
touch prometheu.yml
PS: the configuration file needs to obtain the IP address in the Docker container and the port number of the data source endpoint
- Here we get the container name through docker ps -a
- Then obtain the IP address "PS: if the IPAddress is fixed, it will not be affected by restarting Docker" in the Docker container through docker inspect [container name] |grep -E "IPAddress|HostPort"
$ docker inspect node-exporter | grep -E "IPAddress|HostPort"
                       "HostPort": "9100"
            "SecondaryIPAddresses": null,
            "IPAddress": "",
                    "IPAddress": "172.18.0.3",
$ docker inspect cadvisor | grep -E "IPAddress|HostPort"
                        "HostPort": "9080"
            "SecondaryIPAddresses": null,
            "IPAddress": "",
                    "IPAddress": "172.18.0.4",
prometheus.yml profile
The prometheus container IP preset here is 172.18.0.5
global:
  scrape_interval:     60s
  evaluation_interval: 60s

scrape_configs:
  - job_name: prometheus
    static_configs:
      - targets: ['172.18.0.5:9090']
        labels:
          instance: prometheus

  - job_name: node-exporter
    static_configs:
      - targets: ['172.18.0.3:9100']
        labels:
          instance: node-exporter

  - job_name: cadvisor
    static_configs:
      - targets: ['172.18.0.4:8080']
        labels:
          instance: cAdvisor
3.2 running the prometheus container
# prometheus fixed IPAddress
# The external container volume, that is, the configuration file, is selected here for subsequent modification
$ docker run --network=code-net --ip 172.18.0.5 -d --name prometheus --restart=always -p 9090:9090 -v /usr/local/prometheus/prometheus.yml:/etc/prometheus/prometheus.yml prom/prometheus
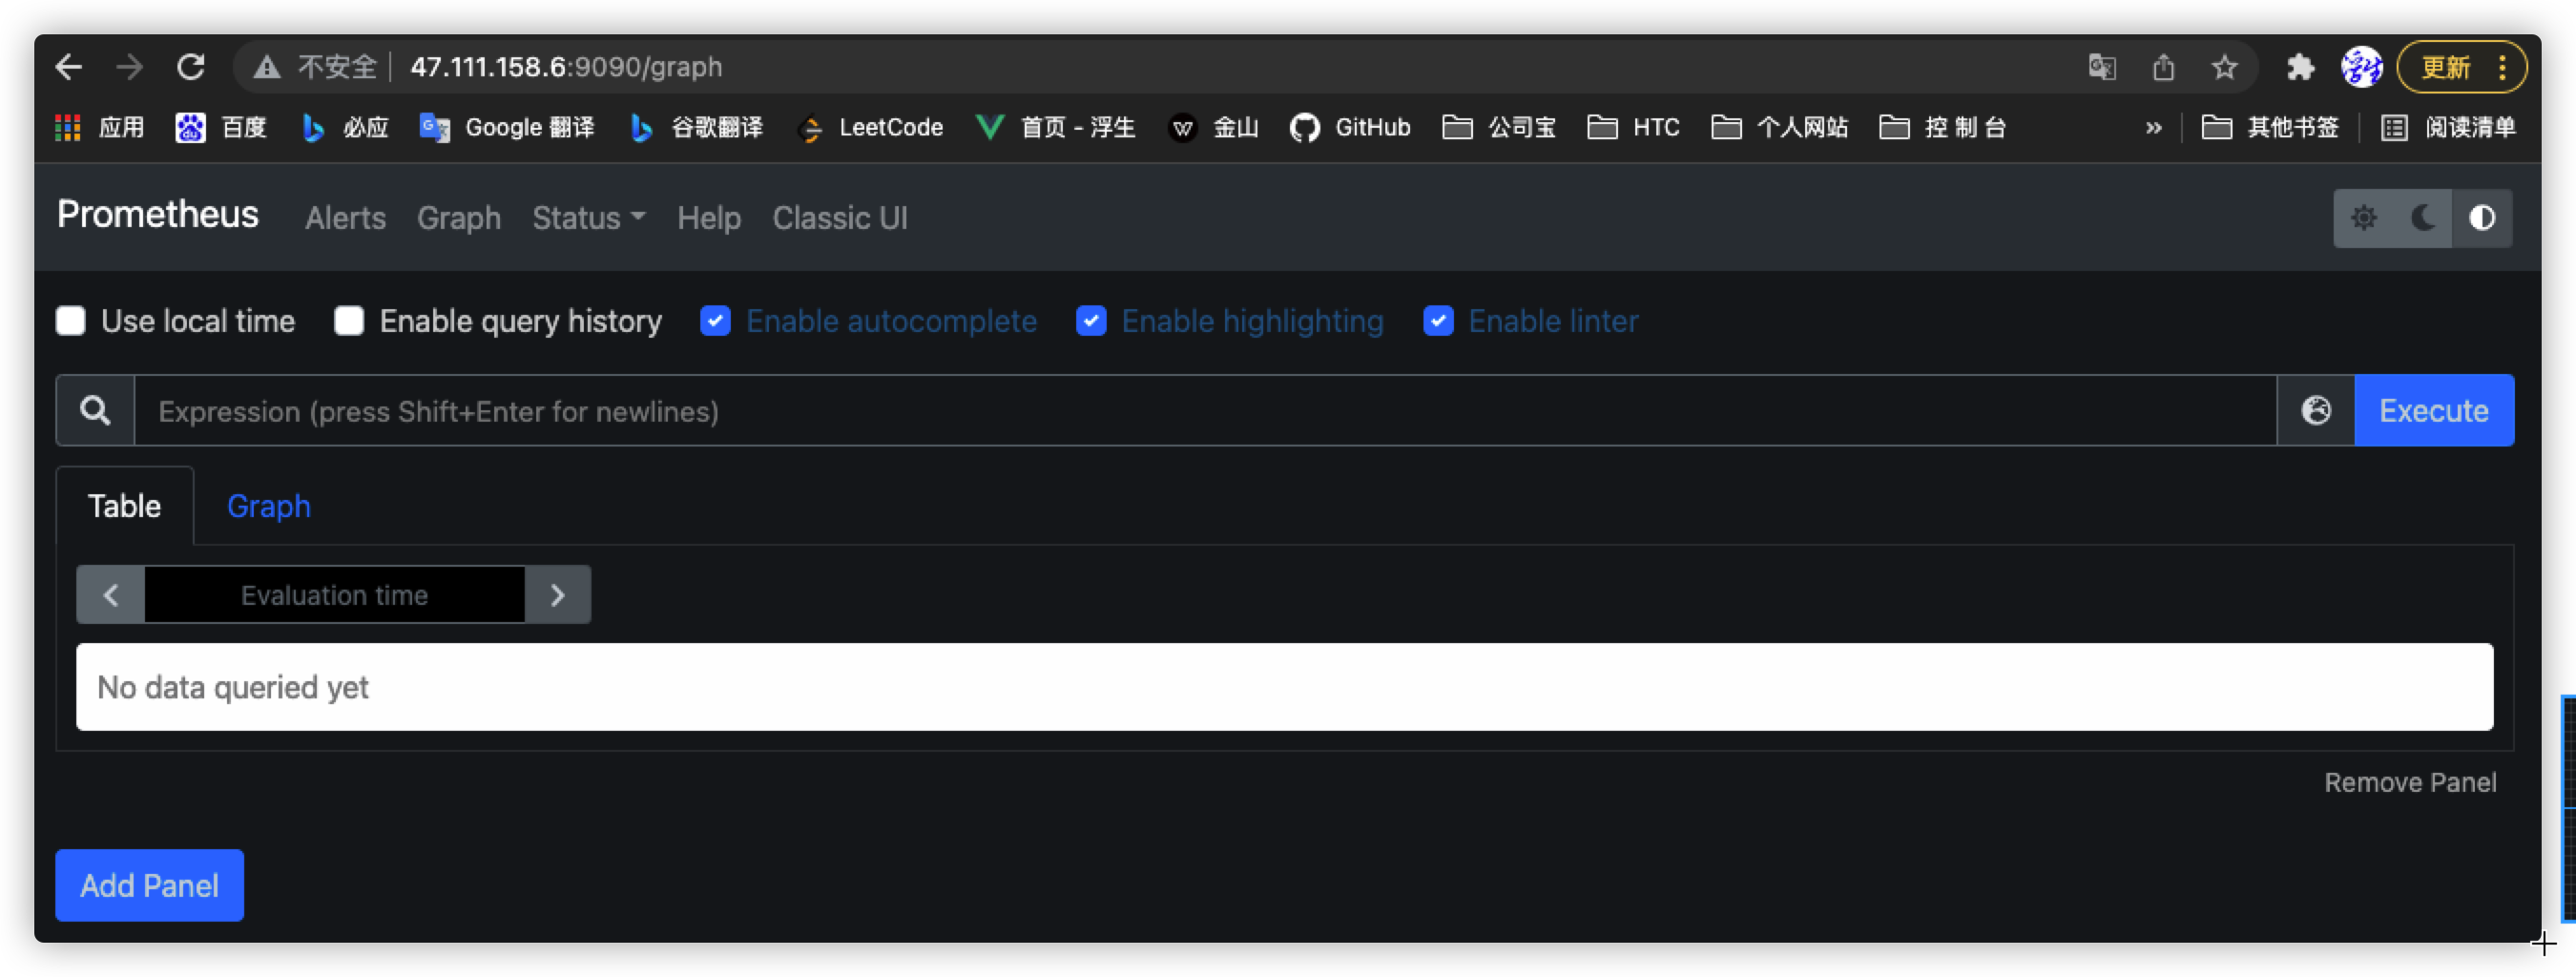
3.3 access test
Access test: http://47.111.158.6:9090/graph
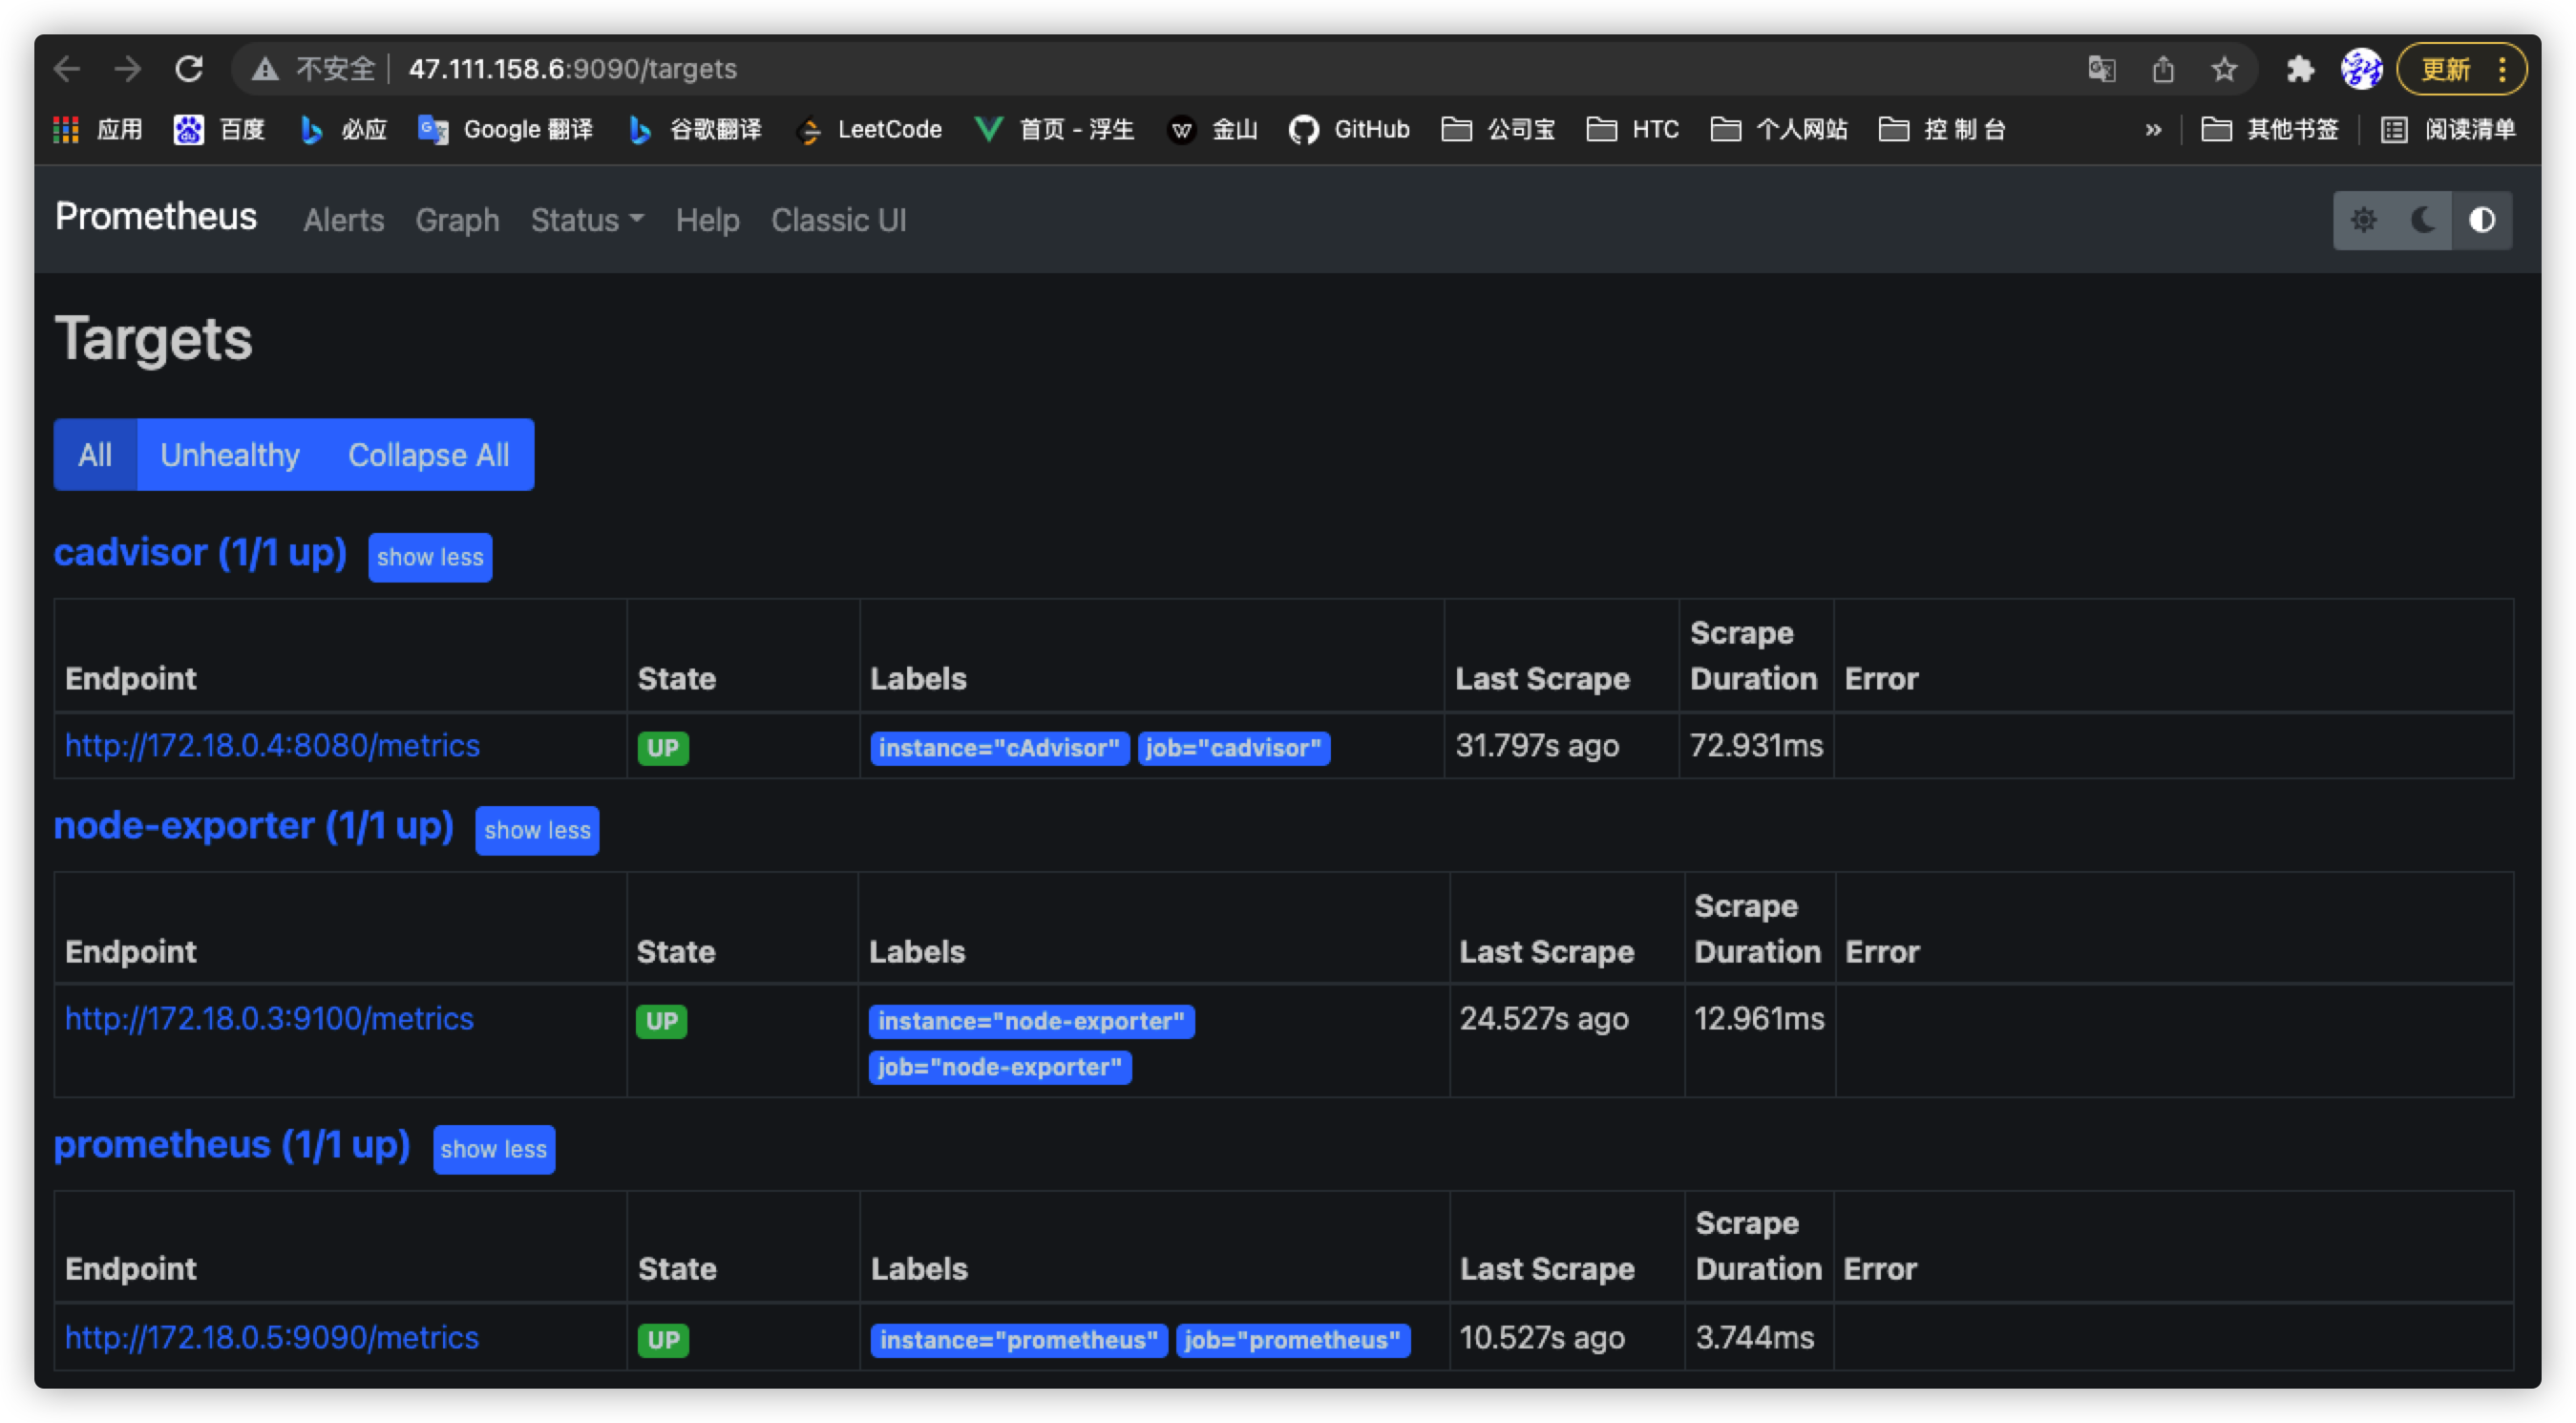
Access test: http://47.111.158.6:9090/targets
4, Configure Granfana monitoring visualization
4.1 build Granfana environment
grafana.ini configuration file cannot be modified inside the container
# Create an environment for storing user profiles
$ mkdir /usr/local/grafana-storage/etc
# Set permissions
$ chmod 777 -R /usr/local/grafana-storage

# Start the granfana docker container first
$ docker run --network=code-net --ip 172.18.0.6 -d --name grafana --restart=always -p 3000:3000 --name=grafana -v /usr/local/grafana-storage:/var/lib/grafana grafana/grafana

# Replace and configure sed syntax sed - I's / [old] / [new] / 'special characters \ escape
$ sed -i 's/\;domain \= localhost/domain \= 47\.111\.158\.6/' /usr/local/grafana-storage/etc/grafana.ini

# Inspection modification
$ cat /usr/local/grafana-storage/etc/grafana.ini | grep 'domain'

# Rerun
$ docker run --network=code-net --ip 172.18.0.6 -d --name grafana --restart=always -p 3000:3000 --name=grafana -v /usr/local/grafana-storage:/var/lib/grafana -v /usr/local/grafana-storage/etc/:/etc/grafana/ grafana/grafana
4.2 access test
Access test: http://47.111.158.6:3000/login
PS: account admin password admin
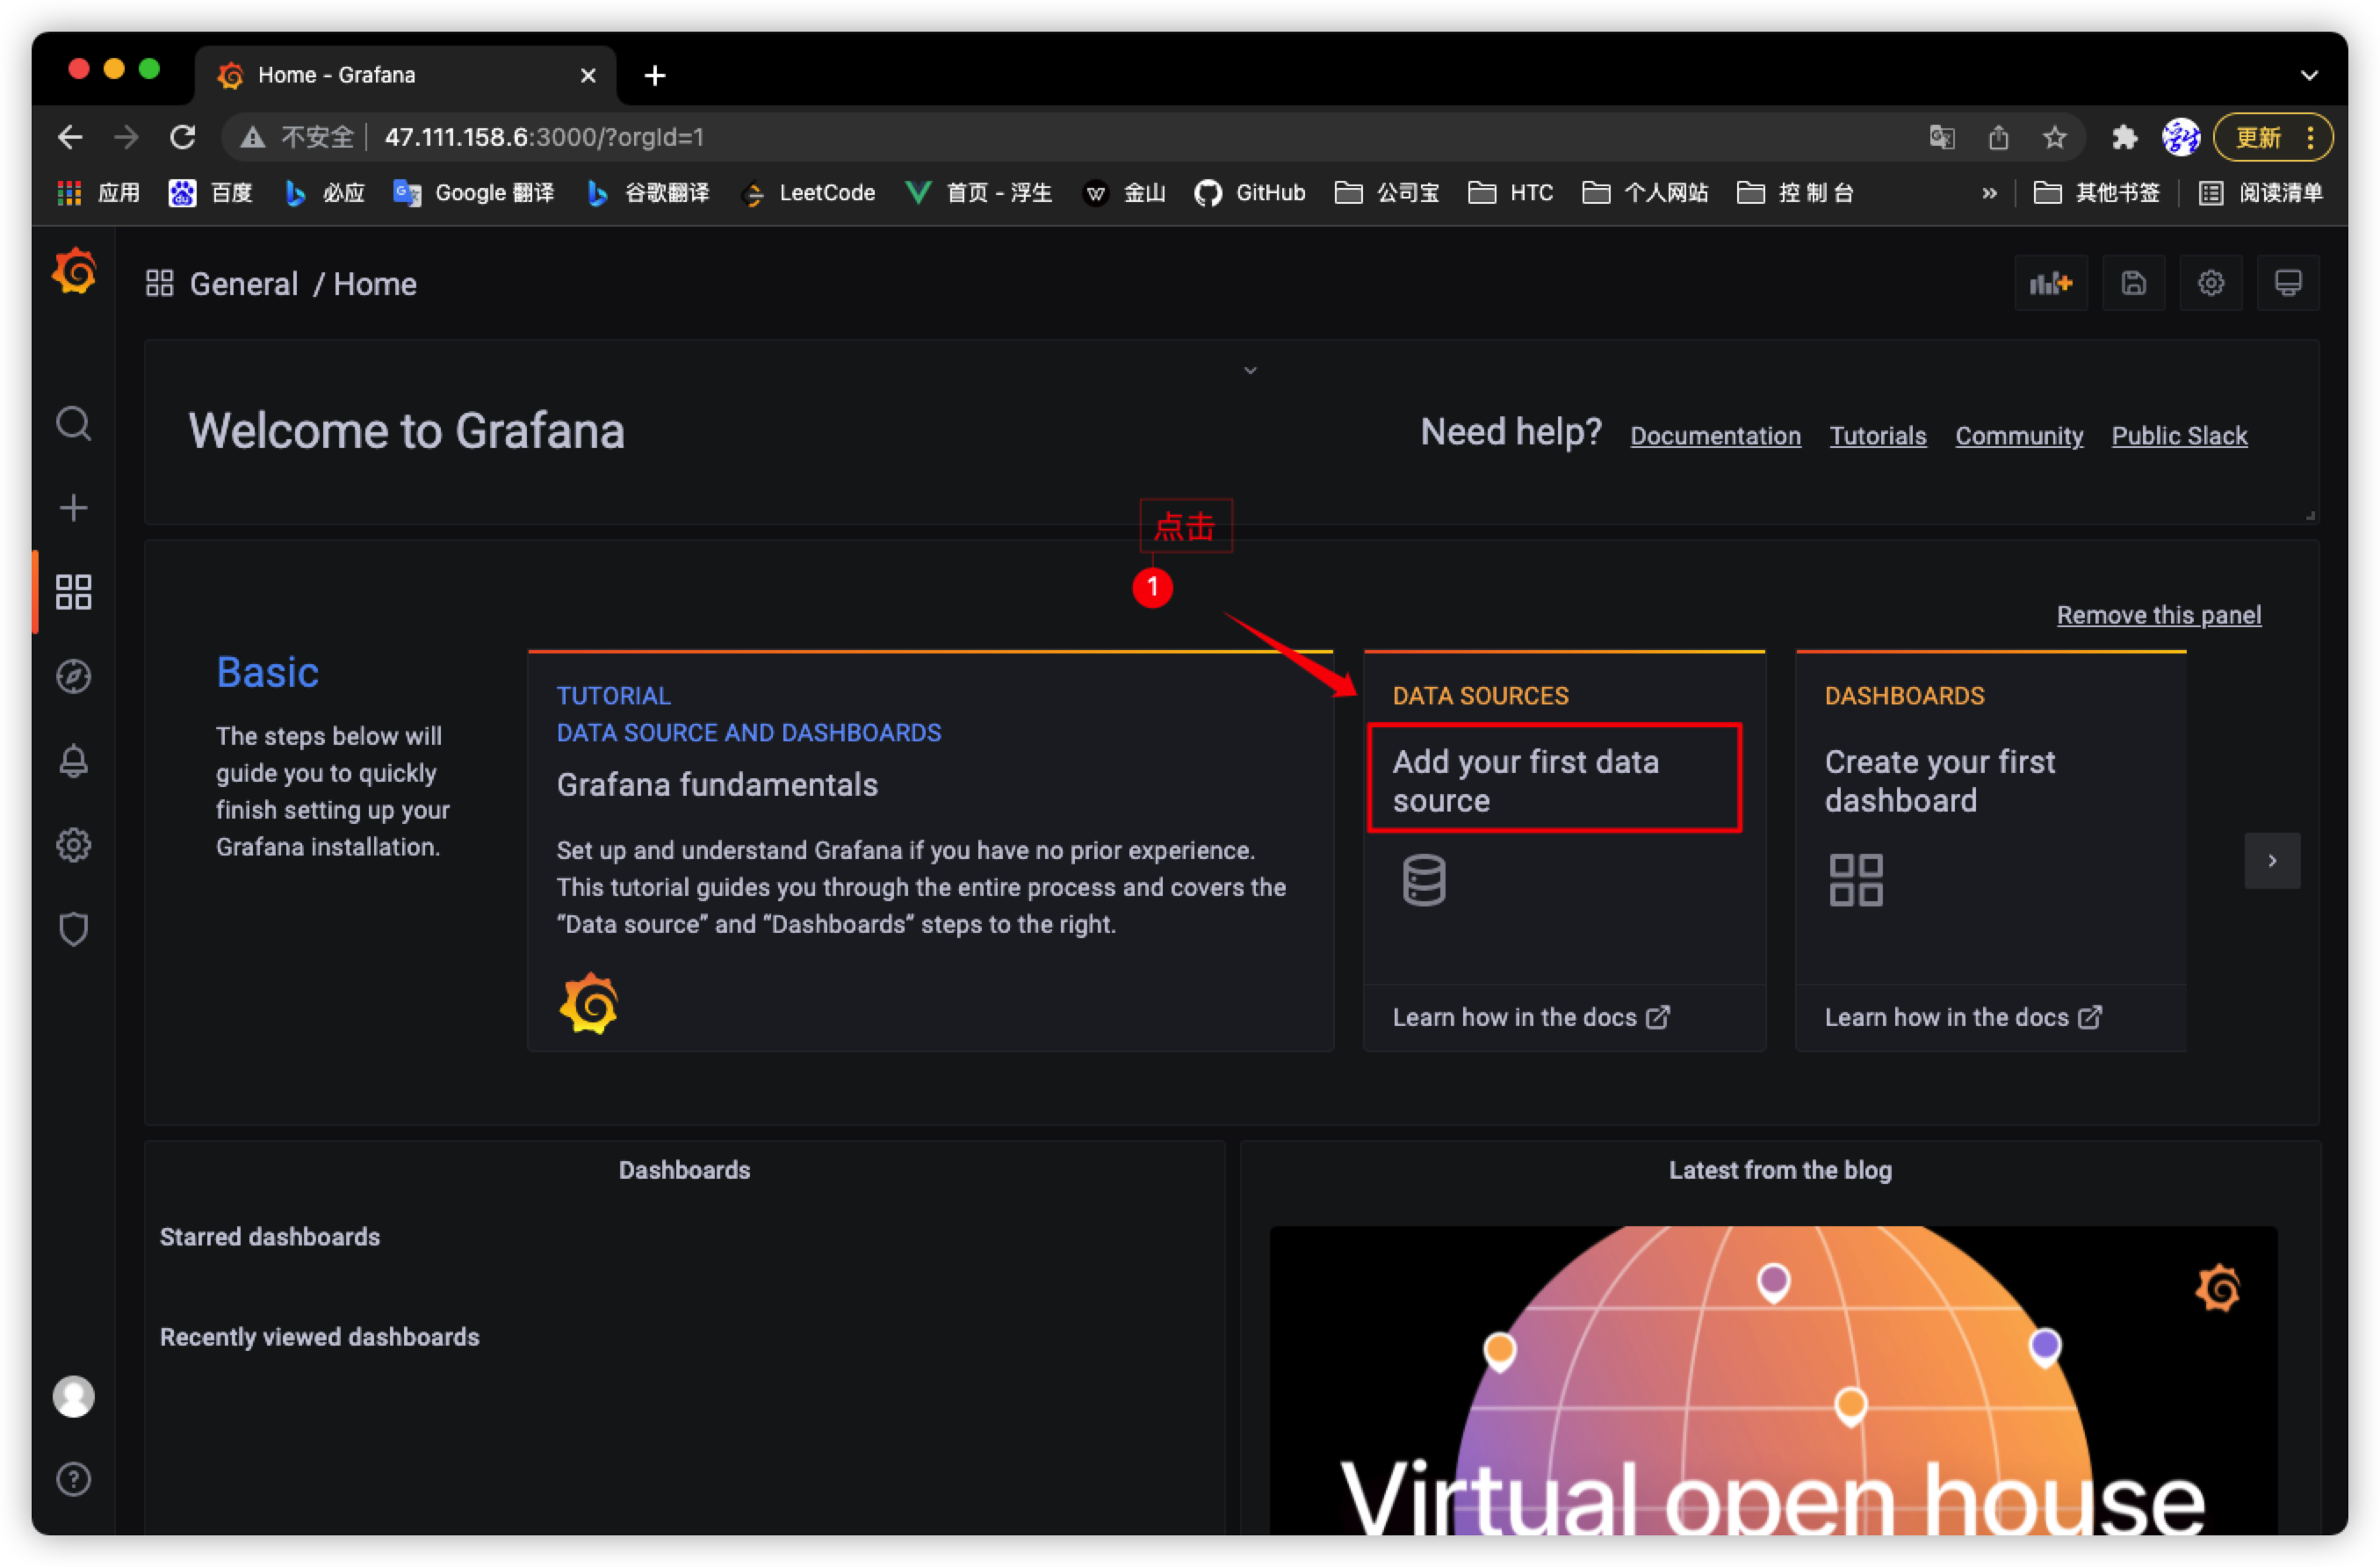
4.3 Granfana interface operation process guidance
1. Click Add your first data source to add a data source
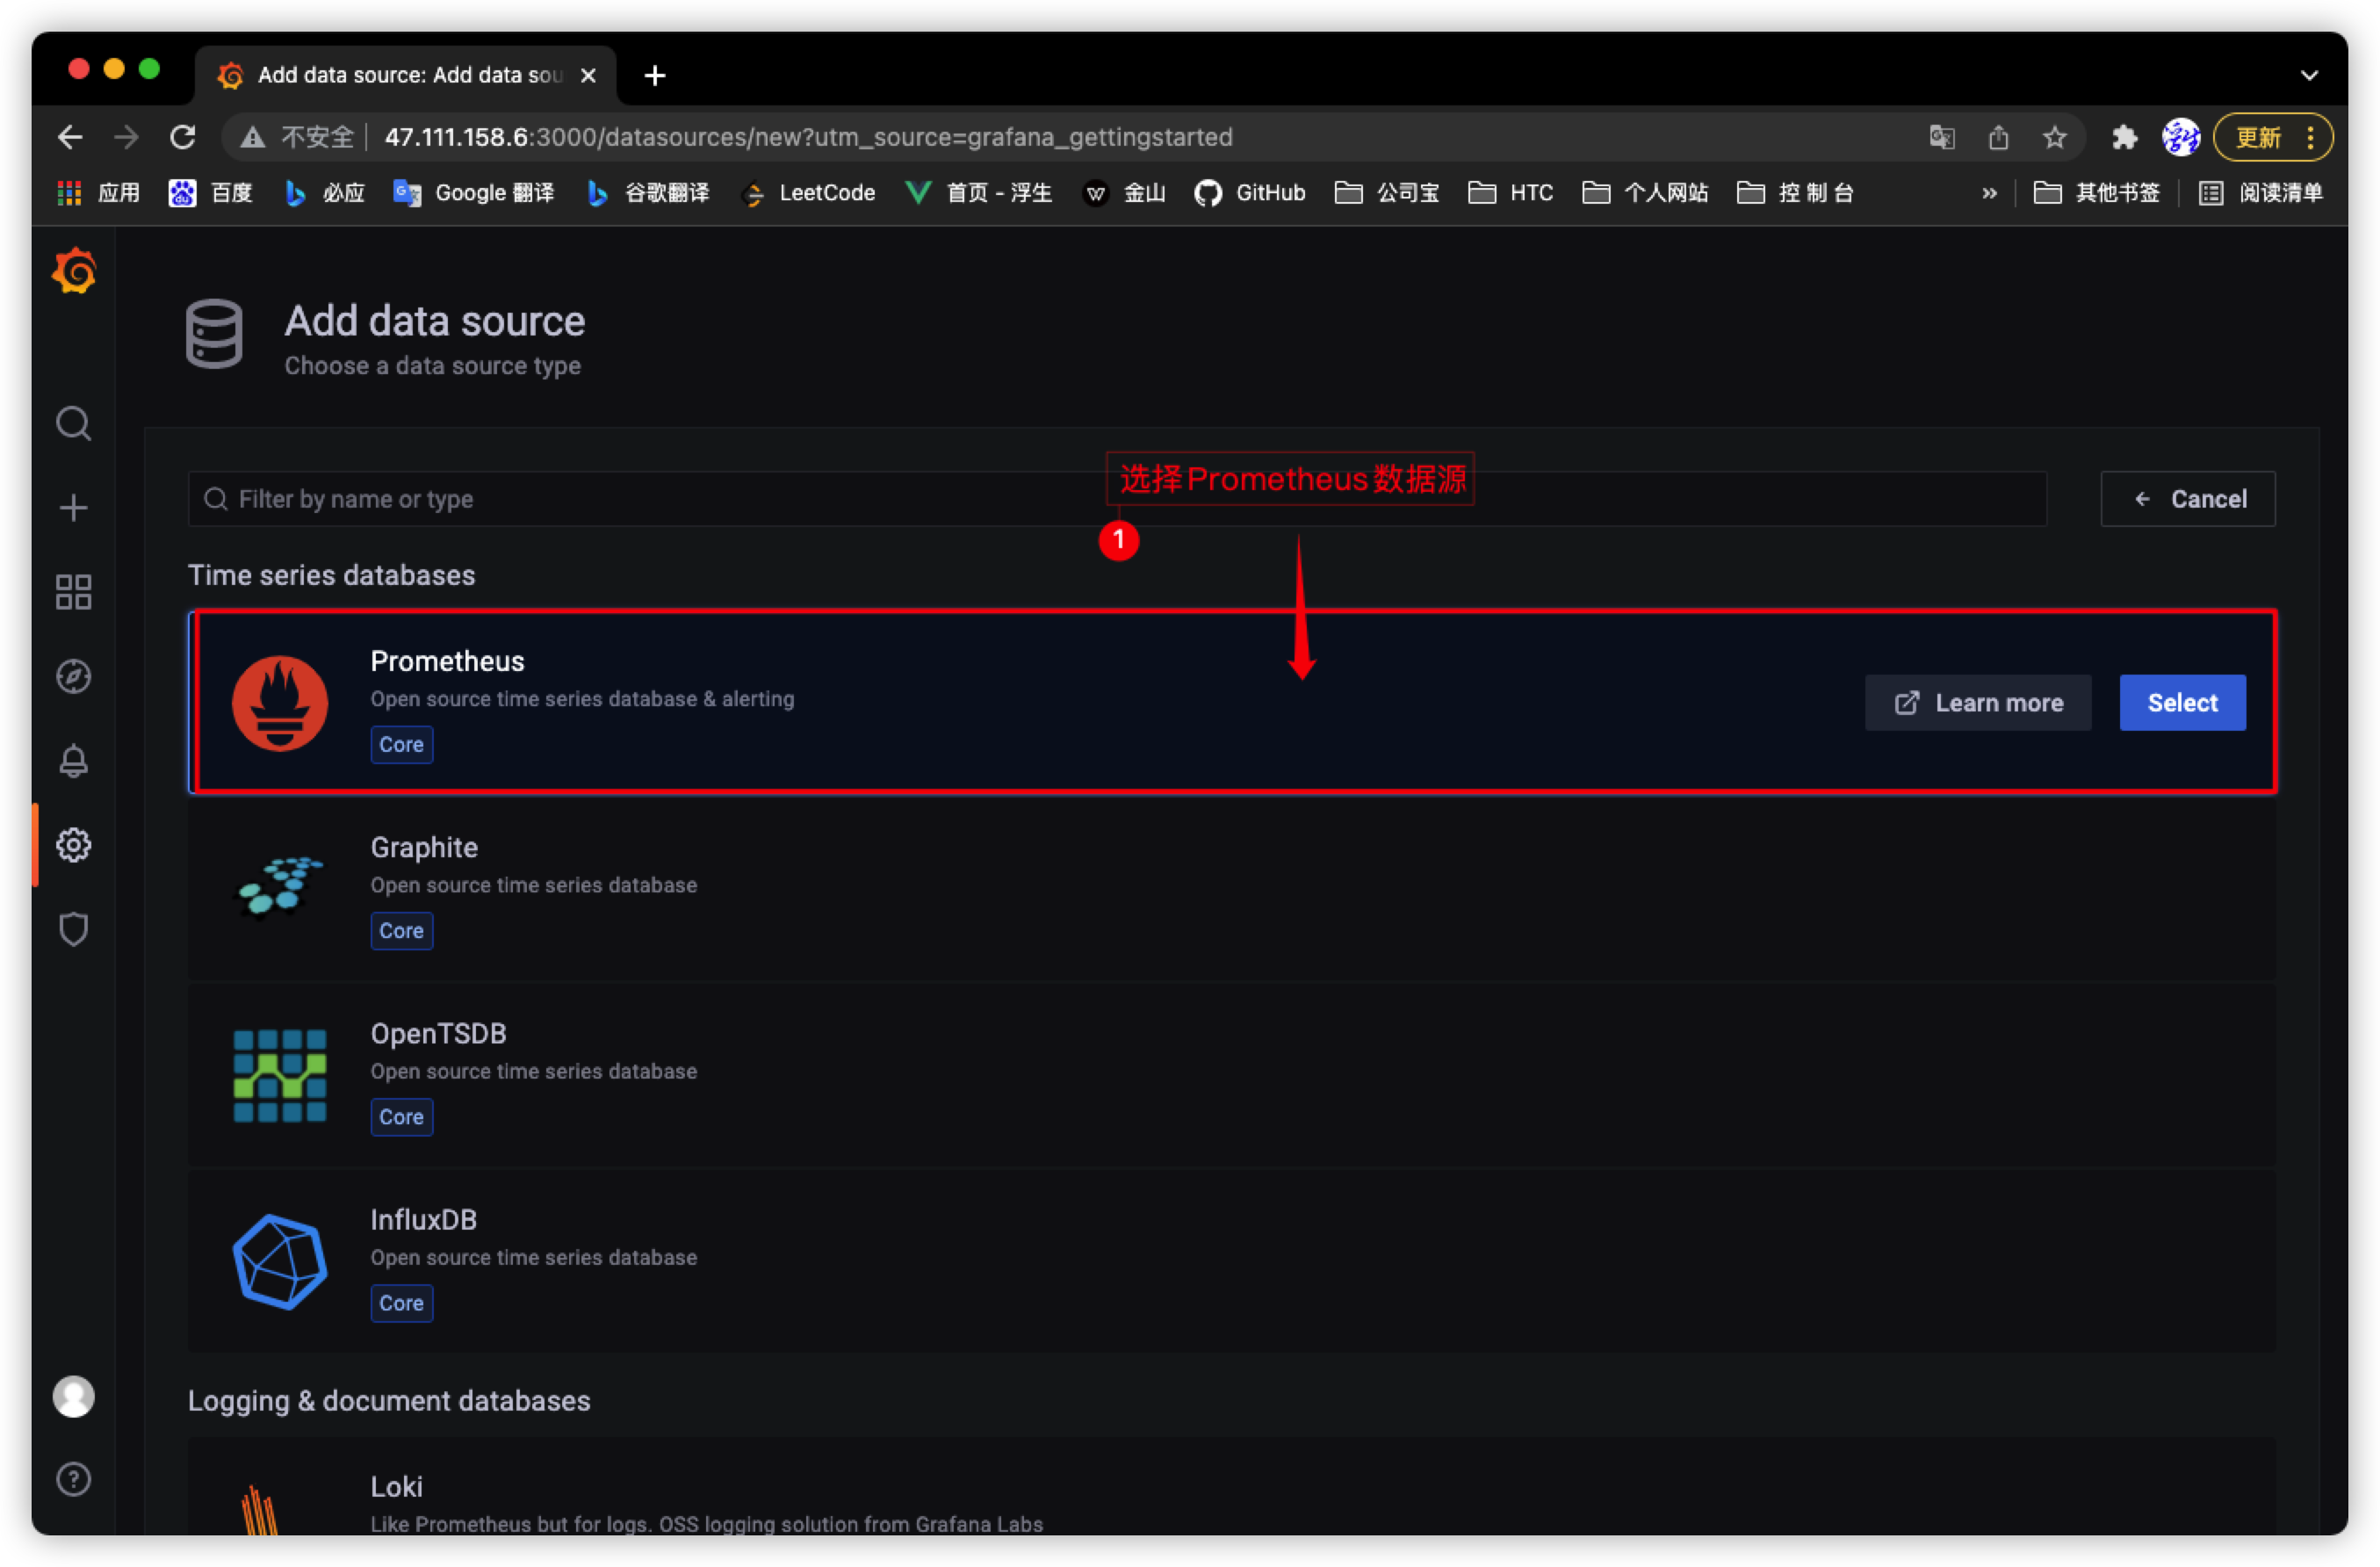
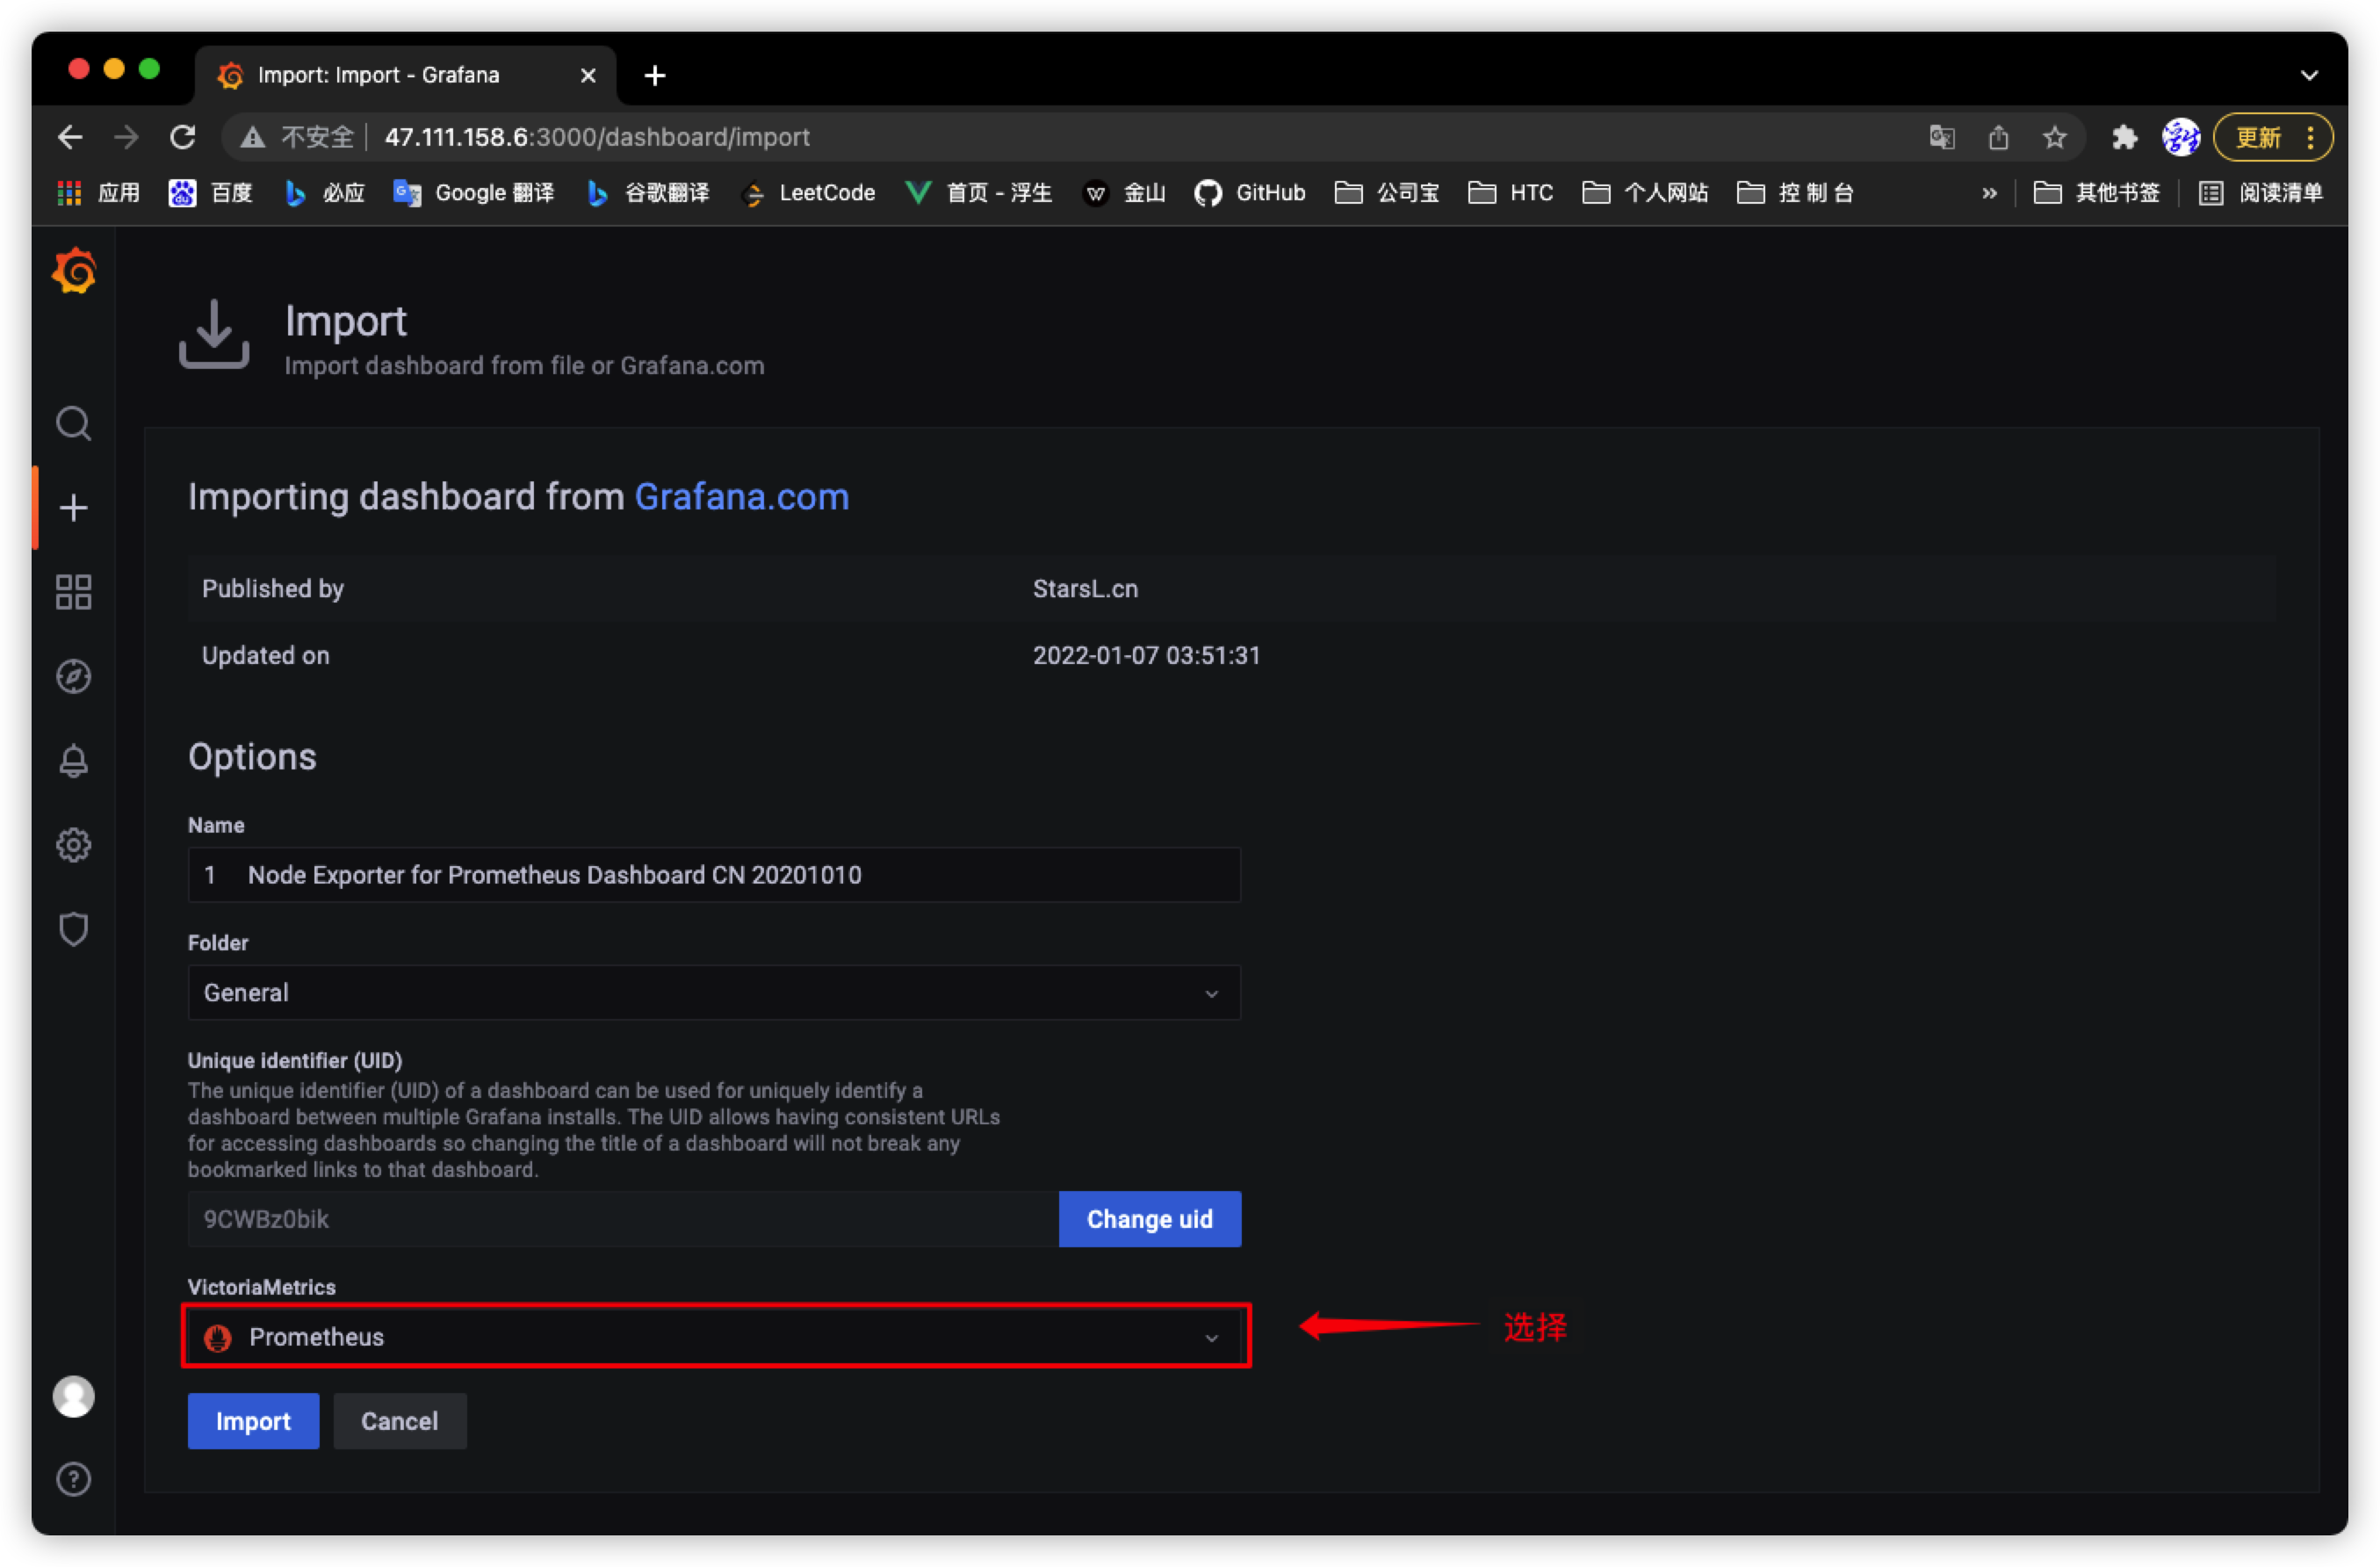
2. Select prometheus data source
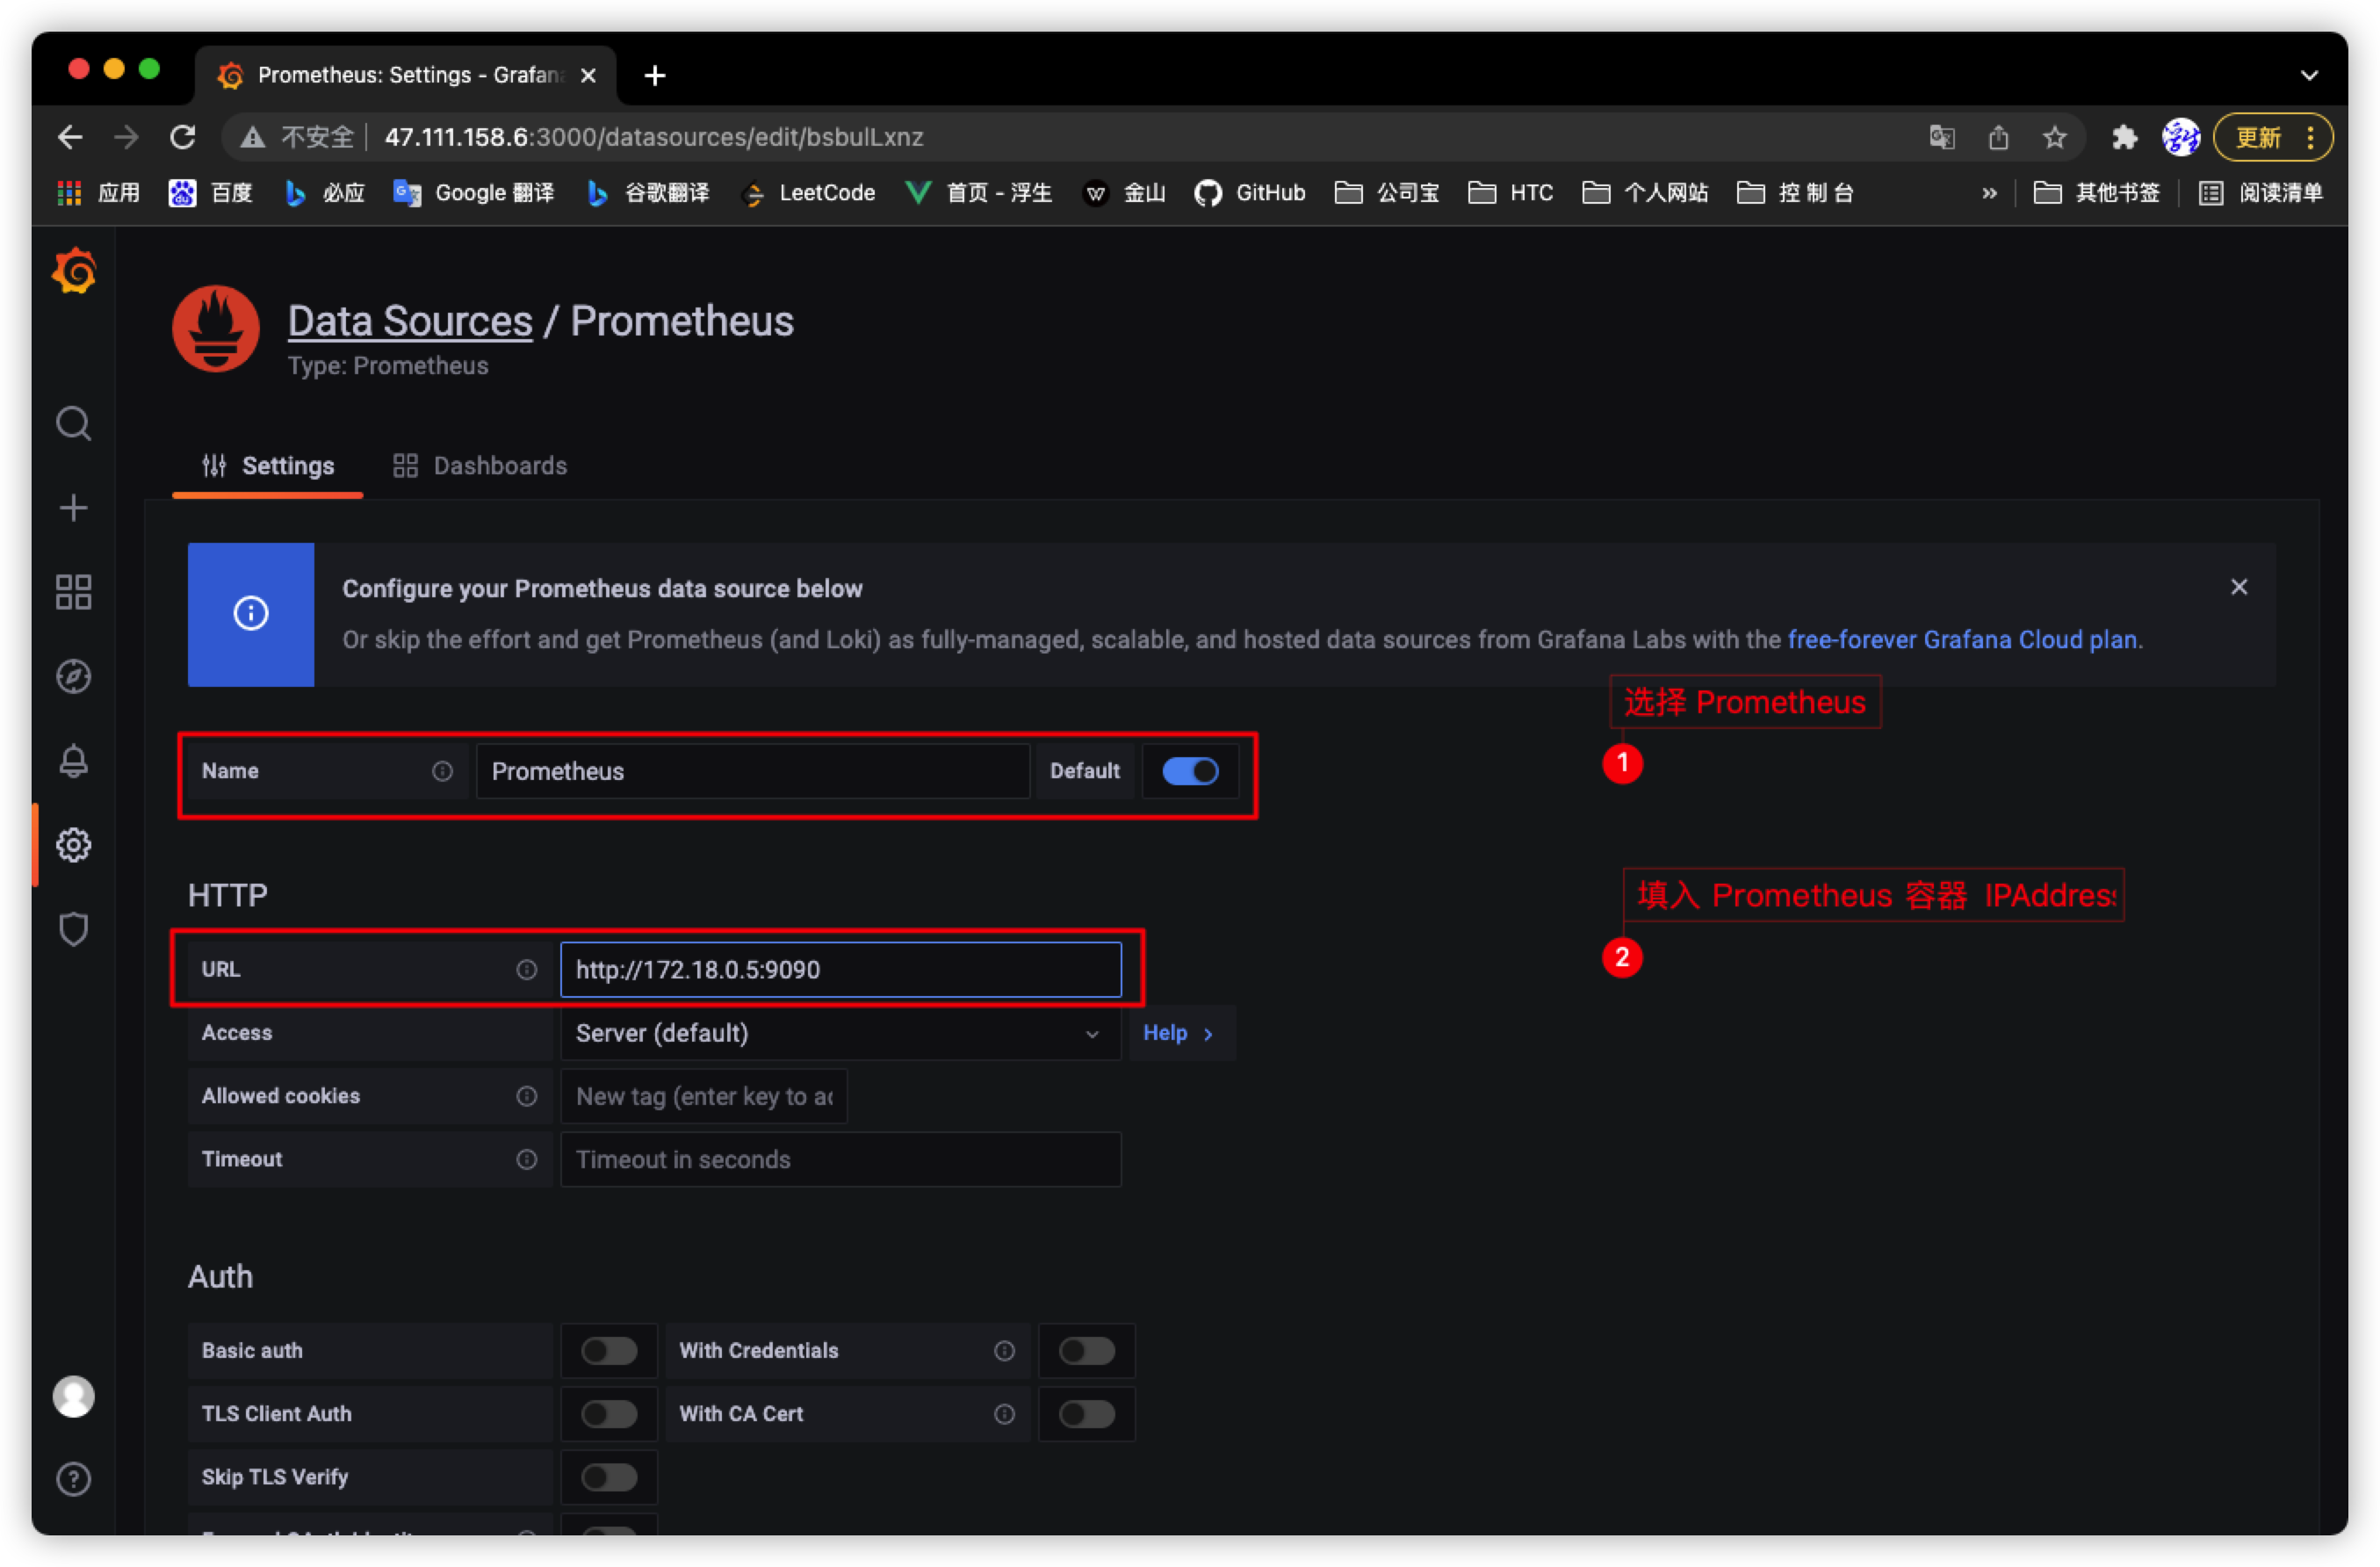
3. Fill in the address information of Prometheus data source
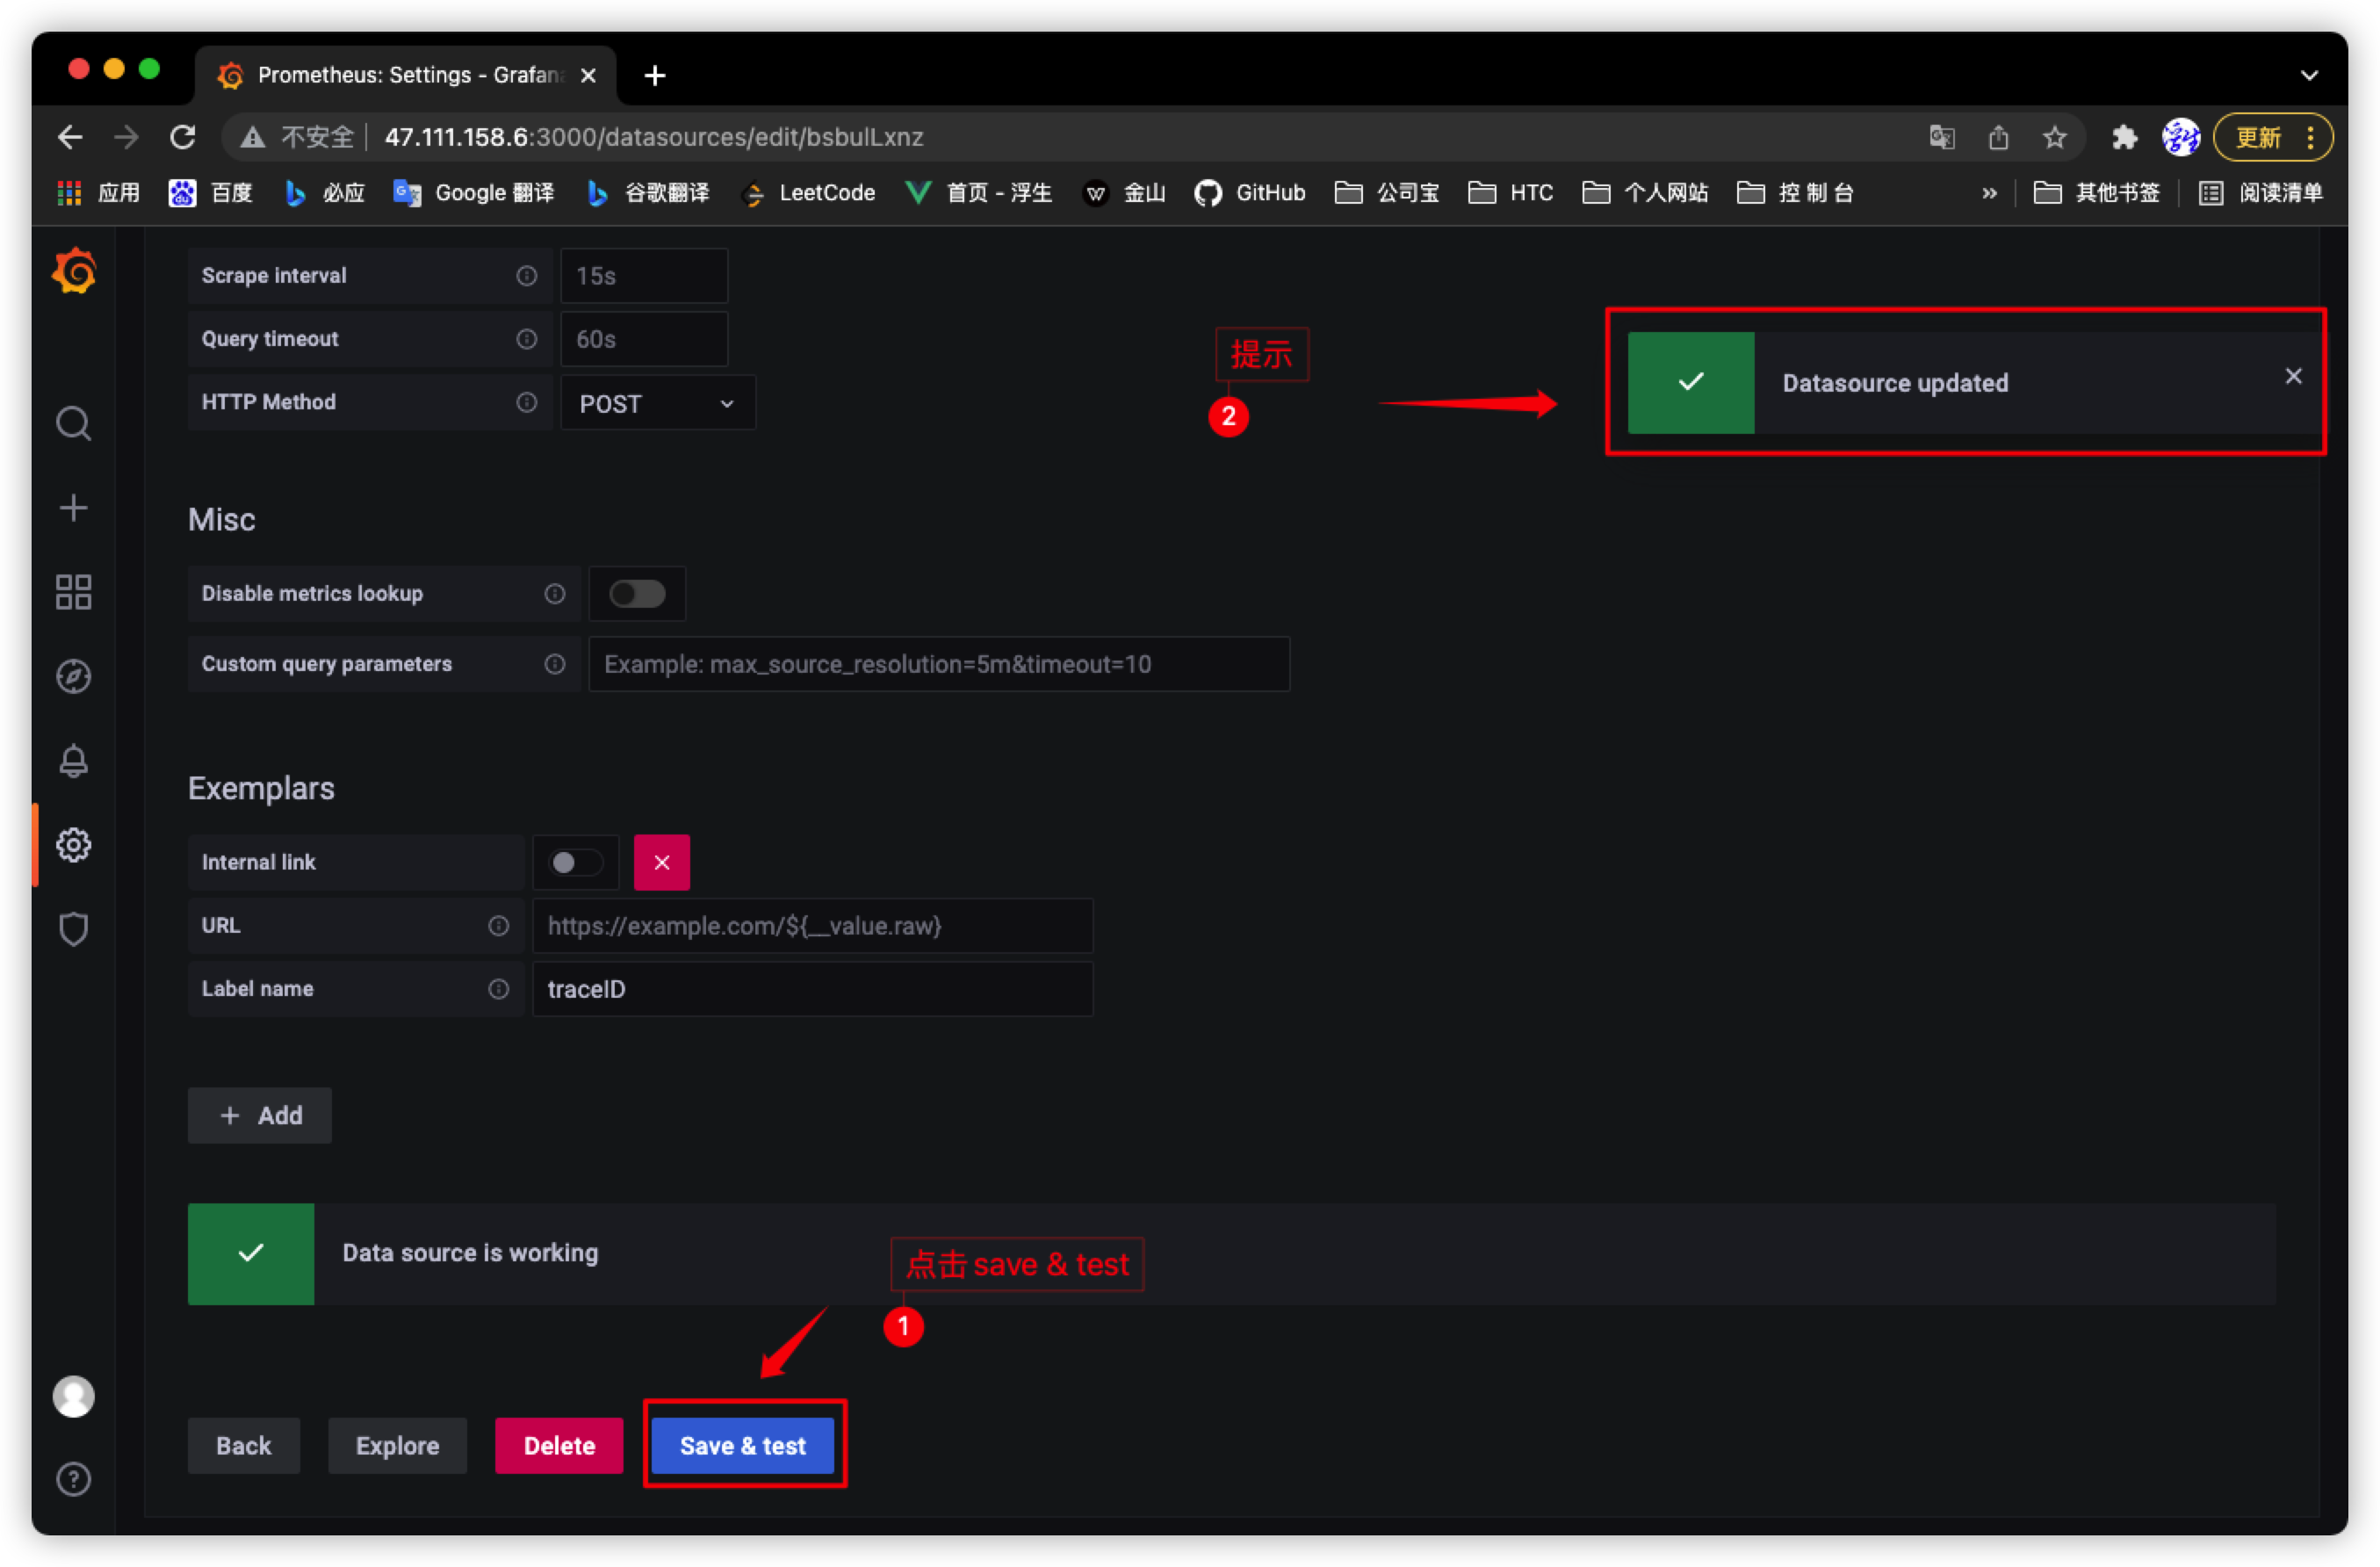
4. Click Save & test to prompt success!
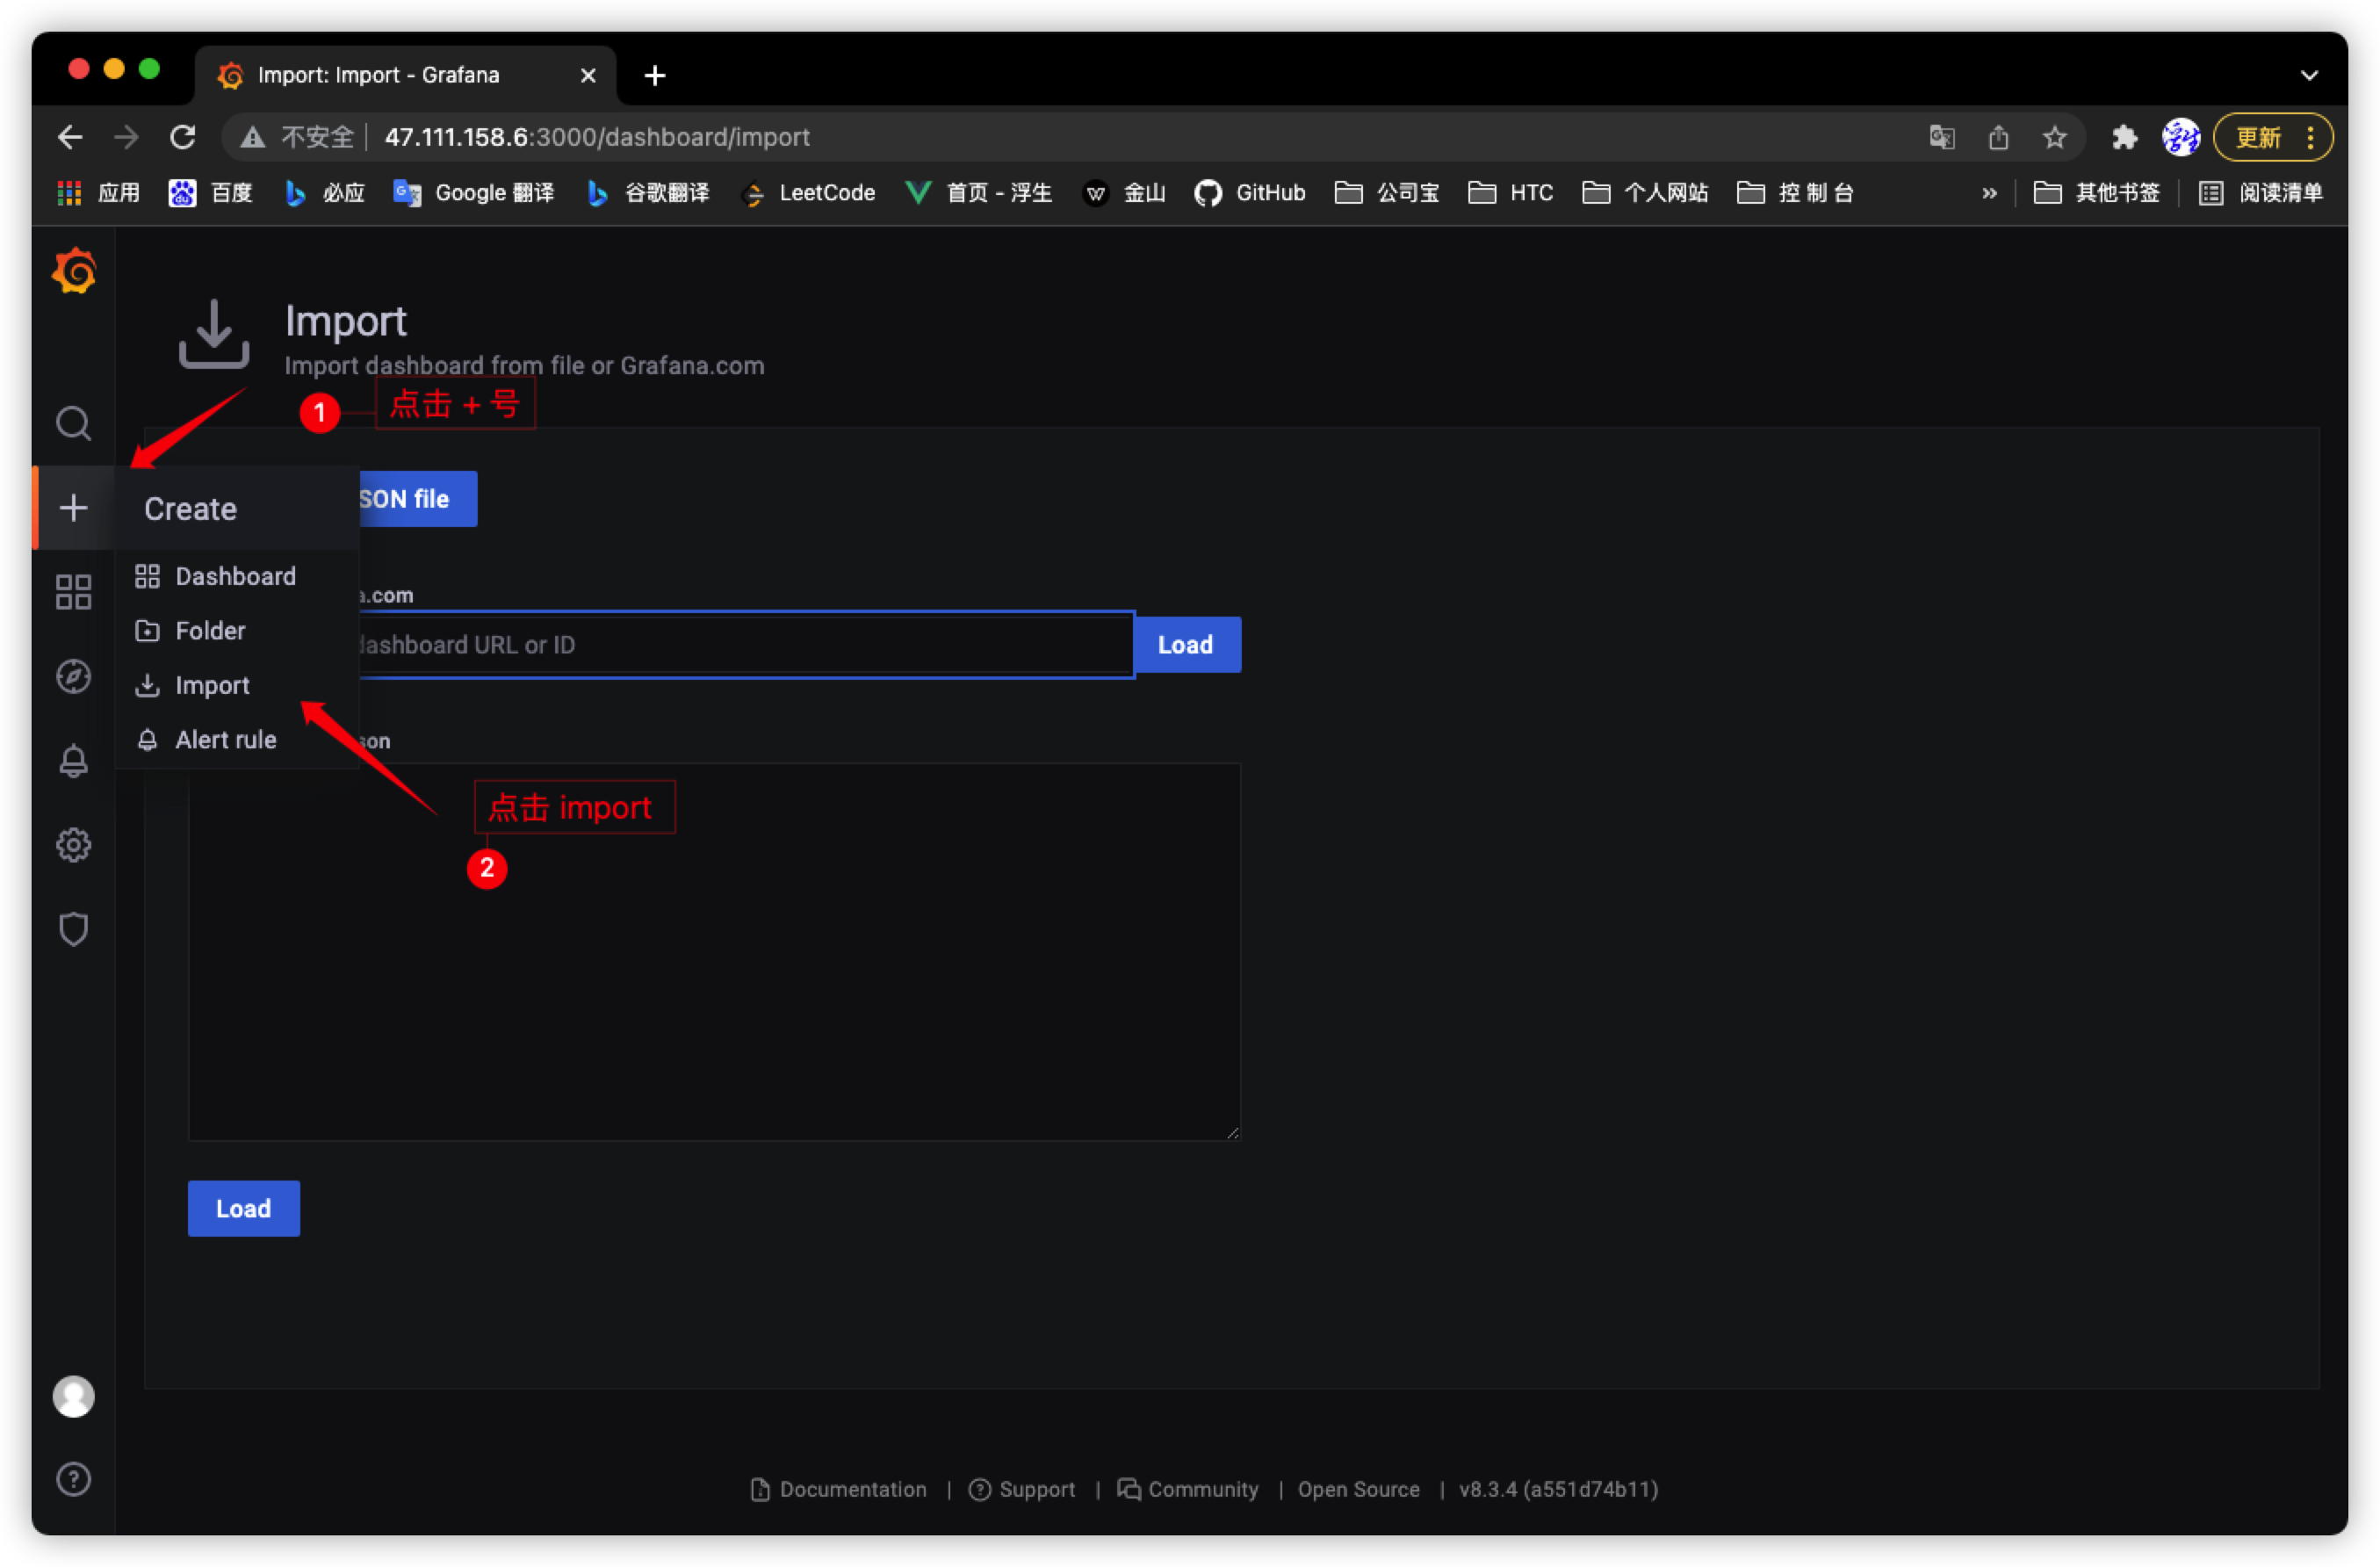
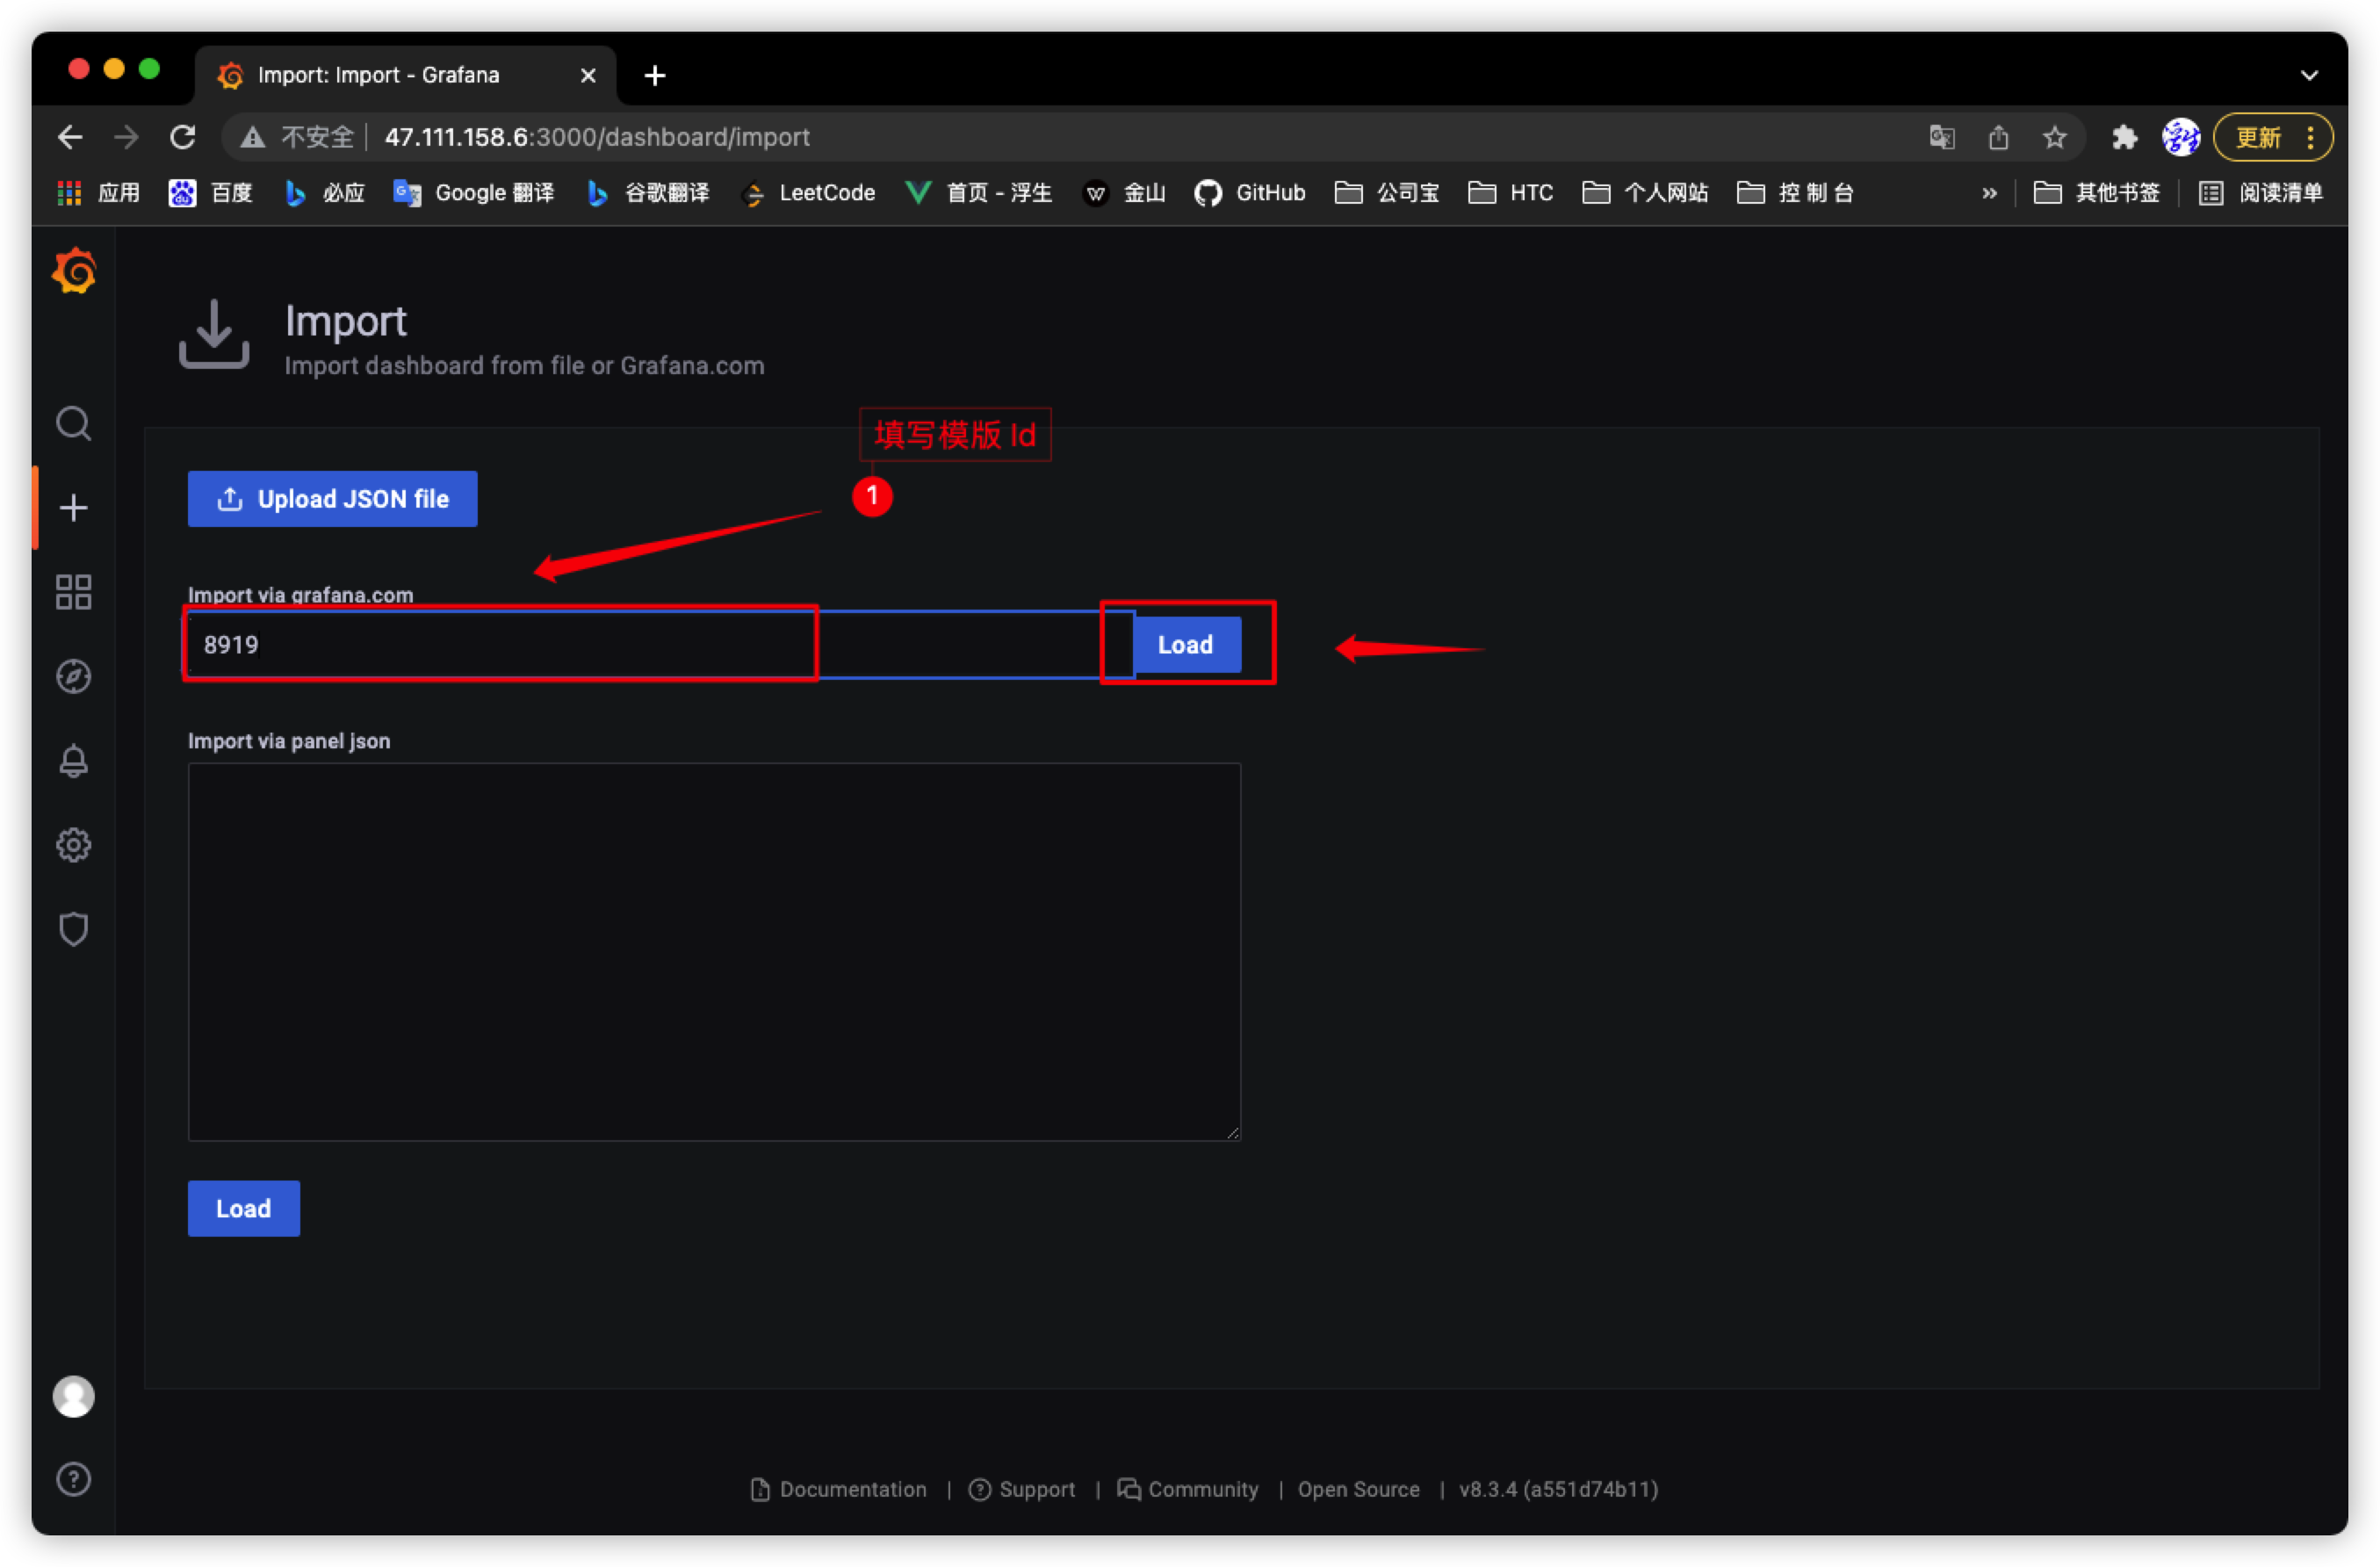
5. Click the + sign and select import to import the Grafana monitoring template
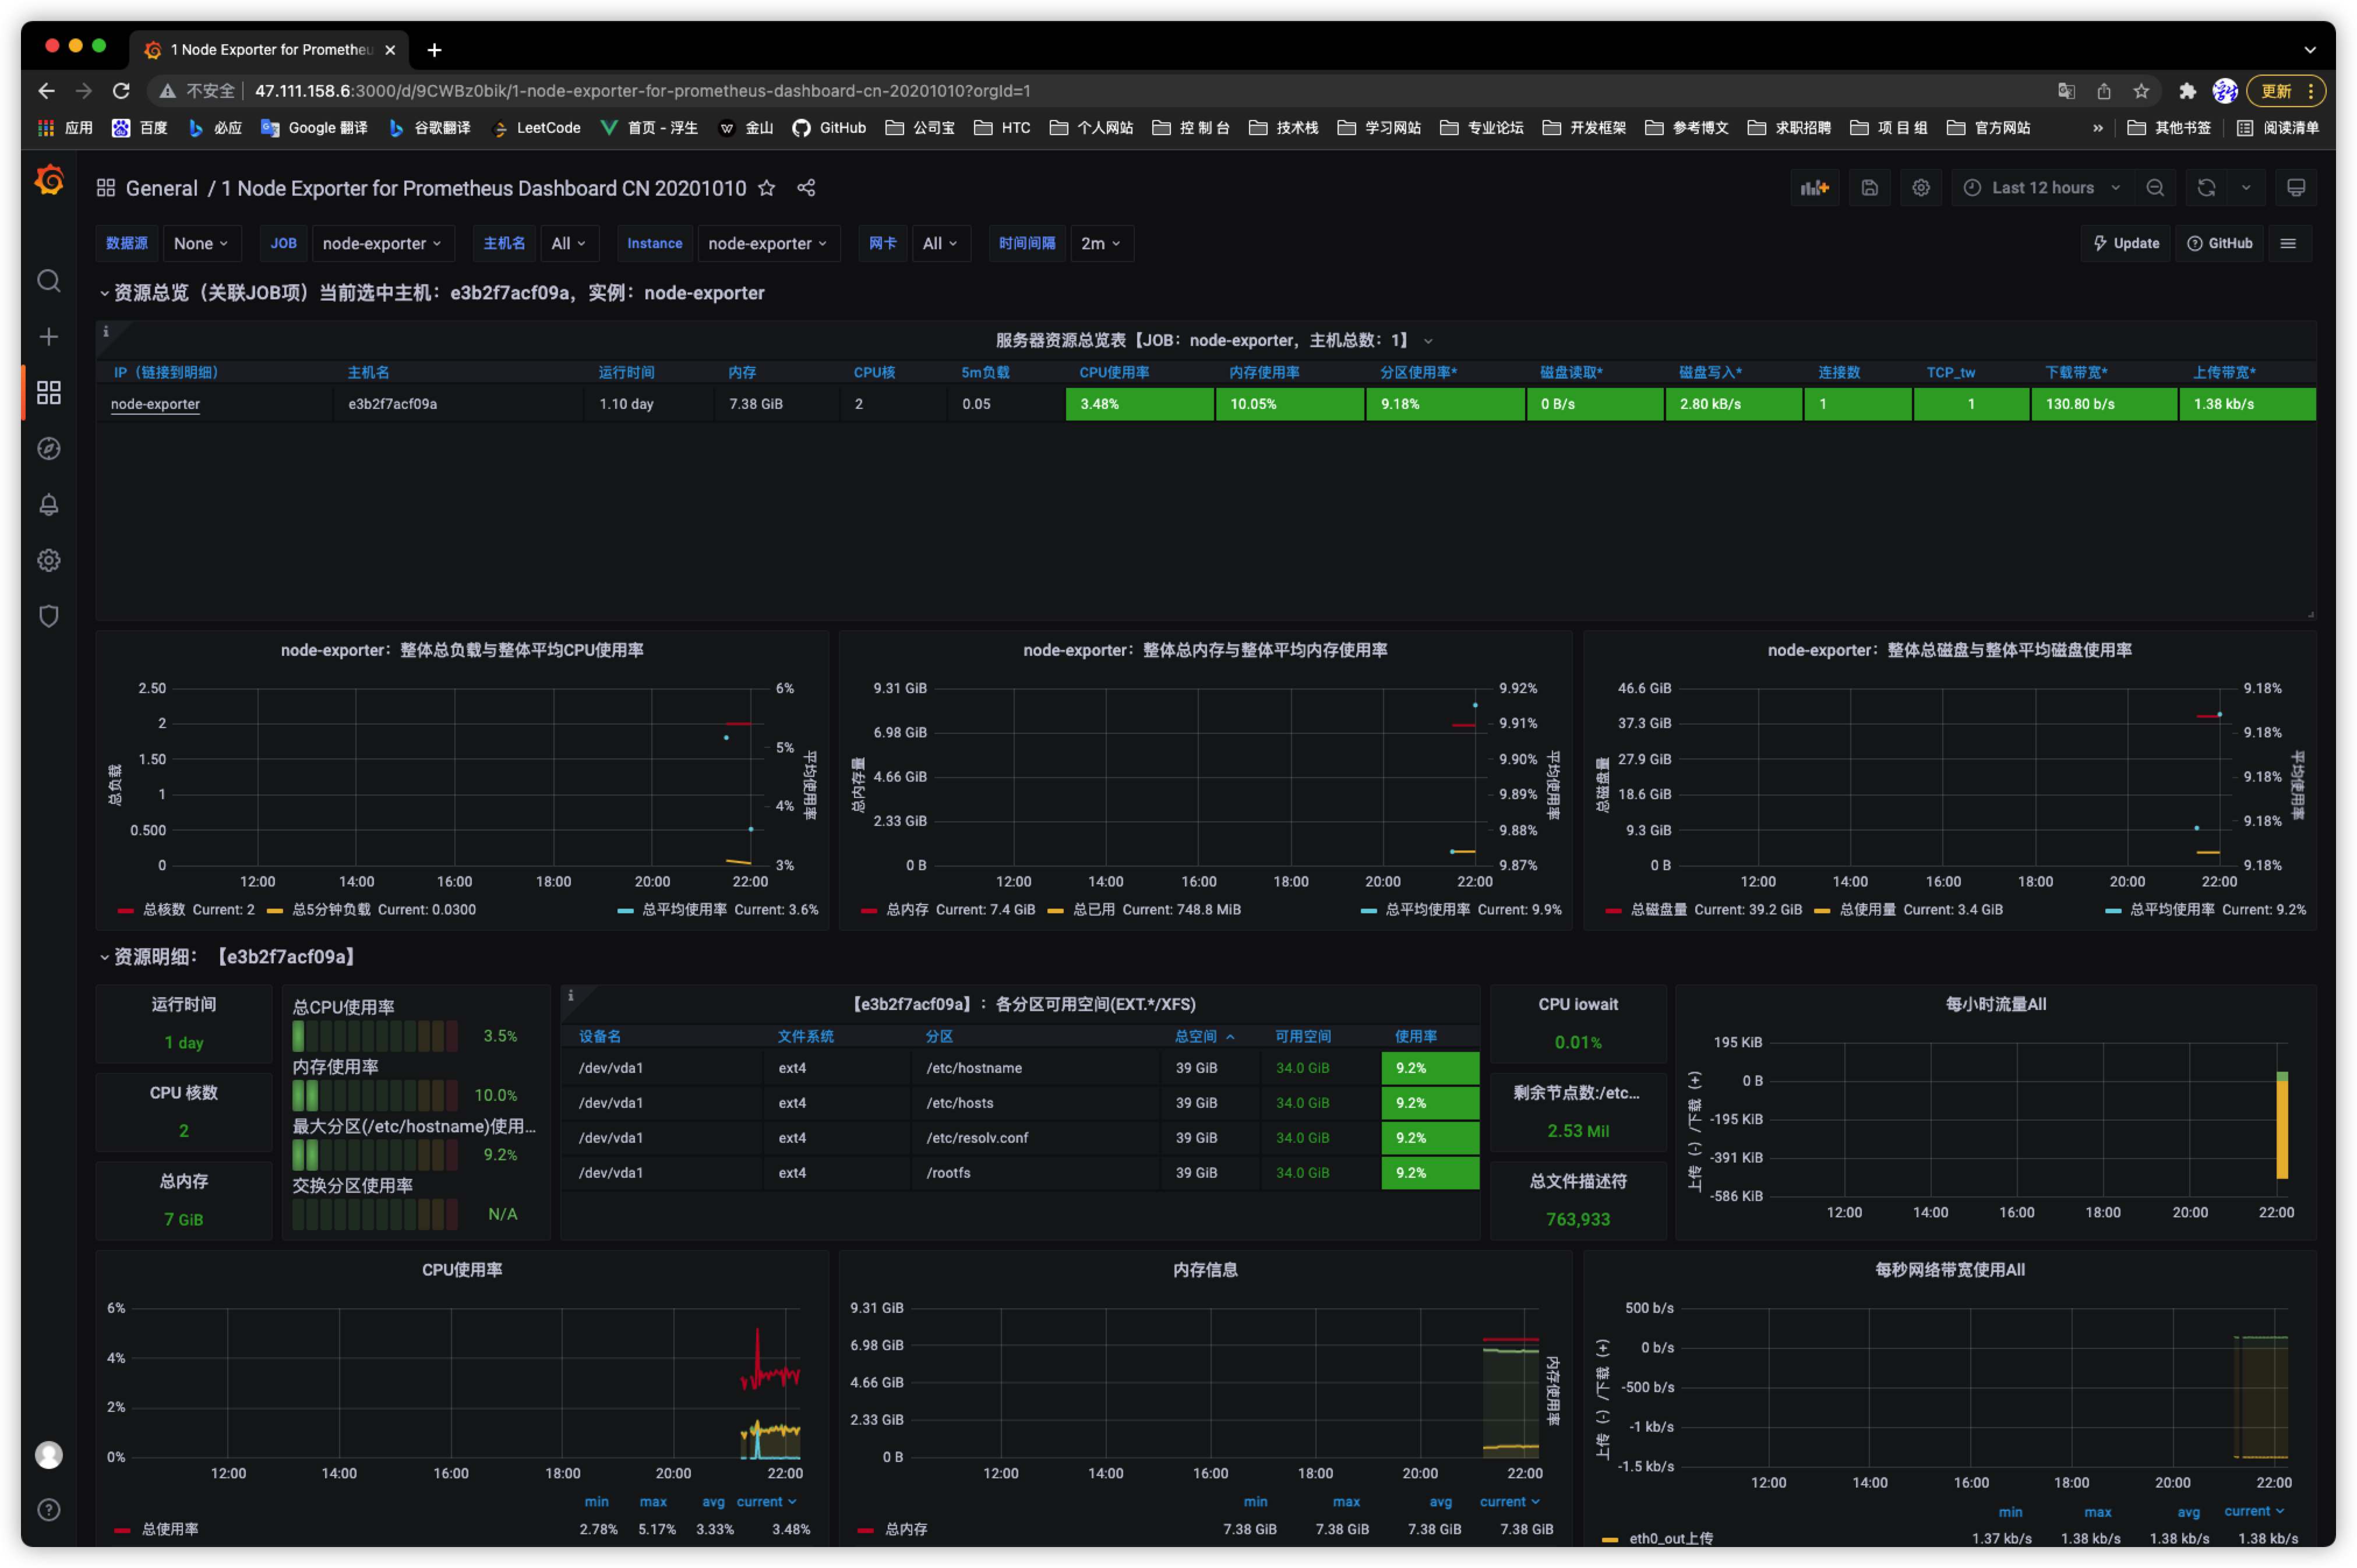
5, Visual monitoring effect display
Linux server system monitoring display (8919)
Docker container monitoring display (179)