Converting time series using Resample function
1, What is the resample function?
It is the method function of the Python data analysis library Pandas.
It is mainly used to convert the frequency of time series. You can do some statistical summary work.
What is the frequency of conversion time series?
For example, the day k and week k of the stock,
If I can only get the data of stock day K, for example, from November 1 to November 5, how can I convert it into K-line in weeks?
| date | cycle | Opening price | Closing price | Highest price | minimum price |
|---|---|---|---|---|---|
| November 1st | Monday | 1.11 | 1.11 | 1.11 | 1.12 |
| November 2nd | Tuesday | 1.12 | 1.12 | 1.11 | 1.12 |
| November 3rd | Wednesday | 1.13 | 1.13 | 1.11 | 1.12 |
| November 4th | Thursday | 1.15 | 1.14 | 1.11 | 1.12 |
| November 5th | Friday | 1.14 | 1.15 | 1.11 | 1.12 |
First of all, we should clarify what is the opening, closing, maximum and minimum of week K. The opening price of each week is the opening price on the first day of the week, and the closing price is the closing price on the last day of the week. Its highest price is the highest price of the week, and the lowest price is the lowest of all the lowest prices of the week. So you go to the stock trading platform. Its weekly K is recorded on Friday's trading day. The opening, closing, maximum and minimum are calculated according to the rule I just explained. The selection rules for month K and year K are the same. The cycle of month K is one month, and the cycle of year K is one year.
The accuracy of this calculation can also be verified by online data. This calculation rule includes the calculation of opening, closing, maximum and minimum, and clean up what the resample function can do. In addition, resample also has a function of statistical summary. For example, if I want to calculate the total weekly trading volume of a stock, I can use resample Sum function to add up the trading volume from Monday to Friday.
In order to facilitate your memory, you can also understand resample as the pivot table function in Excel. You can do various screening and summary statistics according to the date. The most important thing is that he can follow the date.
2, Actual Resample function
Because these two classes are still some basic parts, there is no modular content.
We will do real modular work when creating stock database. So far, it is in the form of primary script. Say it in advance.
1. Convert day K to week K
1.1 function document learning
Google search Pandas Resample: the first link is the official document of this function
https://pandas.pydata.org/pandas-docs/stable/reference/api/pandas.DataFrame.resample.html
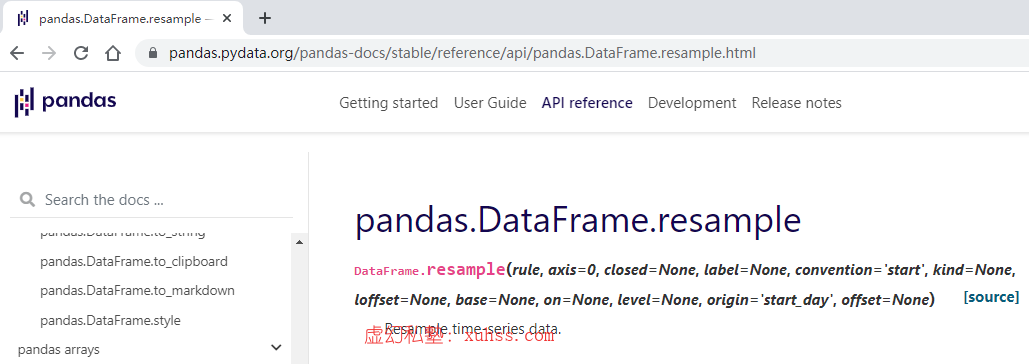
Here is an introduction: Resample belongs to the following methods of Pandas DataFrame. Here is an explanation of the parameters.
Here we only explain two common parameters, one is rule and the other is closed.
- rule indicates what kind of cyclical indicator you put in it. m stands for Month, Y for year and W for Week,
- Closed means which boundary you choose. For example, if I convert day k into week k, do I take Monday or Friday as the boundary? This is determined by closed.
Here are some examples:
>>>index = pd.date_range('1/1/2000', periods=9, freq='T')
>>>series = pd.Series(range(9), index=index)
>>>series
2000-01-01 00:00:00    0
2000-01-01 00:01:00    1
2000-01-01 00:02:00    2
2000-01-01 00:03:00    3
2000-01-01 00:04:00    4
2000-01-01 00:05:00    5
2000-01-01 00:06:00    6
2000-01-01 00:07:00    7
2000-01-01 00:08:00    8
Freq: T, dtype: int64
Here, we first create a time series DataFrame, which is the series variable. You can understand that it is a table style with only one field. Then look down:
>>>series.resample('3T').sum()
2000-01-01 00:00:00     3
2000-01-01 00:03:00    12
2000-01-01 00:06:00    21
Freq: 3T, dtype: int64
The Resample method is used here. 3T is 3 minutes, and T represents minutes. sum() is summary, that is to summarize this column of data.
In other words, statistics are made every three minutes. Note that the value of the time summarized in this time series is the first minute of 3 minutes. If I want to take the last minute of the time period, I can change the value of label to "right":
>>>series.resample('3T', label='right').sum()
2000-01-01 00:03:00     3
2000-01-01 00:06:00    12
2000-01-01 00:09:00    21
Freq: 3T, dtype: int64
1.2 actual combat
Get the real data of day K:
#Get day k
df = get_price("000001.XSHG", end_date='2021-05-30 14:00:00',count=20, frequency='1d', fields=['open','close','high','low','volume','money'])
print(df)
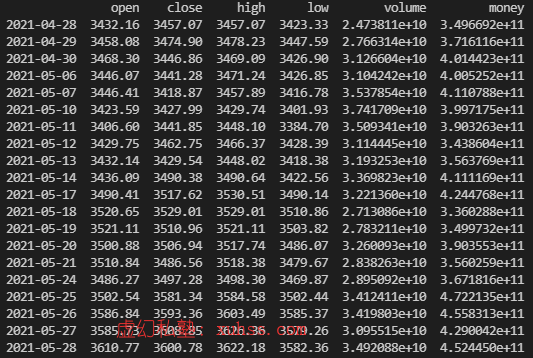
You can see that all the data from April 28 to May 28 have been obtained. In order to make it easier to understand, we add another column of data, that is, the column in which the current date is the day of the week.
#Get day k
df = get_price("000001.XSHG", end_date='2021-05-30 14:00:00',count=20, frequency='1d', fields=['open','close','high','low','volume','money'])
df['weekday']=df.index.weekday
print(df)
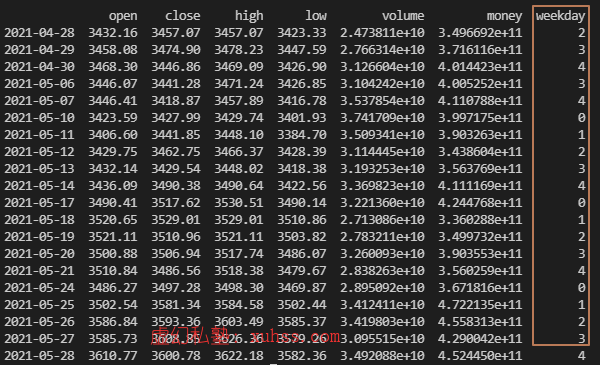
Here 0 stands for Monday. How to convert it to statistics by "week"
#Get week k
import pandas as pd
df_week = pd.DataFrame()
df_week = df['open'].resample('W').first()
print(df_week)
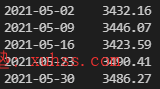
You can see that 2021-05-30 here is the last day of a week. Its corresponding opening price is indeed this figure. It shows that the weekly K data we calculated is correct.
The closing price is the data on the last day of the closing price of each week.
The highest price is the maximum closing price per week.
The lowest price is the minimum of the weekly closing price.
#Get week k
import pandas as pd
df_week = pd.DataFrame()
df_week['open'] = df['open'].resample('W').first()
df_week['close'] = df['close'].resample('W').last()
df_week['high'] = df['high'].resample('W').max()
df_week['low'] = df['low'].resample('W').min()
print(df_week)
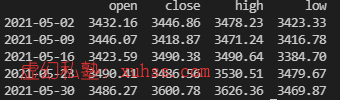
Compared with the data, close is the data of the closing price on the last day. High is the daily high price of the current week. low is the daily lowest price of the current week.
We can convert the data of day K into the data of week K in less than 10 lines of code.
2. Summary statistics function (Statistics of monthly trading volume and turnover)
Aggregate trading volume and turnover
I want to convert volume and money into total volume and total turnover
#Get week k
import pandas as pd
df_week = pd.DataFrame()
df_week['open'] = df['open'].resample('W').first()
df_week['close'] = df['close'].resample('W').last()
df_week['high'] = df['high'].resample('W').max()
df_week['low'] = df['low'].resample('W').min()
df_week['volume(sum)'] = df['volume'].resample('W').sum()
df_week['money(sum)'] = df['money'].resample('W').sum()
print(df_week)
3. Day K is converted to month K
Suppose I have one year's data, how should I convert it to month K?
Only two changes are needed:
- Add start_date gets the data of a whole year
- Change the parameter of resample to M, where M stands for Month
#Get day k
df = get_price("000001.XSHG", end_date='2021-05-30 14:00:00', start_date='2020-05-30', frequency='1d', fields=['open','close','high','low','volume','money'])
df['weekday']=df.index.weekday
print(df)

#Get week k
import pandas as pd
df_week = pd.DataFrame()
df_week['open'] = df['open'].resample('M').first()
df_week['close'] = df['close'].resample('M').last()
df_week['high'] = df['high'].resample('M').max()
df_week['low'] = df['low'].resample('M').min()
print(df_week)