Recently, we need to display the deep learning network structure diagram on the front end in a more intuitive form. For data transmission, we plan to use the form of data path flow, because I haven't learned much about the front end. I feel that there will be many problems after I write js and css code. The beauty of the front end display and adaptive window size, The adaptation of component location is a problem. After searching the relevant tutorial recommendations, I found that the antv/X6 plug-in developed by Ali is used to make flow charts and network structure diagrams, which still has good results. Here are some of my learning operations according to the tutorial:
Start using
Next, let's create the simplest start -- > end application.
Step 1 create container
Create a container in the page to hold X6 drawings, which can be a div tag.
<html>
<head>
    <style type="text/css">
        .expa {
            width: 400px;
            height: 400px;
            //Show border
            border: 3px solid #F00;
            margin: 0 auto;
        }
    </style>
</head>
<body>
    <div class="expa" id="container"></div>
</body>
</html>
Step 2 prepare data
X6 supports JSON format data. The object needs to have node nodes and edge edges fields, which are represented by arrays respectively:
<script>
	const data = {
            // node
        nodes: [
            {
                id: 'node1', // String, optional, unique identifier of the node
                x: 100, // Number, required, the x value of the node position
                y: 100, // Number, required, y value of node position
                width: 80, // Number, optional, the width value of the node size
                height: 40, // Number, optional, height value of node size
                label: 'start', // String, node label
        	},
        	{
                id: 'node2', // String, the unique identifier of the node
                x: 200, // Number, required, the x value of the node position
                y: 200, // Number, required, y value of node position
                width: 80, // Number, optional, the width value of the node size
                height: 40, // Number, optional, height value of node size
                label: 'end', // String, node label
             },
        ],
        // edge
        edges: [{
            source: 'node1', // String, required, starting node id
            target: 'node2', // String, required, target node id
        }, ],
    };
</script>
Step 3 render canvas
First, we need to create a Graph object and assign it a drawing container on the page, usually specifying the size of the canvas. I have specified the size of the container before, so I don't need to specify it again
//Use npm to install x6, and then refer to the following form, which can be used in vue
import { Graph } from '@antv/x6';
const graph = new Graph({
  container: document.getElementById('container'),
  //width: 800,
  //height: 600,
});
I use the introduction form of js file, which is relatively easy to operate on html pages
<script src="https://unpkg.com/@antv/x6/dist/x6.js"></script>
<script>
  const graph = new X6.Graph({
    container: document.getElementById('container'),
    //width: 800,
    //height: 600,
  });
</script>
Then, we can use the graph we just created to render our nodes and edges.
graph.fromJSON(data)
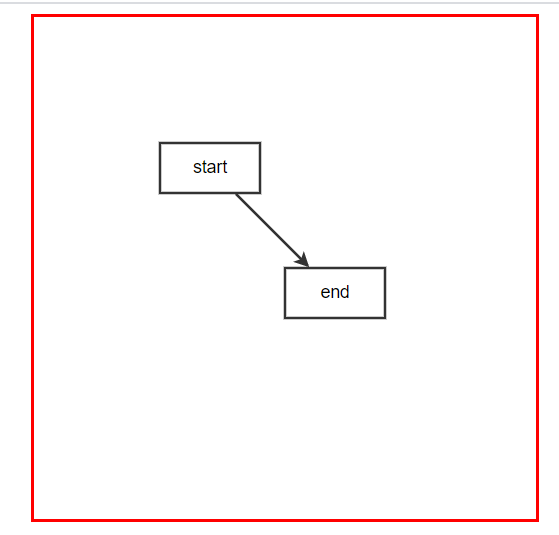
Get the following figure:
Cancel the movement of nodes
At this time, the node can be moved. Sometimes we don't want it to move. We can use the following code:
const graph = new X6.Graph({
    container: document.getElementById('container'),
    // width: 400,
    // height: 400,
    interacting: {
    	nodeMovable: false,
    }
});
Render nodes using different shapes
In the above example, we used the default graph rect to render nodes. In addition, we also built circle, ellipse, polygon and so on in X6 Basic graphics , you can specify the rendered shape for the node through the shape attribute. If you are not familiar with SVG graphics, you can refer to SVG image tutorial
const data = {
            // node
            nodes: [{
                    id: 'node1', // String, optional, unique identifier of the node
                    x: 100, // Number, required, the x value of the node position
                    y: 100, // Number, required, y value of node position
                    width: 80, // Number, optional, the width value of the node size
                    height: 40, // Number, optional, height value of node size
                    label: 'start', // String, node label
                },
                {
                    id: 'node2', // String, the unique identifier of the node
                    shape:'ellipse',
                    x: 200, // Number, required, the x value of the node position
                    y: 200, // Number, required, y value of node position
                    width: 80, // Number, optional, the width value of the node size
                    height: 40, // Number, optional, height value of node size
                    label: 'end', // Node, label, String
                },
            ],
            // edge
            edges: [{
                source: 'node1', // String, required, starting node id
                target: 'node2', // String, required, target node id
            }, ],
        };
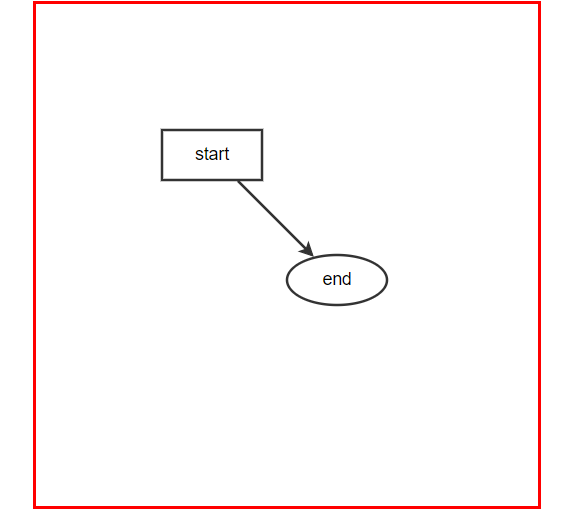
The effect is as follows:
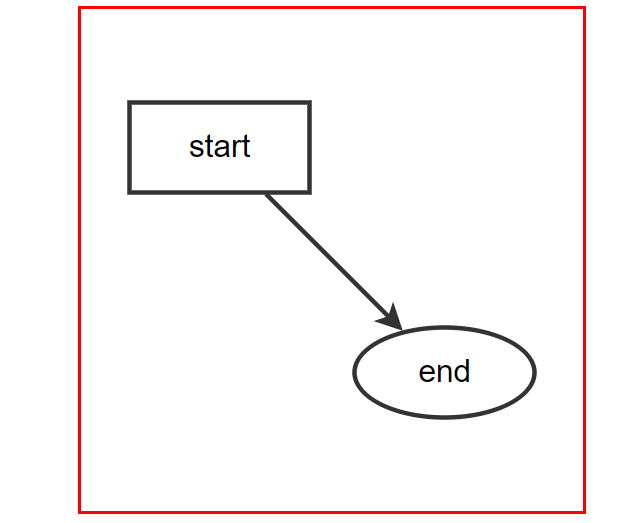
Center and zoom canvas
When the factor is positive, it means that the canvas is enlarged, and when the factor is negative, it means that the canvas is reduced.
Here, the factor value is 0.8 and the canvas is enlarged
graph.centerContent() //Center canvas
graph.zoom(0.8)//Canvas zoom
Modify edge style
Change edge to dashed line:
edges: [{
    source: 'node1', // String, required, starting node id
    target: 'node2', // String, required, target node id
    attrs: {
        line: {
            stroke: '#1890ff',
            strokeDasharray: 5,
            targetMarker: 'classic',
    	}
    },
 }, ],
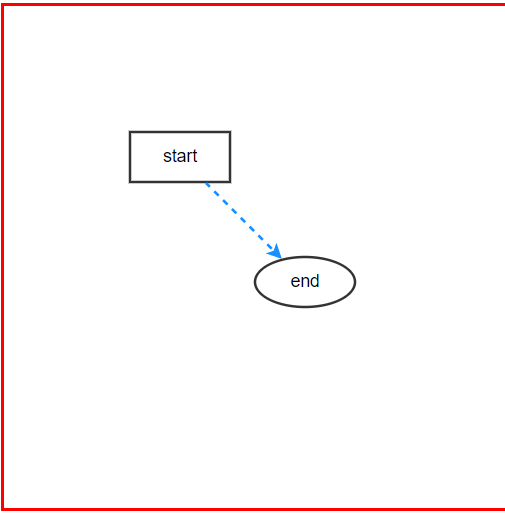
Add flow effect to dotted line
In order to add flow effect to the dotted line, I'm steaming hard. The official tutorial gives ts code. There are always problems in using it. Alas, it's still my own dish, and it's not a rookie. You should learn more!
Use style style to realize the flow effect of lines
edges: [{
        source: 'node1', // String, required, starting node id
        target: 'node2', // String, required, target node id
        attrs: {
            line: {
                stroke: '#1890ff',
                strokeDasharray: 5,
                targetMarker: 'classic',
                style: {
                	animation: 'ant-line 30s infinite linear',
                },
            }
        },
}, ],
<style>
  @keyframes ant-line {
    to {
      stroke-dashoffset: -1000
    }
  }
</style>
The code effect is shown in the figure below:
Modify the attributes of nodes and edges
//Get all the nodes and edges of the canvas
const nodes = graph.getNodes()
const edges = graph.getEdges()
//Modify the properties of no node
nodes.forEach((node) => {
    node.attr(
            'body',
            {
                stroke: '#1890ff ', / / node color
                fill: 'white'//Node fill color
    		}
   	)
    node.attr('label', {
            // text: 'rect', / / text
            // fill: '#333', / / text color
            // fontSize: 13, / / text size
    	})
    node.resize(40, 20) //Reset node size
})
edges.forEach((edge) => {
    edge.attr('line', {
        stroke: '#1890ff ', / / edge color
        strokeDasharray: 5,//Edge line thickness
        targetMarker: 'classic',
        style: {
        	animation: 'ant-line 30s infinite linear',
        },
    })
})
The modified effect drawing is as follows:
Mouse hover highlight
graph.on('node:mouseenter',
	({node}) => {
        node.attr('body', {
        stroke: 'orange',
        fill: 'orange'
    })
})
The effect is as follows:
The complete code is as follows:
<!DOCTYPE html>
<html>

<head>
    <meta charset="utf-8">
    <title>Network visualization</title>
    <meta name="keywords" content="HTML,CSS,XML,JavaScript">
    <meta name="author" content="anliu">
    <meta http-equiv="refresh" content="60">
    <!-- <script src="./x6.js"></script> -->
    <script src="https://unpkg.com/@antv/x6/dist/x6.js"></script>
    <style type="text/css">
        .expa {
            width: 400px;
            height: 400px;
            border: 3px solid #F00;
            margin: 0 auto;
        }

        @keyframes ant-line {
            to {
                stroke-dashoffset: -1000
            }
        }
    </style>
</head>

<body>
    <div class="expa" id="container"></div>
    <script>
        const data = {
            // node
            nodes: [{
                    id: 'node1', // String, optional, unique identifier of the node
                    x: 100, // Number, required, the x value of the node position
                    y: 100, // Number, required, y value of node position
                    width: 80, // Number, optional, the width value of the node size
                    height: 40, // Number, optional, height value of node size
                    label: 'start', // String, node label
                },
                {
                    id: 'node2', // String, the unique identifier of the node
                    shape: 'ellipse',
                    x: 200, // Number, required, the x value of the node position
                    y: 200, // Number, required, y value of node position
                    width: 80, // Number, optional, the width value of the node size
                    height: 40, // Number, optional, height value of node size
                    label: 'end', // String, node label
                },
            ],
            // edge
            edges: [{
                source: 'node1', // String, required, starting node id
                target: 'node2', // String, required, target node id
                attrs: {
                    line: {
                        stroke: '#1890ff',
                        strokeDasharray: 5,
                        targetMarker: 'classic',
                        style: {
                            animation: 'ant-line 30s infinite linear',
                        },
                    }
                },
            }, ],
        };
        const graph = new X6.Graph({
            container: document.getElementById('container'),
            // width: 400,
            // height: 400,
            interacting: {
                nodeMovable: false,
            }
        });

        graph.fromJSON(data)

        function reset() {
            const nodes = graph.getNodes()
            const edges = graph.getEdges()
            nodes.forEach((node) => {
                node.attr(
                    'body', {
                        stroke: '#1890ff',
                        fill: 'white'
                    })
                node.attr('label', {
                    // text: 'rect', / / text
                    // fill: '#333', / / text color
                    // fontSize: 13, / / text size
                })
                node.resize(40, 20)
            })
            edges.forEach((edge) => {
                edge.attr('line', {
                    stroke: '#1890ff',
                    strokeDasharray: 5,
                    targetMarker: 'classic',
                    style: {
                        animation: 'ant-line 30s infinite linear',
                    },
                })
            })
        }
        reset()
        graph.centerContent()
        graph.zoom(0.5)

        graph.on('node:mouseenter', ({
            node
        }) => {
            node.attr('body', {
                stroke: 'orange',
                fill: 'orange'
            })
        })
        graph.on('node:mouseleave', ({
            node
        }) => {
            reset()
        })
    </script>
</body>
</html>
If you plan to use the code in vue, you only need to modify a small number of code statements, which is very convenient!