A memory leak occurs when an application allocates memory for an object and the object is not released when it is no longer used. Over time, the leaked memory will accumulate, resulting in poor application performance or even crash. Leaks can occur on any program and platform, but due to the complexity of the activity life cycle, this situation is particularly common in Android applications. The latest Android modes, such as ViewModel and lifecycle observer, can help avoid memory leaks, but if you follow the old mode or don't know what to pay attention to, it's easy to miss errors.
Common examples
Reference long-running services
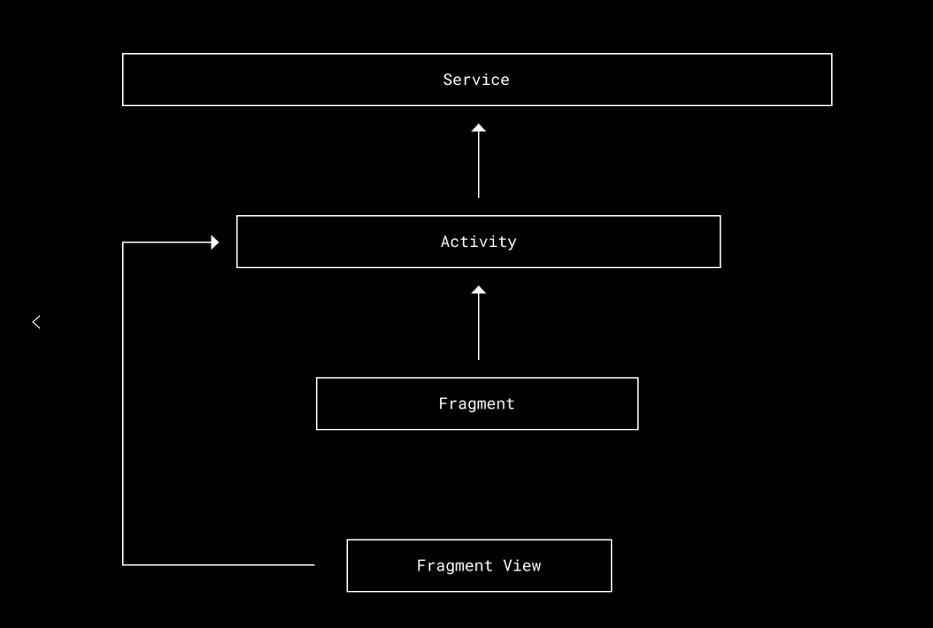
Fragment refers to an activity that refers to a long-running service
In this case, we have a standard setting. The activity holds a reference to a long-running service, and then the Fragment and its view hold a reference to the activity. For example, suppose the activity somehow creates a reference to its child Fragment. Then, as long as the activity continues, the Fragment will continue to exist. Then a memory leak occurs between the Fragment's onDestroy and the active onDestroy.
The Fragment will never be used again, but it will always be in memory
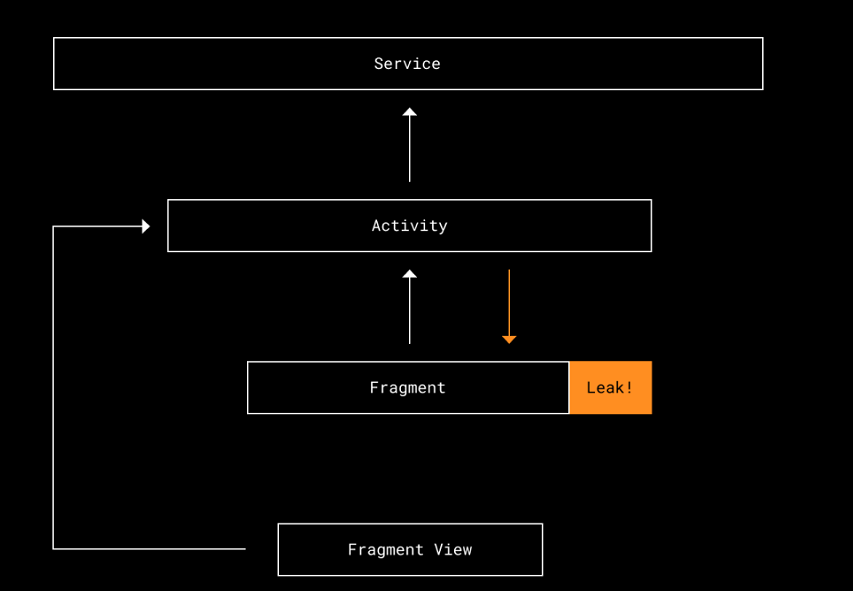
The long-running service references the Fragment view
On the other hand, what if the service gets a reference to the Fragment view?
First, the view will now remain active for the entire duration of the service. In addition, because the view holds a reference to its parent activity, the activity is now also exposed.
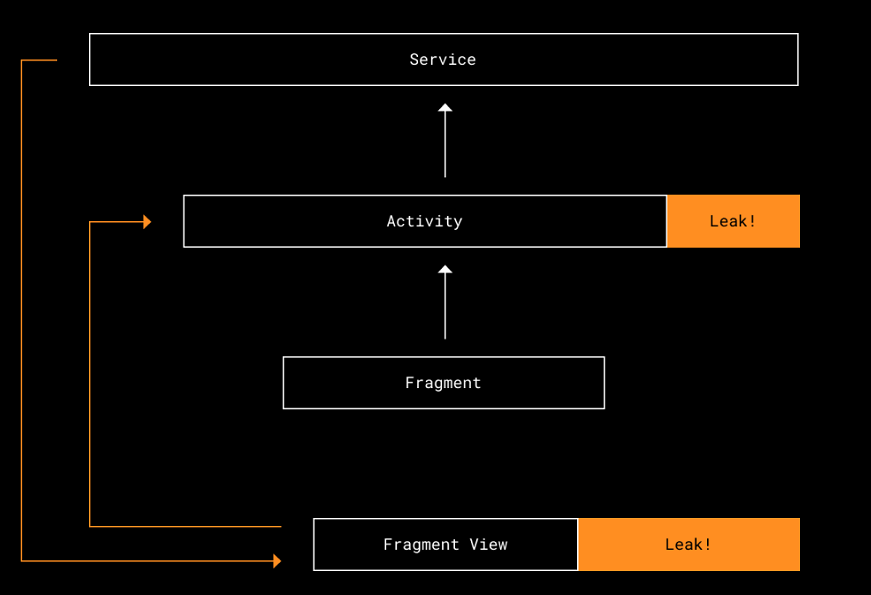
As long as the service exists, FragmentView and Activity will waste memory
Detect memory leaks
Now we know how memory leaks happen. Let's discuss how to detect them. Obviously, the first step is to check whether your application will crash due to OutOfMemoryError. Unless a single screen takes up more memory than the phone can use, there must be a memory leak somewhere.
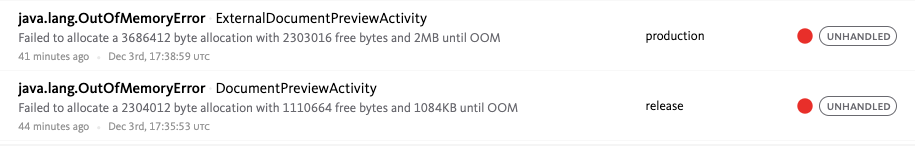
This method only tells you the problems, not the root cause. Memory leaks can occur anywhere, and the recorded crash does not point to the leak, but to the screen that eventually prompts that memory usage exceeds the limit.
You can check all the breadcrumb controls to see if they have some similarities, but it is likely that the culprit is not easy to identify. Let's look at other options.
LeakCanary
LeakCanary is one of the best tools at present. It is a memory leak detection library for Android. All we need to do is add a build Gradle file dependency. The next time we install and run our application, LeakCanary will run with it. As we navigate through the application, LeakCanary pauses occasionally to dump memory and provide traces of detected leaks.
This tool is much better than our previous method. But this process is still manual, and each developer has only a local copy of the memory leak they personally encounter. We can do better!
LeakCanary and Bugsnag
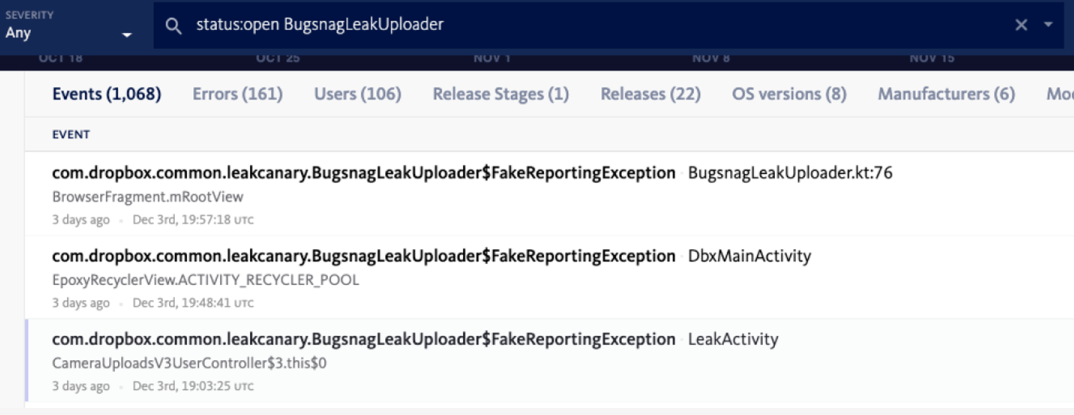
LeakCanary provides a very convenient code recipe for uploading discovered leaks to Bugsnag. We can track memory leaks just as we track any other warnings or crashes in the application. We can even go further and use Bugsnag Integration to connect it to project management software, such as Jira, for better visibility and accountability.
Bugsnag connects to Jira
LeakCanary and integration testing
Another way to improve automation is to connect LeakCanary with CI testing. Similarly, we have a code recipe. The following are from official documents:
LeakCanary provides a component specially used to detect vulnerabilities in UI testing. It provides a run listener, which will wait for the end of the test. If the test is successful, it will find the retained objects, trigger heap dump and perform analysis when necessary.
Note that LeakCanary slows down the test because it dumps the heap every time after the test it listens to ends. In our example, the additional time is negligible due to our selective testing and slicing settings.
Eventually, just like any other build or test failure on a CI, memory leaks are exposed and vulnerability tracking information is recorded.
Running LeakCanary on CI helps us learn better coding patterns, especially when it comes to new libraries, before any code enters the production environment. For example, when we used MvRx test, it found this vulnerability:
<failure>Test failed because application memory leaks were detected: ==================================== HEAP ANALYSIS RESULT ==================================== 4 APPLICATION LEAKS References underlined with "~~~" are likely causes. Learn more at https://squ.re/leaks. 198449 bytes retained by leaking objects Signature: 6bf2ba80511dcb6ab9697257143e3071fca4 ┬───
│ GC Root: System class
│ ├─ com.airbnb.mvrx.mocking.MockableMavericks class
│ Leaking: NO (a class is never leaking)
│ ↓ static MockableMavericks.mockStateHolder
│                            ~~~~~~~~~~~~~~~
├─ com.airbnb.mvrx.mocking.MockStateHolder instance
│ Leaking: UNKNOWN
│ ↓ MockStateHolder.delegateInfoMap
│                   ~~~~~~~~~~~~~~~
├─ java.util.LinkedHashMap instance
│ Leaking: UNKNOWN
│ ↓ LinkedHashMap.header
│                 ~~~~~~
├─ java.util.LinkedHashMap$LinkedEntry instance
│ Leaking: UNKNOWN
│ ↓ LinkedHashMap$LinkedEntry.prv
│                             ~~~
├─ java.util.LinkedHashMap$LinkedEntry instance
│ Leaking: UNKNOWN
│ ↓ LinkedHashMap$LinkedEntry.key
│                             ~~~
╰→ com.dropbox.product.android.dbapp.photos.ui.view.PhotosFragment instance
   Leaking: YES (ObjectWatcher was watching this because com.dropbox.product.android.dbapp.photos.ui.view.PhotosFragment received Fragment#onDestroy() callback and Fragment#mFragmentManager is null)
   key = 391c9051-ad2c-4282-9279-d7df13d205c3
   watchDurationMillis = 7304
   retainedDurationMillis = 2304 198427 bytes retained by leaking objects
   Signature: d1c9f9707034dd15604d8f2e63ff3bf3ecb61f8
It turns out that when writing tests, we didn't clean up the tests correctly. Add a few lines of code to avoid leakage:
   @After
    fun teardown() {
        scenario.close()
        val holder = MockableMavericks.mockStateHolder
        holder.clearAllMocks()
    }
You might wonder: since this memory leak only occurs in testing, is it really that important to fix it? Well, it's up to you! Like code checking, leak detection can tell you when code smells or bad coding patterns occur.
It can help engineers write more robust code -- in this case, we know clearAllMocks(). The severity of the leak and whether it must be repaired are decisions that engineers can make.
For tests that we don't want to run leak detection, we write a simple note:
@Retention(RetentionPolicy.RUNTIME)
@Target({ElementType.METHOD, ElementType.TYPE})
public @interface SkipLeakDetection {
    /**
     * The reason why the test should skip leak detection.
     */
    String value();
}
Our class overrides FailOnLeakRunListener() of LeakCanary:
override fun skipLeakDetectionReason(description: Description): String? {
    return when {
        description.getAnnotation(SkipLeakDetection::class.java) != null ->
            "is annotated with @SkipLeakDetection"
        description.testClass.isAnnotationPresent(SkipLeakDetection::class.java) ->
            "class is annotated with @SkipLeakDetection"
        else -> null
    }
}
A single test or an entire test class can use this annotation to skip leak detection.
Fix memory leaks
Now we've discussed various ways to find and expose memory leaks. Next, let's discuss how to really understand and repair them.
Leak tracking provided by LeakCanary is the most useful tool for diagnosing leaks. Essentially, the leak trace prints out the chain of references associated with the leak object and explains why it is considered a leak.
LeakCanary has good documentation on how to read and use leak tracking. There is no need to repeat it here. Instead, let's review two types of memory leaks that I often deal with myself.
view
We often see views declared as class level variables: private TextView myTextView; Or, more Android code is now being written in Kotlin: private lateinit var myTextView: textview - very common, and we don't realize that these can lead to memory leaks.
Unless references to these fields are eliminated in the onDestroyView of the Fragment (this cannot be done for the lateinit variable), references to these views will exist throughout the life cycle of the Fragment, rather than during the life cycle of the Fragment view as they should be.
One of the simplest scenarios leading to memory leaks is: we are on FragmentA. We navigate to FragmentB, and now FragmentA is on the stack. FragmentA was not destroyed, but FragmentA's view was destroyed. Any view bound to the FragmentA lifecycle is no longer needed, but remains in memory.
In most cases, these leaks are small and will not cause any performance problems or crashes. However, we are more likely to have trouble with views that save objects and data, images, views / data binding, etc.
So, if possible, avoid storing views in class level variables or make sure they are properly cleaned up in onDestroyView.
When it comes to view / data binding, Android's view binding document clearly tells us that fields must be cleared to prevent leakage. The code snippets they provided suggest that we do the following:
private var _binding: ResultProfileBinding? = null
// This property is only valid between onCreateView and
// onDestroyView.
private val binding get() = _binding!!
override fun onCreateView(inflater: LayoutInflater, container: ViewGroup?, savedInstanceState: Bundle?
): View? {
    _binding = ResultProfileBinding.inflate(inflater, container, false)
    val view = binding.root
    return view
}
override fun onDestroyView() {
    super.onDestroyView()
    _binding = null
}
There is a lot of boilerplate code in each Fragment (also, avoid!!, because if the variable is empty, it will throw KotlinNullPointerException. Use explicit null handling instead.) The way to solve this problem is to create a ViewBindingHolder (and DataBindingHolder). The Fragment can be implemented as follows:
interface ViewBindingHolder<B : ViewBinding> {
    var binding: B?
    // Only valid between onCreateView and onDestroyView.
    fun requireBinding() = checkNotNull(binding)
    fun requireBinding(lambda: (B) -> Unit) {
        binding?.let {
            lambda(it)
        }}
    /**
     * Make sure to use this with Fragment.viewLifecycleOwner
     */
    fun registerBinding(binding: B, lifecycleOwner: LifecycleOwner) {
        this.binding = binding
        lifecycleOwner.lifecycle.addObserver(object : DefaultLifecycleObserver {
            override fun onDestroy(owner: LifecycleOwner) {
                owner.lifecycle.removeObserver(this)
                this@ViewBindingHolder.binding = null
            }
        })
    }
}
interface DataBindingHolder<B : ViewDataBinding> : ViewBindingHolder<B>
This provides a simple and clean way for Fragment:
-
Ensure that bindings are provided when required
-
Some code is executed only when the binding is available
-
Automatically clear bindings on onDestroyView
Temporary leakage
These leaks will only exist for a short time. In particular, we encountered a leak caused by the EditTextView asynchronous task. The asynchronous task lasts exactly longer than the default wait time of LeakCanary, so even if the memory is released correctly soon, a leak will be reported.
If you suspect you are experiencing a temporary leak, a good way to check is to use Android Studio's memory analyzer. Once the session is started in the analyzer, the leak can be reproduced step by step, but it takes longer to dump the heap and check. After this additional time, the leak may disappear.
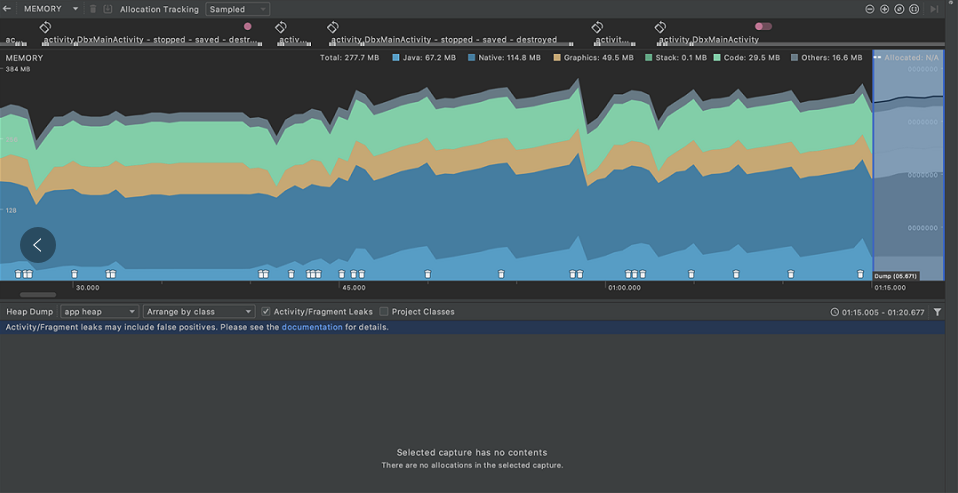
Android Studio's memory analyzer shows the effect of cleaning up temporary leaks
Test frequently and repair as soon as possible
We hope that through this introduction, you can track and solve memory leaks in your own applications! Like many bugs and other problems, it's best to test often and fix bad patterns as soon as possible before they take root in the code base.
As a developer, you must remember that although memory leaks do not always affect application performance, users of low-end models and mobile phones with small memory will appreciate the work you have done for them.
My inventory. Please scan the csdn official QR code below for free