preface
"If you cannot measure it, you cannot improve it".
In daily development, there are many options for calling some code or using tools. When we are not sure about their performance, the first thing we want to do is to measure it. Most of the time, we will simply use multiple counts to measure the total time-consuming of this method.
However, if you are familiar with the JVM class loading mechanism, you should know that the default execution mode of JVM is the mixed execution of JIT compilation and interpretation. Through the statistical analysis of hotspot codes, the JVM identifies the calls of high-frequency methods, loop bodies, common modules, etc. based on JIT dynamic compilation technology, the JVM will convert the hotspot codes into machine codes and directly hand them over to the CPU for execution.
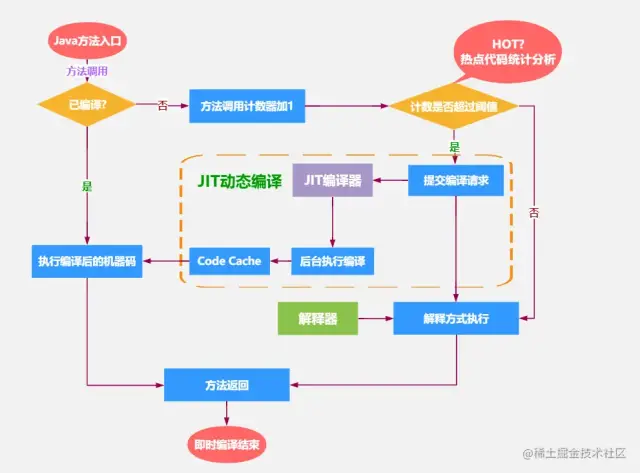
In other words, the JVM will constantly compile and optimize, which makes it difficult to determine how many times to repeat in order to get a stable test result? Therefore, many experienced students will write a warm-up logic before testing the code.
JMH, the full name of which is java Micro Benchmark harness (Micro Benchmark framework), is a set of testing tool API specially used for Java code Micro Benchmark. It is a tool officially released by OpenJDK/Oracle. What is Micro Benchmark? In short, it is a benchmark on the method level, and the accuracy can be accurate to microseconds.
Several points needing attention in Java benchmarking:
- Preheating is required before testing.
- Prevent useless code from entering the test method.
- Concurrent testing.
- Test results are presented.
JMH usage scenarios:
- Quantitative analysis of the optimization effect of a hot spot function
- Want to know quantitatively how long a function needs to be executed and the correlation between execution time and input variables
- Compare multiple implementations of a function
This article mainly introduces JMH DEMO and common annotation parameters. I hope it can help you.
DEMO demo
Here's a DEMO first, so that students who don't know JMH can quickly master the general usage of this tool.
1. Test project construction
JMH is built-in Java 9 and later. This is illustrated by Java 8.
For convenience, here is a direct introduction to how to use maven to build JMH test projects.
The first is to use the command line to build and execute the following commands in the specified directory:
$ mvn archetype:generate \
          -DinteractiveMode=false \
          -DarchetypeGroupId=org.openjdk.jmh \
          -DarchetypeArtifactId=jmh-java-benchmark-archetype \
          -DgroupId=org.sample \
          -DartifactId=test \
          -Dversion=1.0
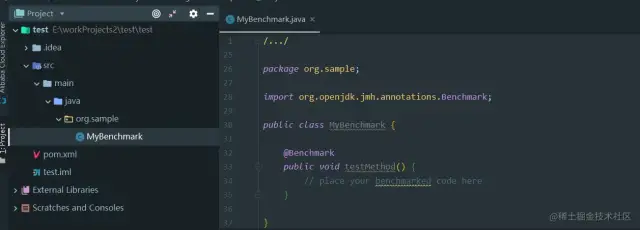
A test project will appear in the corresponding directory. After opening the project, we will see such a project structure.
The second way is to directly add JMH core and JMH generator annprocess dependencies to the existing maven project to integrate JMH.
   <dependency>
            <groupId>org.openjdk.jmh</groupId>
            <artifactId>jmh-core</artifactId>
            <version>${jmh.version}</version>
        </dependency>
        <dependency>
            <groupId>org.openjdk.jmh</groupId>
            <artifactId>jmh-generator-annprocess</artifactId>
            <version>${jmh.version}</version>
            <scope>provided</scope>
        </dependency>
2. Write performance test
Here, I take the performance gap between the index iteration and foreach iteration of LinkedList as an example to write the test class. The annotations involved will be explained later,
/**
 * @author Richard_yyf
 * @version 1.0 2019/8/27
 */

@State(Scope.Benchmark)
@OutputTimeUnit(TimeUnit.SECONDS)
@Threads(Threads.MAX)
public class LinkedListIterationBenchMark {
 private static final int SIZE = 10000;

    private List<String> list = new LinkedList<>();

    @Setup
    public void setUp() {
        for (int i = 0; i < SIZE; i++) {
            list.add(String.valueOf(i));
        }
    }

    @Benchmark
    @BenchmarkMode(Mode.Throughput)
    public void forIndexIterate() {
        for (int i = 0; i < list.size(); i++) {
            list.get(i);
            System.out.print("");
        }
    }

    @Benchmark
    @BenchmarkMode(Mode.Throughput)
    public void forEachIterate() {
        for (String s : list) {
            System.out.print("");
        }
    }
}
3. Perform the test
There are two ways to run JMH benchmark. One is to run it by producing jar files, and the other is to write the main function directly or execute it in unit tests.
The form of generating jar files is mainly for some large tests. There may be some requirements for machine performance or real environment simulation. The test method needs to be written and executed in linux environment. The specific commands are as follows
$ mvn clean install
$ java -jar target/benchmarks.jar
We usually encounter some small tests in our daily life. For example, the example I wrote above, just run directly in the IDE. The startup method is as follows:
 public static void main(String[] args) throws RunnerException {
        Options opt = new OptionsBuilder()
                .include(LinkedListIterationBenchMark.class.getSimpleName())
                .forks(1)
                .warmupIterations(2)
                .measurementIterations(2)
             .output("E:/Benchmark.log")
                .build();

        new Runner(opt).run();
    }
4. Report results
The output results are as follows:,
Final results:
Benchmark                                      Mode  Cnt     Score   Error  Units
LinkedListIterationBenchMark.forEachIterate   thrpt    2  1192.380          ops/s
LinkedListIterationBenchMark.forIndexIterate  thrpt    2   206.866          ops/s
The whole process:
# Detecting actual CPU count: 12 detected
# JMH version: 1.21
# VM version: JDK 1.8.0_131, Java HotSpot(TM) 64-Bit Server VM, 25.131-b11
# VM invoker: C:\Program Files\Java\jdk1.8.0_131\jre\bin\java.exe
# VM options: -javaagent:D:\Program Files\JetBrains\IntelliJ IDEA 2018.2.2\lib\idea_rt.jar=65175:D:\Program Files\JetBrains\IntelliJ IDEA 2018.2.2\bin -Dfile.encoding=UTF-8
# Warmup: 2 iterations, 10 s each
# Measurement: 2 iterations, 10 s each
# Timeout: 10 min per iteration
# Threads: 12 threads, will synchronize iterations
# Benchmark mode: Throughput, ops/time
# Benchmark: org.sample.jmh.LinkedListIterationBenchMark.forEachIterate

# Run progress: 0.00% complete, ETA 00:01:20
# Fork: 1 of 1
# Warmup Iteration   1: 1189.267 ops/s
# Warmup Iteration   2: 1197.321 ops/s
Iteration   1: 1193.062 ops/s
Iteration   2: 1191.698 ops/s


Result "org.sample.jmh.LinkedListIterationBenchMark.forEachIterate":
  1192.380 ops/s


# JMH version: 1.21
# VM version: JDK 1.8.0_131, Java HotSpot(TM) 64-Bit Server VM, 25.131-b11
# VM invoker: C:\Program Files\Java\jdk1.8.0_131\jre\bin\java.exe
# VM options: -javaagent:D:\Program Files\JetBrains\IntelliJ IDEA 2018.2.2\lib\idea_rt.jar=65175:D:\Program Files\JetBrains\IntelliJ IDEA 2018.2.2\bin -Dfile.encoding=UTF-8
# Warmup: 2 iterations, 10 s each
# Measurement: 2 iterations, 10 s each
# Timeout: 10 min per iteration
# Threads: 12 threads, will synchronize iterations
# Benchmark mode: Throughput, ops/time
# Benchmark: org.sample.jmh.LinkedListIterationBenchMark.forIndexIterate

# Run progress: 50.00% complete, ETA 00:00:40
# Fork: 1 of 1
# Warmup Iteration   1: 205.676 ops/s
# Warmup Iteration   2: 206.512 ops/s
Iteration   1: 206.542 ops/s
Iteration   2: 207.189 ops/s


Result "org.sample.jmh.LinkedListIterationBenchMark.forIndexIterate":
  206.866 ops/s


# Run complete. Total time: 00:01:21

REMEMBER: The numbers below are just data. To gain reusable insights, you need to follow up on
why the numbers are the way they are. Use profilers (see -prof, -lprof), design factorial
experiments, perform baseline and negative tests that provide experimental control, make sure
the benchmarking environment is safe on JVM/OS/HW level, ask for reviews from the domain experts.
Do not assume the numbers tell you what you want them to tell.

Benchmark                                      Mode  Cnt     Score   Error  Units
LinkedListIterationBenchMark.forEachIterate   thrpt    2  1192.380          ops/s
LinkedListIterationBenchMark.forIndexIterate  thrpt    2   206.866          ops/s
Annotation introduction
Now let's introduce the relevant notes in detail,
@BenchmarkMode
Micro benchmark type. JMH provides the following types of support:
| type | describe |
|---|---|
| Throughput | The number of execution times in each period of time, usually seconds |
| AverageTime | Average time, average time per operation |
| SampleTime | In the test, the execution time of random sampling |
| SingleShotTime | Time consuming calculation in each execution |
| All | All modes |
It can be annotated at the method level or at the class level,
@BenchmarkMode(Mode.All)
public class LinkedListIterationBenchMark {
 ...
}
@Benchmark
@BenchmarkMode({Mode.Throughput, Mode.SingleShotTime})
public void m() {
 ...
}
@Warmup
This word means preheating, and iterations = 3 refers to the number of preheating rounds.
@Benchmark
@BenchmarkMode({Mode.Throughput, Mode.SingleShotTime})
@Warmup(iterations = 3)
public void m() {
 ...
}
@Measurement
Number of rounds of formal measurement calculation.
- iterations test rounds
- time duration of each round
- timeUnit duration unit
@Benchmark
@BenchmarkMode({Mode.Throughput, Mode.SingleShotTime})
@Measurement(iterations = 3)
public void m() {
 ...
}
@Threads
Test threads in each process.
@Threads(Threads.MAX)
public class LinkedListIterationBenchMark {
 ...
}
@Fork
Number of forks. If the number of forks is 3, JMH will fork out three processes for testing.
@Benchmark
@BenchmarkMode({Mode.Throughput, Mode.SingleShotTime})
@Fork(value = 3)
public void m() {
 ...
}
@OutputTimeUnit
Time type of benchmark results. Generally, seconds, milliseconds and microseconds are selected.
@OutputTimeUnit(TimeUnit.SECONDS)
public class LinkedListIterationBenchMark {
 ...
}
@Benchmark
Method level annotation, indicating that the method is an object that needs to be benchmark ed, and its usage is similar to JUnit's @ Test.
@Param
Attribute level annotation, @ Param can be used to specify various situations of a parameter. It is especially suitable for testing the performance of a function under different parameter inputs.
@Setup
Method level annotation. The function of this annotation is that we need to make some preparations before testing, such as initializing some data.
@TearDown
The function of this annotation is to finish some work after the test, such as closing the thread pool, database connection, etc., which is mainly used for resource recycling.
@State
When using the @ Setup parameter, you must add this parameter to the class, otherwise it will prompt that it cannot run.
For example, in my example above, state must be set.
State is used to declare that a class is a "state", and then accept a scope parameter to represent the shared scope of the state. Because many benchmarks need some classes to represent the state, JMH allows you to inject these classes into the benchmark function in the way of dependency injection. Scope is mainly divided into three types.
- Thread: this state is exclusive to each thread.
- Group: this status is shared by all threads in the same group.
- Benchmark: this state is shared among all threads.
Start method
In the startup method, some parameters mentioned above can be specified directly, and the test results can be output to the specified file,
  /**
     * Run in IDE only
     * The command line mode is build, and then java -jar starts
     *
     * 1. This is the entry to start benchmark
     * 2. At the same time, some configuration work of JMH test has been completed
     * 3. In the default scenario, JMH will find the method marked with @ Benchmark. You can use include and exclude to complete the semantics of inclusion and exclusion
     */
    public static void main(String[] args) throws RunnerException {
        Options opt = new OptionsBuilder()
                // Inclusion semantics
                // You can use the method name or XXX class. getSimpleName()
                .include("Helloworld")
                // Exclusion semantics
                .exclude("Pref")
                // Preheat 10 rounds
                .warmupIterations(10)
                // 10 rounds on behalf of formal measurement test,
                // Each time, the preheating is performed first, and then the formal measurement is performed,
                // The content is to call the code marked @ Benchmark.
                .measurementIterations(10)
                //  forks(3) refers to three rounds of tests,
                // Because a test cannot effectively represent the results,
                // Therefore, through three rounds of comprehensive tests,
                // Each round is a warm-up, and then a formal one.
                .forks(3)
             .output("E:/Benchmark.log")
                .build();

        new Runner(opt).run();
    }
epilogue
Based on JMH, many tools and frameworks can be tested, such as log framework performance comparison, BeanCopy performance comparison, etc. for more example s, please refer to the official JMH samples( https://hg.openjdk.java.net/code-tools/JMH/file/tip/JMH-samples/src/main/java/org/openjdk/JMH/samples/ )
The author talks about some common code testing traps from the perspective of Java Developer, analyzes their correlation with the bottom of the operating system and Java, and helps you get rid of these traps with the help of JMH.
Author: Richard_Yi
Source: Juejin cn/post/6844903936869007368