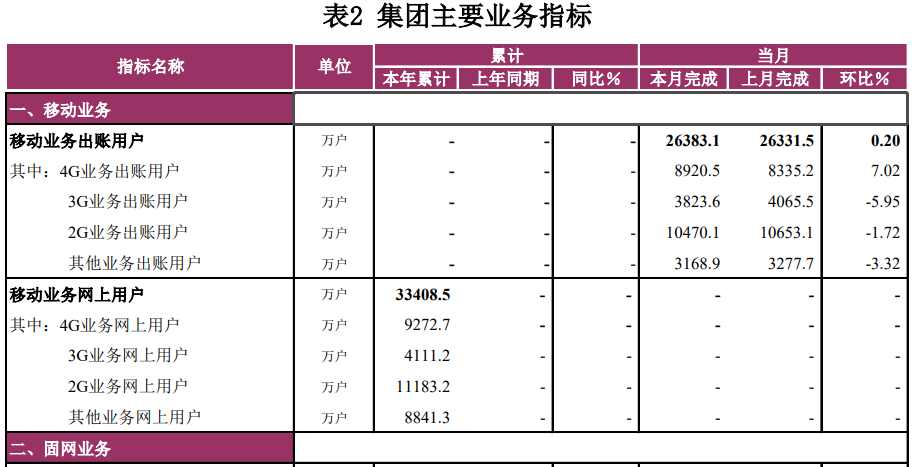
In the statistical table, the statistics are usually accumulated in the current year, completed in the same period of the previous year (accumulated), completed in the current period (such as the current month) and completed in the last month, and the year-on-year and month on month analysis are carried out. The following example is shown in the monthly report statistics table. This article will use Python Pandas tool for statistics.

Of which:
- (current year) cumulative: refers to the total amount from January to the end of the current year
- (last year) same period (cumulative): refers to the total amount from January of last year to the end month corresponding to the cumulative amount of this year
- Year on year (growth rate) = (amount in current period - amount in the same period) / amount in the same period * 100%
- Month on month (growth rate) = (current period amount - previous period amount) / previous period amount * 100%
Note: the current period here refers to the completion of the current month or the current month, and the number of the previous period refers to the completion of the previous month.
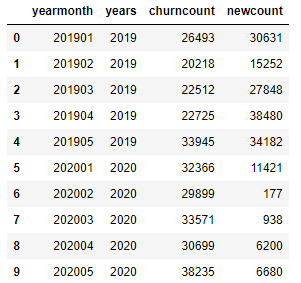
Sample data:

Note: for the convenience of demonstration, the data source of this case only uses the data of 2 years and 5 months a year.
1. (this year) cumulative
In statistical analysis and development, it is a common requirement to accumulate some statistical data by year and month. For data, it is to accumulate data line by line according to rules.
The cumsum() function in Pandas can accumulate demand according to a certain time dimension.
# Take the cumulative value of this year
import pandas as pd

df = pd.read_csv('data2021.csv')
cum_columns_name = ['cum_churncount','cum_newcount']
df[cum_columns_name] = df[['years','churncount','newcount']].groupby(['years']).cumsum()
Note: the grouping 'years' refers to the cumulative time dimension of the year.
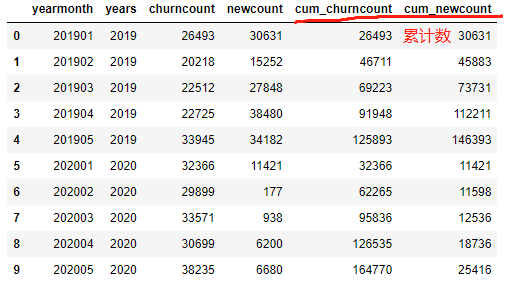
The calculation results are as follows:

2. (last year) cumulative in the same period
For the cumulative value of the same period (last year), the data of the same month of the cumulative value of the previous year will be directly obtained. pandas DataFrame. The shift () function can move the data by a specified number of rows.

Continue the above column and read the data of the same period. First, move 'yearmonth' up five rows to get a new DataFrame, as shown in the figure above. Use 'yearmonth' to associate the data of two tables (left Association: the original table is on the left and the new table is on the right), so as to achieve the effect of de synchronization data.
cum_columns_dict = {'cum_churncount':'cum_same_period_churncount',
                        'cum_newcount':'cum_same_period_newcount'}
df_cum_same_period = df[['cum_churncount','cum_newcount','yearmonth']].copy()
df_cum_same_period = df_cum_same_period.rename(columns=cum_columns_dict)
#df_cum_same_period.loc[:,'yearmonth'] = df_cum_same_period['yearmonth'].shift(-12) # 12 months a year
df_cum_same_period.loc[:,'yearmonth'] = df_cum_same_period['yearmonth'].shift(-5)   # Because only five months of data are taken

df = pd.merge(left=df,right=df_cum_same_period,on='yearmonth',how='left')
3. Last month (completed)
Take the data of last month and use pandas dataframe The shift() function moves the data by a specified number of rows.
Continue the above column and read the data of the previous period. (same as the synchronization principle, omitted)
last_mnoth_columns_dict = {'churncount':'last_month_churncount',
                        'newcount':'last_month_newcount'}
df_last_month = df[['churncount','newcount','yearmonth']].copy()
df_last_month = df_last_month.rename(columns=last_mnoth_columns_dict)

df_last_month.loc[:,'yearmonth'] = df_last_month['yearmonth'].shift(-1)  # Move one line
df = pd.merge(left=df,right=df_last_month,on='yearmonth',how='left')
4. Year on year (growth rate)
The year-on-year calculation involves division, and the data with divisor of zero needs to be eliminated.
df.fillna(0,inplace=True) # Null values are filled with 0
# Calculate year-on-year
df.loc[df['cum_same_period_churncount']!=0,'cum_churncount_rat'] = (df['cum_churncount']-df['cum_same_period_churncount'])/df['cum_same_period_churncount'] # Divisor cannot be zero
df.loc[df['cum_same_period_newcount']!=0,'cum_newcount_rat'] =  (df['cum_newcount']-df['cum_same_period_newcount'])/df['cum_same_period_newcount'] # Divisor cannot be zero
df[['yearmonth','cum_churncount','cum_newcount','cum_same_period_churncount','cum_same_period_newcount','cum_churncount_rat','cum_newcount_rat']]

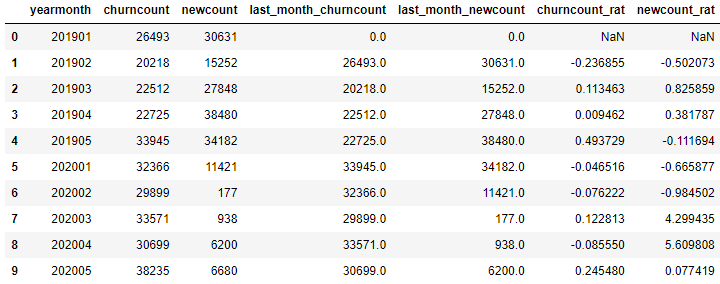
5. Month on month (growth rate)
# Calculate month on month ratio
df.loc[df['last_month_churncount']!=0,'churncount_rat'] = (df['churncount']-df['last_month_churncount'])/df['last_month_churncount'] # Divisor cannot be zero
df.loc[df['last_month_newcount']!=0,'newcount_rat'] =  (df['newcount']-df['last_month_newcount'])/df['last_month_newcount'] # Divisor cannot be zero
df[['yearmonth','churncount','newcount','last_month_churncount','last_month_newcount','churncount_rat','newcount_rat']]

6. Summary
pandas has many statistical calculation functions and methods. The techniques summarized here include cumulative cumsum() function, mobile data shift() function, table merge Association merge() function, and modifying data through loc conditions.