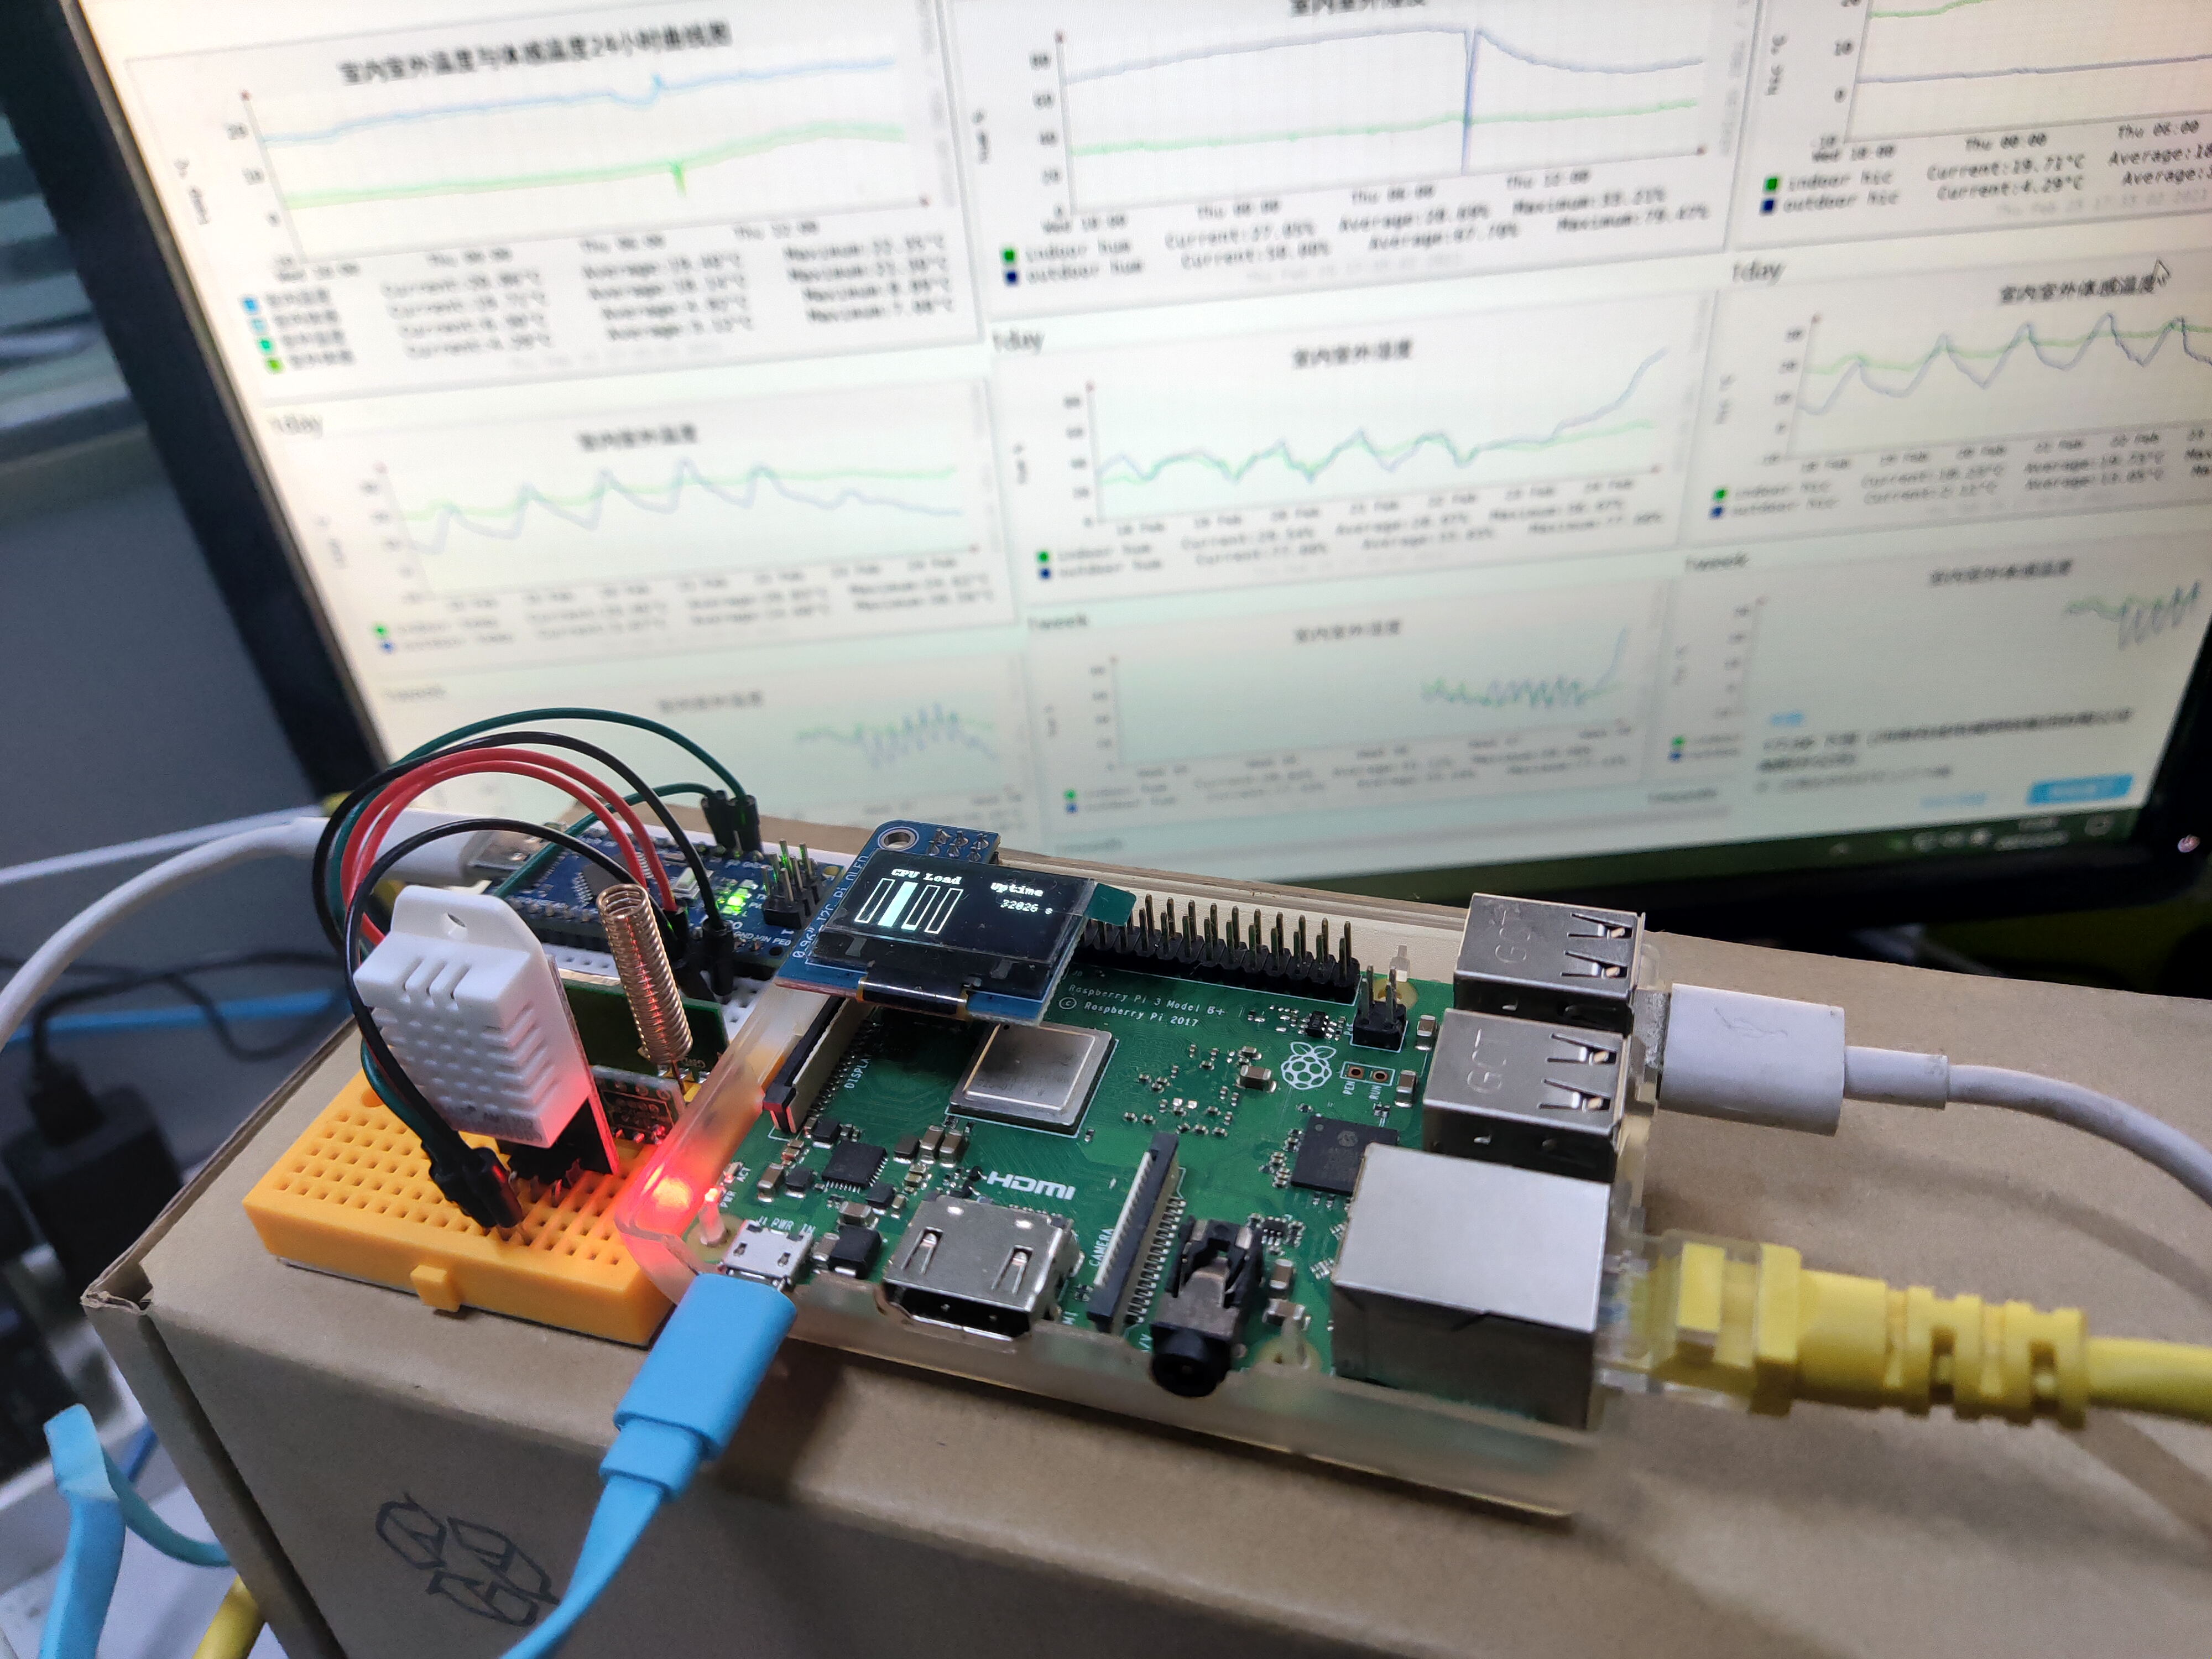
Collect indoor and outdoor temperature and humidity data through arduino, and transmit the collected data to raspberry pie in the form of json data through serial port. There is a service in raspberry pie to obtain the data from serial port and write the data into rrd file. Make another script on the raspberry pie, generate graphics every 5 minutes, and put them in the http server directory for viewing through the browser.
The list of materials used in the project is as follows
Necessary materials:
1. A piece of raspberry pie
2. One set of Oregon Scientific RTGR328N outdoor sensor. (the outdoor temperature and humidity sensor of Eurasia home weather station will be briefly described later)
3. Arduino nano
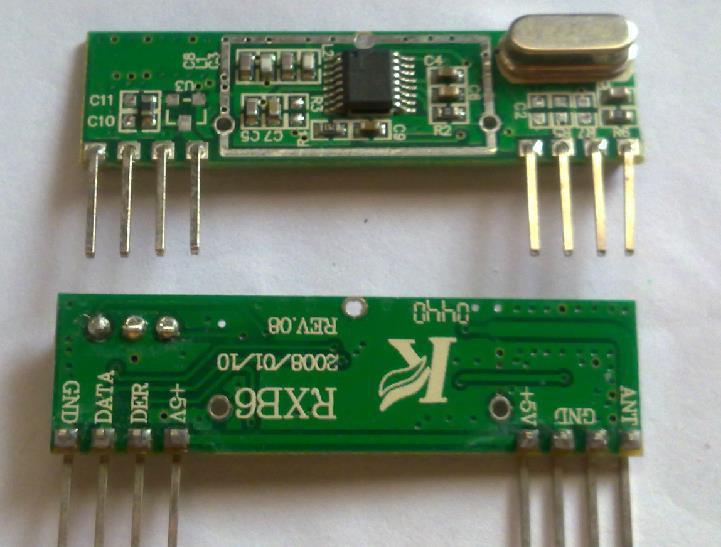
4. RXB60 433MHz superheterodyne receiving module (I also used that kind of cheap superheterodyne module, which seems to have poor anti-interference ability, but it is much more stable after replacing this module later)
5. Several connecting lines
6. One 433MHz spring antenna (RXB60 receiving module does not contain an antenna, so you need to connect an antenna to the module ANT pin by yourself)
7. Two 170 hole bread plates (in fact, using two 170 hole bread plates this time is more compact and more space efficient than using 400 hole bread plates)
8. DHT11 or DHT22 temperature and humidity module (mainly used to obtain indoor temperature and humidity, here I use DHT22)

Software:
1. Raspberry pie is best served with debian or ubuntu systems
2. Install rrdtool and python3,
3. Then install an http server such as nginx or apache, mainly to view the diagram of rrdtool through the web page.
Why use the temperature and humidity sensor of Europe?
At first, I used the 433MHz outdoor temperature and humidity sensor of the domestic yimeite weather station to get the outdoor temperature and humidity data. I also tested another cheap 433MHz temperature and humidity sensor of foreign garbage marked as UPM. It was found that it was very difficult for me, a layman who was not proficient in radio, to decode these sensor data, During the research, it was found that the Eurasia weather station is widely used in foreign countries (because Eurasia is the ancestor of home weather stations), and there are many research friends. There are ready-made and mature decoding schemes, so we started a second-hand one on a fish at a low price for research. A friend will ask, why not use arduino, ESP8266\ESP32 to make an outdoor sensor with Bluetooth, WIFI or 433MHz? I just think the finished sensor like ouxia has its unique advantages: ready-made shell that can work in harsh outdoor environment (mainly to protect the main components from water and dust, and the sensor has special openings), relatively low power consumption of 433MHz, convenient use of dry battery, and better adapt to the harsh outdoor environment. Finally, The most important thing is to use it (my sensor model is RTGR328N, which requires two No. 5 batteries and has the function of radio clock, but the frequency is different from that in China, so it can only be used after modification).
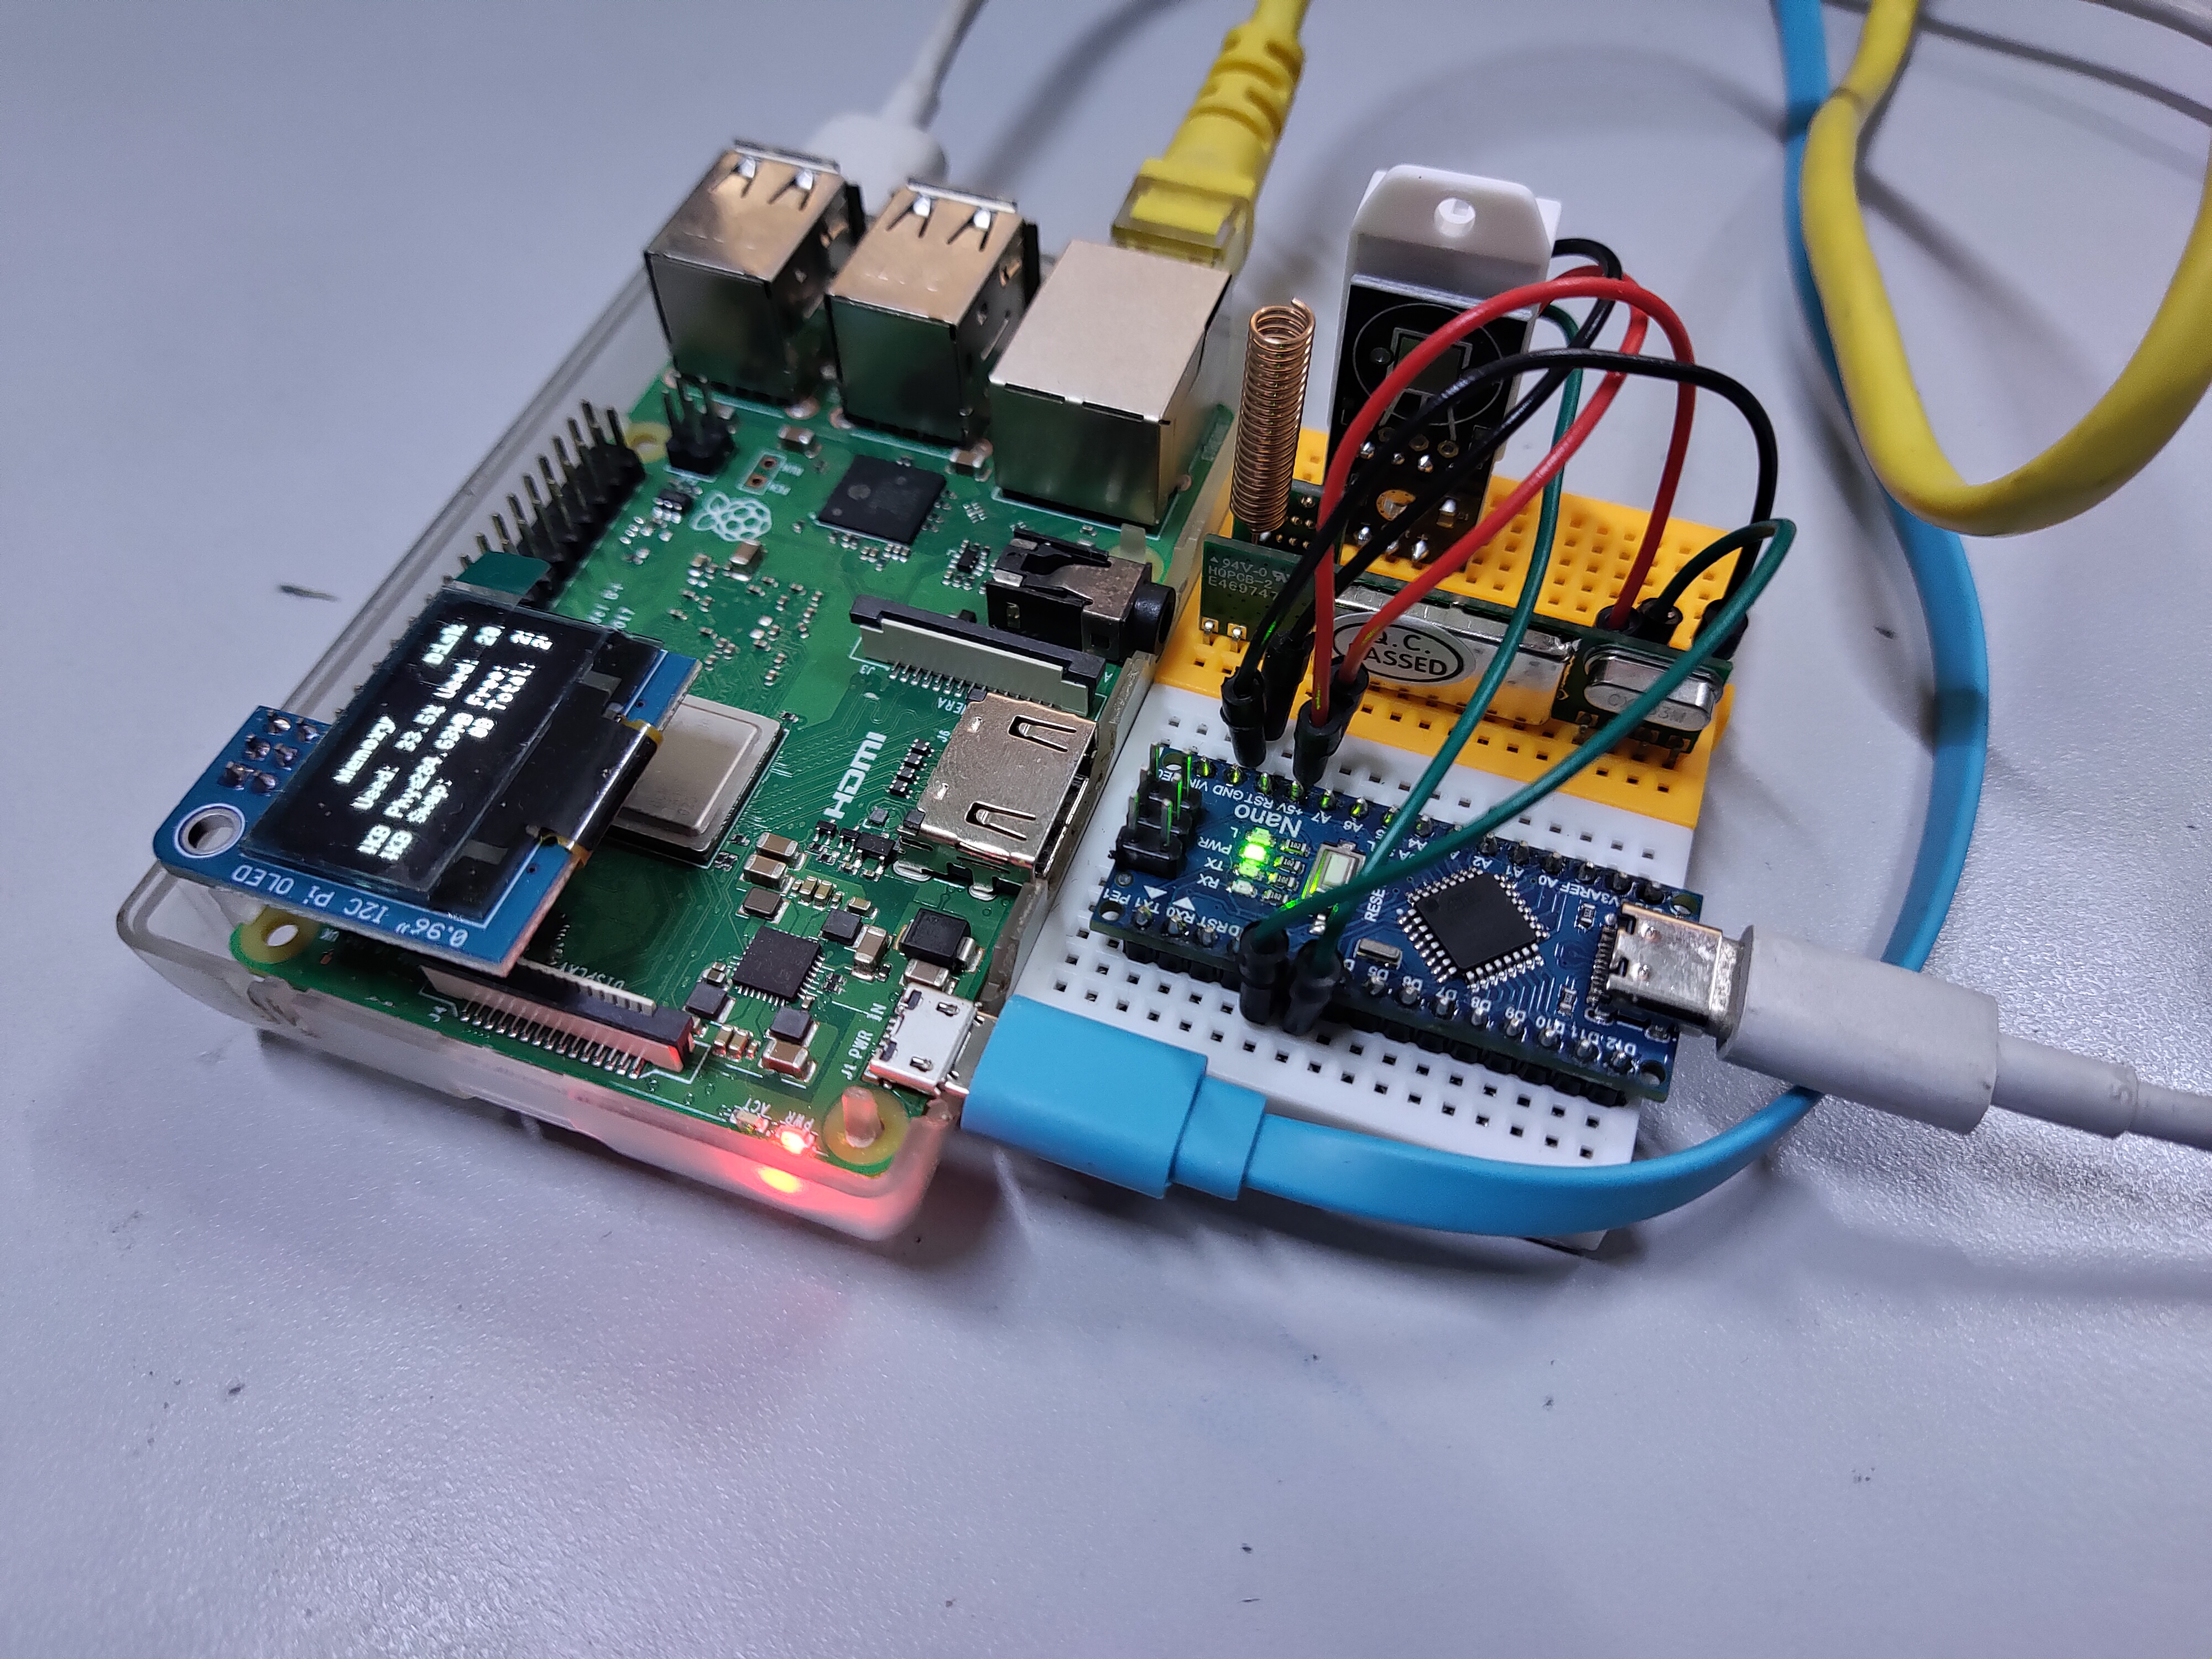
Why not use raspberry pie directly to connect 433Mhz receiver and DHT22 sensor?
The reason is very simple, because arduino has ready-made European sensor decoding code, and our principle is to use it as soon as possible.
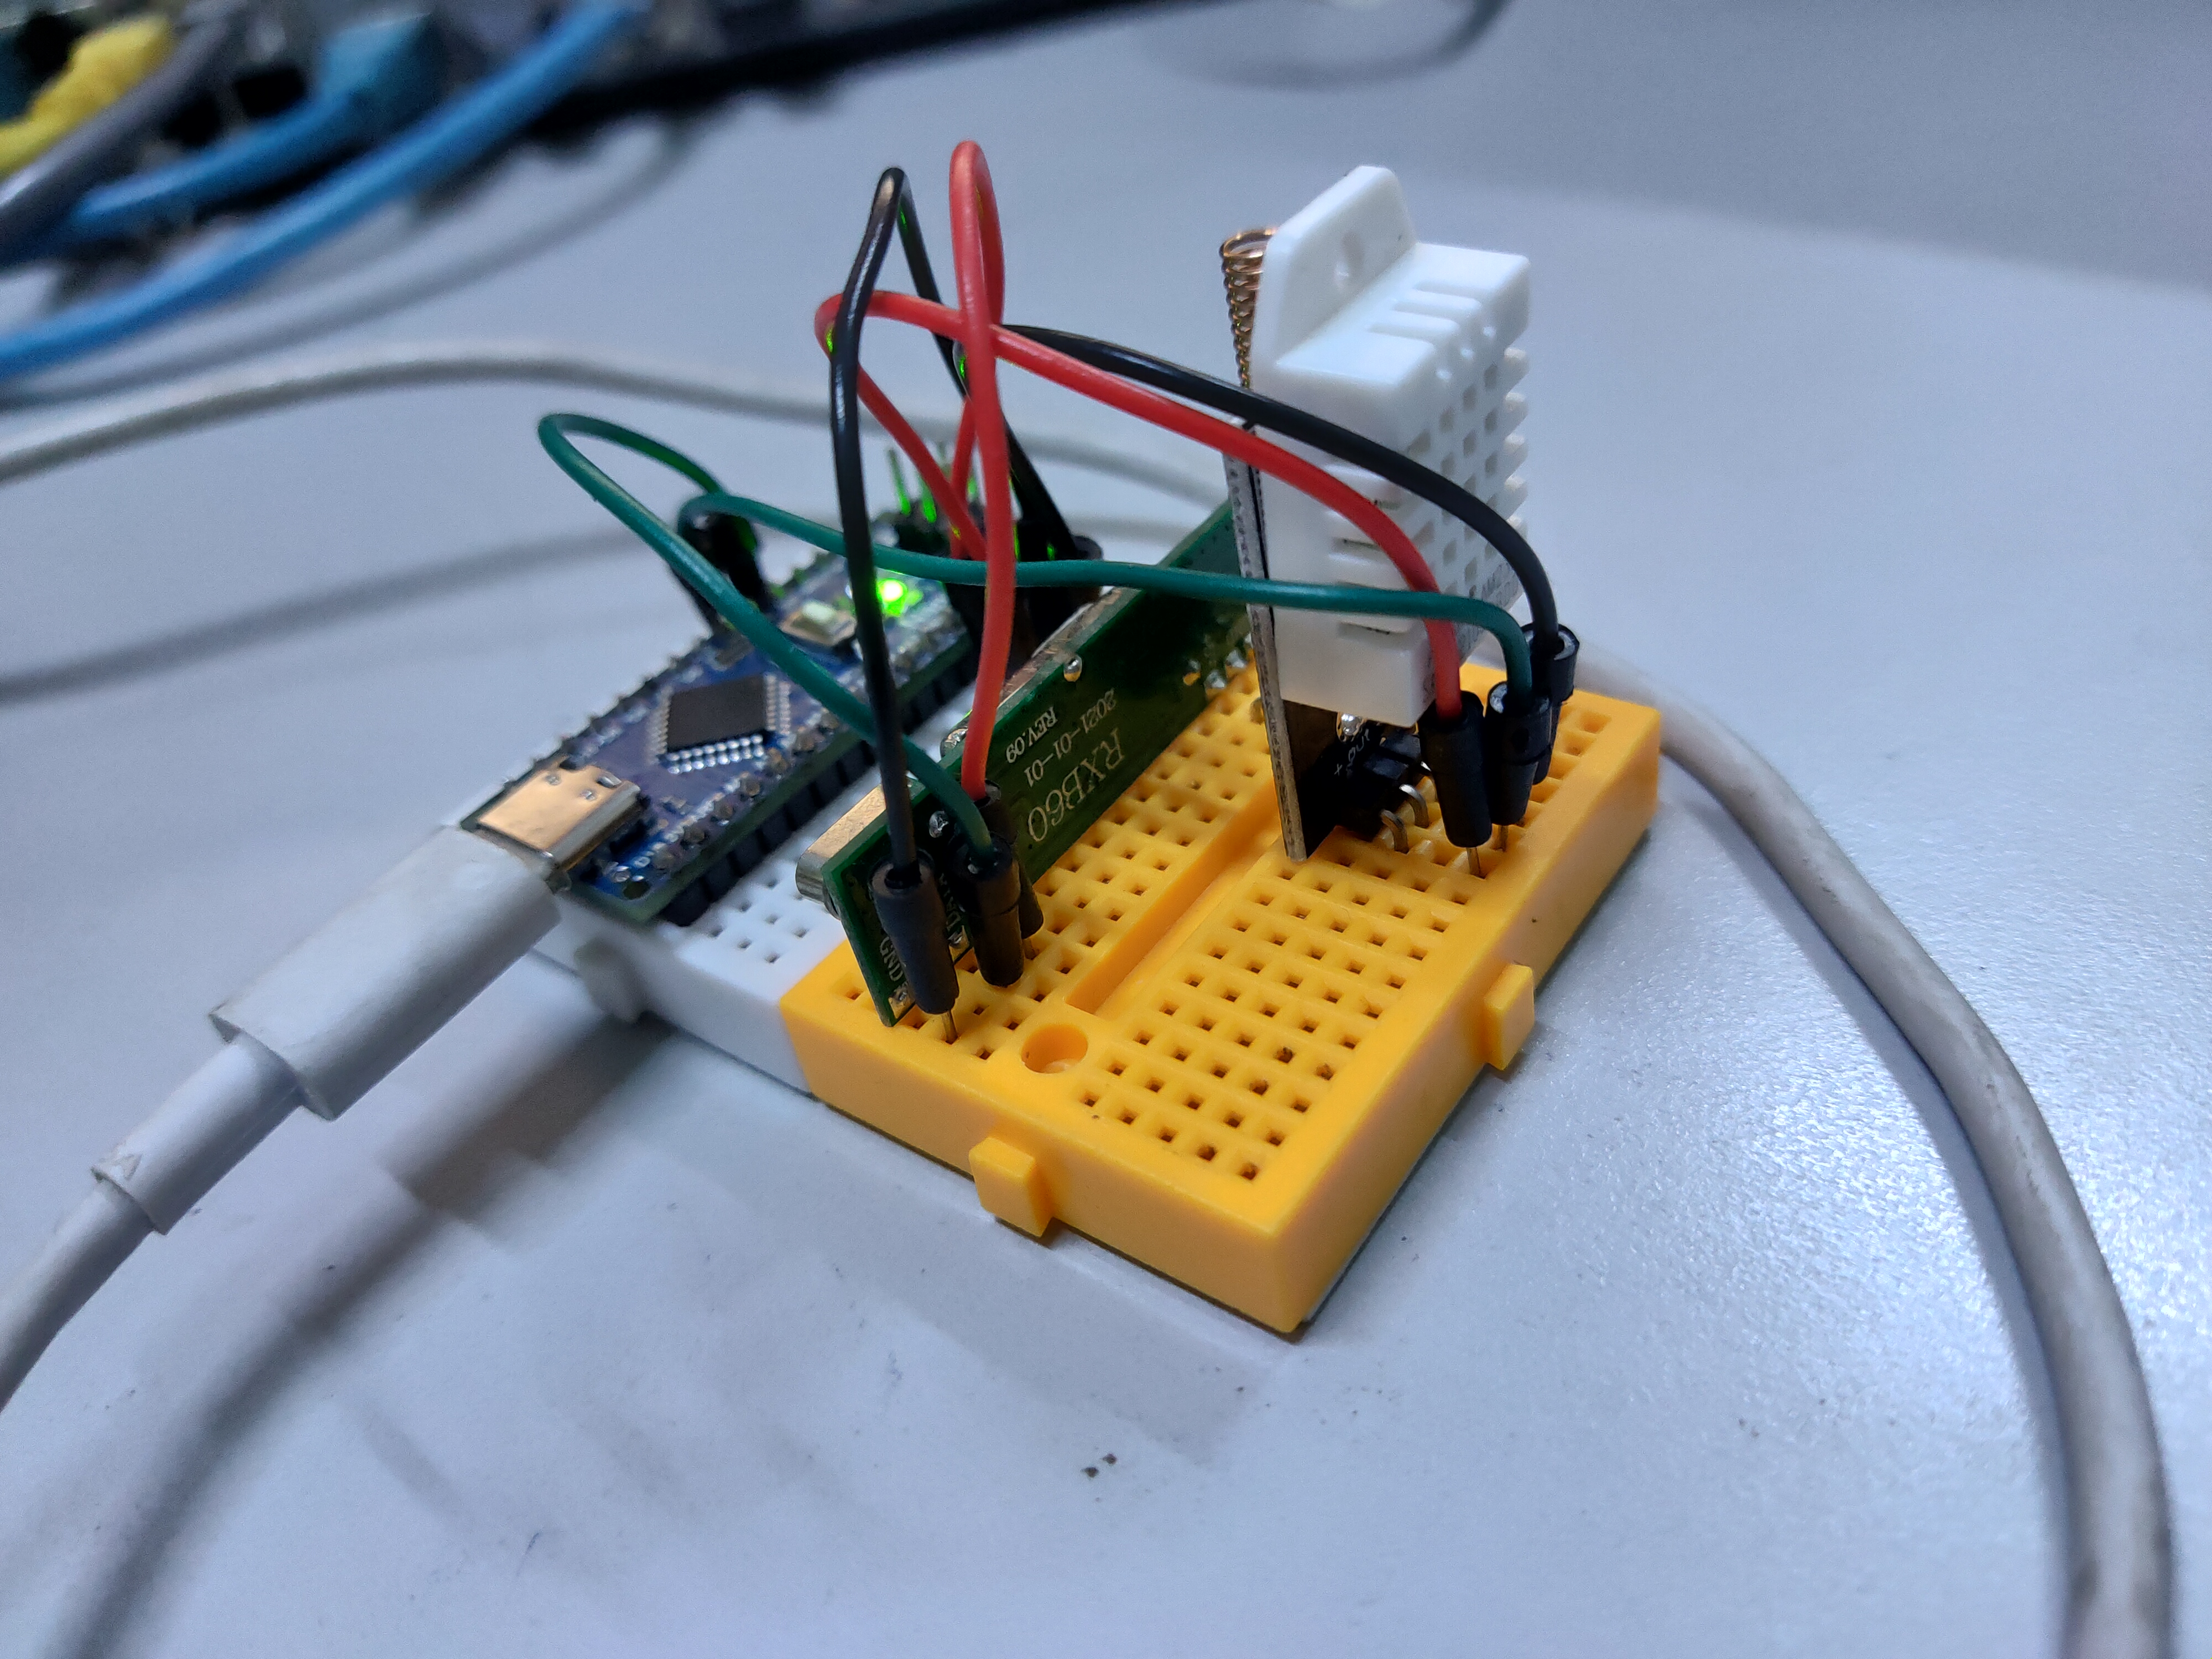
Arduino nano sensor connection:
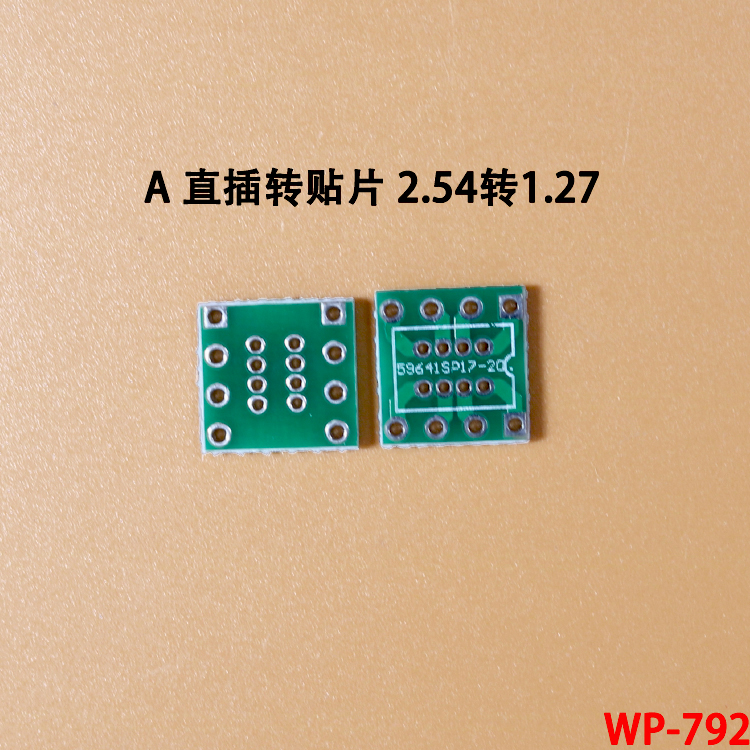
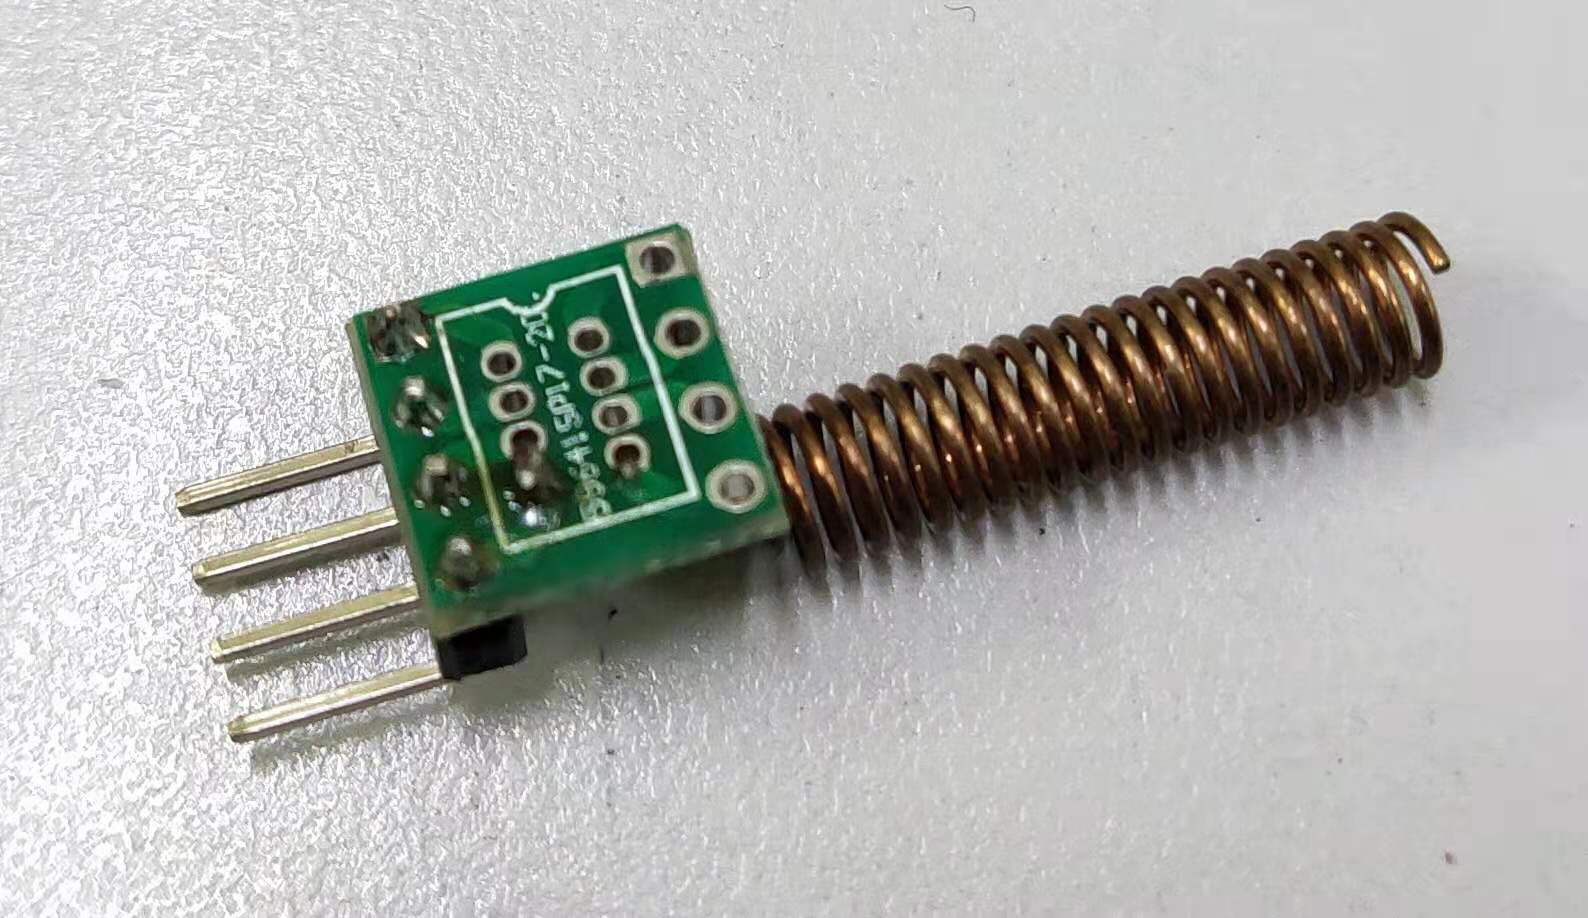
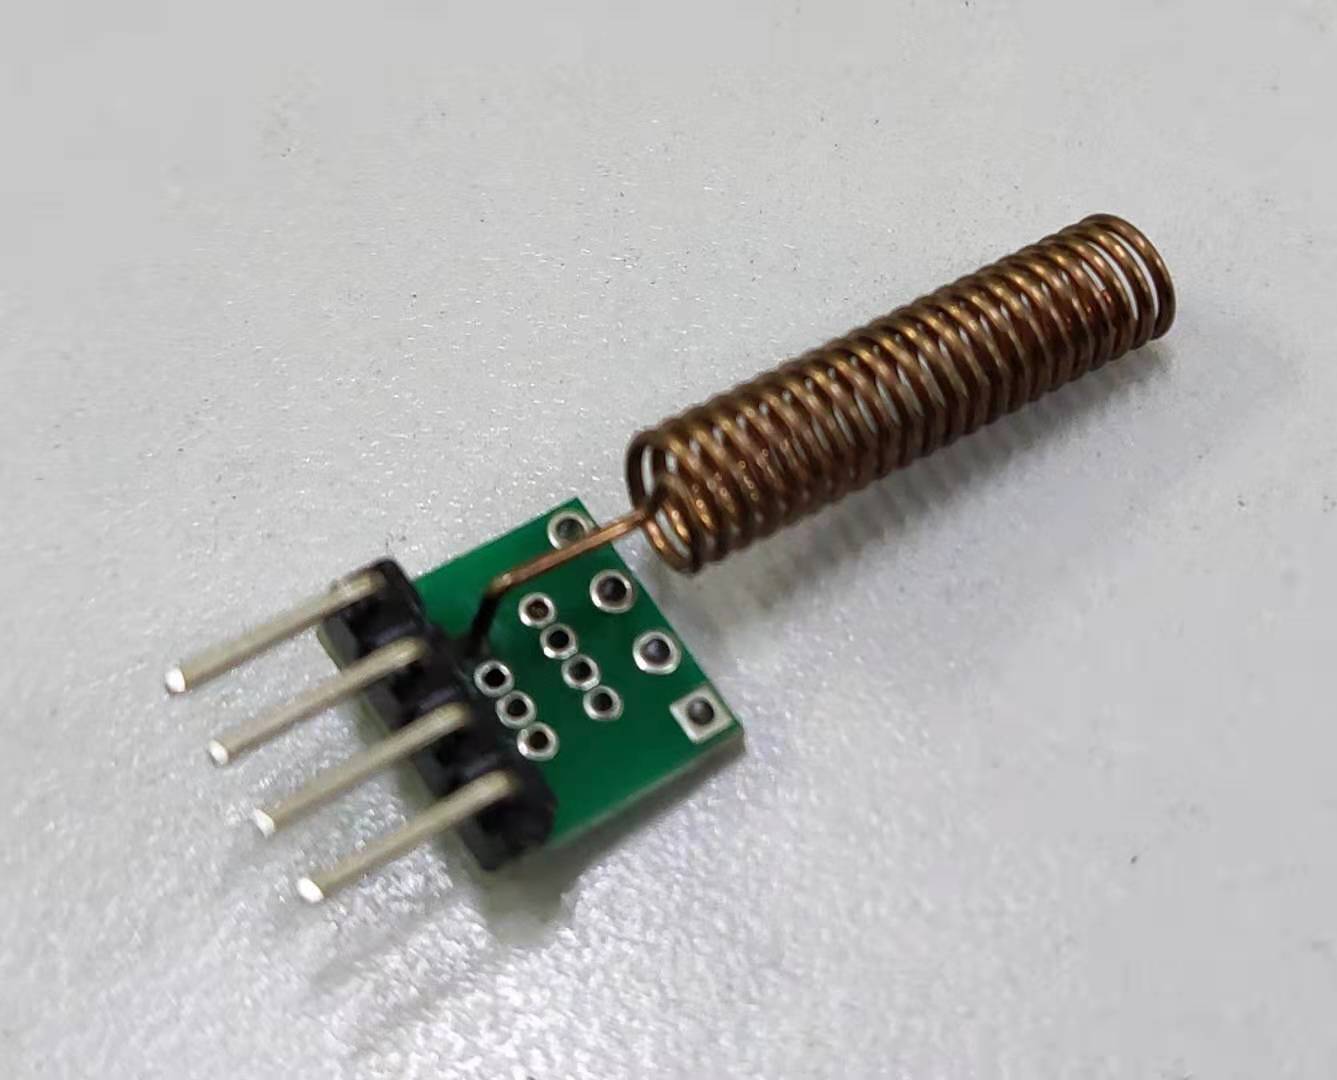
For the antenna part, I found a copper connecting wire directly and inserted it on the bread board. I always feel like it is dragging a small tail. I simply bought a 2.54-1.27 small circuit board and spring antenna at a treasure, welded the antenna in the hole of circuit board 1.27, and welded the row pin at the hole of 2.54 to make the antenna as shown in the figure below:
Arinodu code
The decoding part of the Occidental sensor comes from https://github.com/rene-d/oregon On this basis, I made some modifications, added the code to read DHT22 sensor data, and sent data in json format through serial port.
The arduino libraries used include ArduinoJson and DHT sensor library.
// oregon.ino
// rene-d 01/2019
#include "DHT.h"
#include <ArduinoJson.h>
#include "Oregon.h"
#include "decode.h"
#define DHTPIN 3     // Digital pin connected to the DHT sensor
// Define pin where is 433Mhz receiver (here, pin 2)
#define MHZ_RECEIVER_PIN 2
//#define DHTTYPE DHT11   // DHT 11
#define DHTTYPE DHT22   // DHT 22  (AM2302), AM2321
//#define DHTTYPE DHT21   // DHT 21 (AM2301)
DHT dht(DHTPIN, DHTTYPE);
void setup()
{
    Serial.begin(115200);
    //DHTxx
    dht.begin();


    Serial.println(">>>>Arduino-Oregon RTGR328N Example<<<<");
    //Serial.println("Setup started");

    memset(&sensor_clock, 0, sizeof(sensor_clock));
    sensor_clock.day = 1;
    sensor_clock.month = 1;
    pinMode(LED_BUILTIN, OUTPUT);

    // Setup received data
    attachInterrupt(digitalPinToInterrupt(MHZ_RECEIVER_PIN), ext_int_1, CHANGE);

    //Serial.println("Setup completed");
    //Serial.println("Begin receive 433MHz Oregon RTGR328N sensors...");
}

void loop()
{
    //------------------------------------------
    // Start process new data from Oregon sensors
    //------------------------------------------
    noInterrupts(); // Disable interrupts
    word p = pulse;
    pulse = 0;
    interrupts(); // Enable interrupts

    if (p != 0)
    {
        if (orscV2.nextPulse(p))
        {
            // Decode Hex Data once
            byte length;
            const byte *osdata = DataToDecoder(orscV2, length);

            print_hexa(osdata, length);
//            Serial.println(F("Outdoor:"));
            oregon_decode(osdata, length);
            float h = dht.readHumidity();
            float t = dht.readTemperature();

            if (isnan(h) || isnan(t)) {
              Serial.println(F("Failed to read from DHT sensor!"));
              return;
            }

            float hic = dht.computeHeatIndex(t, h, false);
//            Serial.println(F("Indoor:"));
//            Serial.print(F("Humidity: "));
//            Serial.print(h);
//            Serial.print(F("%  Temperature: "));
//            Serial.print(t);
//            Serial.print(F("°C "));
//            Serial.print(F("Heat index: "));
//            Serial.print(hic);
//            Serial.println(F("°C"));


StaticJsonDocument<200> doc;

doc["name"] = "RTGR328N";

JsonObject data = doc.createNestedObject("data");

JsonObject data_indoor = data.createNestedObject("indoor");
data_indoor["temperature"] = t;
data_indoor["humidity"] = h;
data_indoor["heat-index"] = hic;

JsonObject data_outdoor = data.createNestedObject("outdoor");
data_outdoor["humidity"] = sensor_info.hum;
data_outdoor["temperature"] = sensor_info.temp;
data_outdoor["channel"] = sensor_info.channel;
data_outdoor["id"] = sensor_info.id;
data_outdoor["time"] = date_time;
data_outdoor["bat"] = sensor_info.bat;
data_outdoor["RAW"] = raw_result;
serializeJson(doc, Serial);
//Serial.println();
//serializeJsonPretty(doc, Serial);

        }
    }

    update_clock();

    if (Serial.available() > 0)
    {
        // read the incoming byte:
        byte incomingByte = Serial.read();

        if (incomingByte == 't')
        {
            // print the current time
            print_hexa(&incomingByte, 0);
        }
    }
}

int days_in_month(byte month, byte year)
{
    static byte days[] = {0, 31, 28, 31, 30, 31, 30, 31, 31, 30, 31, 30, 31};
    if (month == 2)
    {
        // we will never reach 2100
        if (year % 4 == 0)
            return 29;
    }
    return days[month];
}

void update_clock()
{
    unsigned long now = millis();
    unsigned long o = now - sensor_clock.now;
    if (o >= 1000)
    {
        digitalWrite(LED_BUILTIN, !digitalRead(LED_BUILTIN));

        sensor_clock.now = now;

        while (o >= 1000)
        {
            // advance the clock by one second

            o -= 1000;

            // dirty code done dirt cheap...
            sensor_clock.second++;
            if (sensor_clock.second >= 60)
            {
                sensor_clock.second = 0;
                sensor_clock.minute++;
                if (sensor_clock.minute >= 60)
                {
                    sensor_clock.minute = 0;
                    sensor_clock.hour++;
                    if (sensor_clock.hour >= 24)
                    {
                        sensor_clock.hour = 0;
                        sensor_clock.day++;
                        if (sensor_clock.day > days_in_month(sensor_clock.month, sensor_clock.year))
                        {
                            sensor_clock.day = 1;
                            sensor_clock.month++;
                            if (sensor_clock.month > 12)
                            {
                                sensor_clock.month = 1;
                                sensor_clock.year++;
                            }
                        }
                    }
                }
            }
        }
    }
}

void print_hexa(const byte *data, byte length)
{
    raw_result = "";
    //Serial.println();

    // print the sensor/board clock
    char buf[32];
    snprintf(buf, 32, "%04u/%02u/%02u %02u:%02u:%02u.%03lu",
             2000 + sensor_clock.year, sensor_clock.month, sensor_clock.day,
             sensor_clock.hour, sensor_clock.minute, sensor_clock.second,
             millis() - sensor_clock.now);
    date_time = buf;
    //Serial.println(buf);

    // print data in byte order, that's NOT the nibble order
    //for (byte i = 0; i < length; ++i)
    //{
    //    Serial.print(data[i] >> 4, HEX);
    //    Serial.print(data[i] & 0x0F, HEX);
    //}
    //Serial.println();
    for (byte i = 0; i < length; ++i)
    {
        raw_result += tohex(data[i] >> 4);
        raw_result += tohex(data[i] & 0x0F);
    }

}
decode.h file is mainly to modify the original part of the code directly output to the serial port, and change it to store the data in the global variable, so that the final unified output can be in json format.
// decode.h
// rene-d 01/2019

// internal clock, set from OS sensor
struct
{
    byte year, month, day;
    byte hour, minute, second;
    unsigned long now;
} sensor_clock;
struct
{
    byte id, channel;
    float temp;
    byte hum, bat;
} sensor_info;
String raw_result = "";
String date_time = "";
//
// get a nibble (a half byte)
//
byte nibble(const byte *osdata, byte n)
{
    if (n & 1)
    {
        return osdata[n / 2] >> 4;
    }
    else
    {
        return osdata[n / 2] & 0xf;
    }
}

//
// calculate the packet checksum (sum of all nibbles)
//
bool checksum(const byte *osdata, byte last, byte check)
{
    byte calc = 0;

    for (byte i = 1; i <= last; i++)
    {
        calc += nibble(osdata, i);
    }

    return (check == calc);
}

//
// print a buffer in nibble order, with nibbles packed by field
//
void print_nibbles(const byte *osdata, size_t len, const char *def)
{
    static const char digits[] = "0123456789ABCDEF";
    char hexa[128];
    size_t i = 0;
    size_t j = 0;
    size_t k = 0;
    char c, n;

    n = def[0];
    if (n)
        n -= '0';
    c = n;

    while (i < len * 2 && j < sizeof(hexa) - 3)
    {
        hexa[j++] = digits[nibble(osdata, i++)];
        if (c > 0)
        {
            c--;
            if (c == 0)
            {
                // reverse last def[k] chars
                if (n > 1)
                {
                    for (char z = 0; z < n / 2; ++z)
                    {
                        c = hexa[j - 1 - z];
                        hexa[j - 1 - z] = hexa[j - n + z];
                        hexa[j - n + z] = c;
                    }
                }
                hexa[j++] = ' ';
                n = def[++k];
                if (n)
                    n -= '0';
                c = n;
            }
        }
    }
    hexa[j] = 0;

    Serial.print("data: ");
    Serial.println(hexa);
}

//
// message 3EA8 or 3EC8 : clock
//
void decode_date_time(const byte *osdata, size_t len)
{
    if (len < 12)
        return;

    byte crc = osdata[11];
    bool ok = checksum(osdata, 21, crc);

    byte channel = (osdata[2] >> 4);
    byte rolling_code = osdata[3];

    int year = (osdata[9] >> 4) + 10 * (osdata[10] & 0xf);
    int month = (osdata[8] >> 4);
    int day = (osdata[7] >> 4) + 10 * (osdata[8] & 0xf);
    int hour = (osdata[6] >> 4) + 10 * (osdata[7] & 0xf);
    int minute = (osdata[5] >> 4) + 10 * (osdata[6] & 0xf);
    int second = (osdata[4] >> 4) + 10 * (osdata[5] & 0xf);

    channel = nibble(osdata, 5);

#ifdef ARDUINO
    if (!ok)
        Serial.println(" bad crc");

    if (ok && (nibble(osdata, 8) & 2) != 0)
    {
        // update the sensor clock
        sensor_clock.now = millis();
        sensor_clock.year = year;
        sensor_clock.month = month;
        sensor_clock.day = day;
        sensor_clock.hour = hour;
        sensor_clock.minute = minute;
        sensor_clock.second = second;
        Serial.println("update sensor clock!");
    }

    //Serial.print(" id: ");
    //Serial.println(rolling_code);
    //Serial.print(" channel: ");
    //Serial.println(channel);

    char buf[100];
    snprintf(buf, sizeof(buf), " date: 20%02d/%02d/%02d", year, month, day);
    //Serial.println(buf);
    snprintf(buf, sizeof(buf), " time: %02d:%02d:%02d", hour, minute, second);
    //Serial.println(buf);
#else
    print_nibbles(osdata, len, "14121222211212");

    char buf[80];
    snprintf(buf, sizeof(buf), "channel=%d crc=$%02X %s id=%d channel=%d state=%d clock=20%02d/%02d/%02d %02d:%02d:%02d",
             channel, crc, ok ? "OK" : "KO", rolling_code,
             channel, nibble(osdata, 8),
             year, month, day, hour, minute, second);
    Serial.println(buf);

    static const char *label[] = {
        "alwaysA",        // 0    b0    A=1010 - not part of the message
        "id_msg",         // 1    b0
        "id_msg",         // 2    b1
        "id_msg",         // 3    b1
        "id_msg",         // 4    b2
        "channel",        // 5    b2
        "rolling code",   // 6    b3
        "rolling code",   // 7    b3
        "clock state",    // 8    b4    0,4,8: date is invalid, 2 or 6: date is valid
        "second (units)", // 9    b4
        "second (tens)",  // 10   b5
        "minute (unit)",  // 11   b5
        "minute (tens)",  // 12   b6
        "hour (units)",   // 13   b6
        "hour (tens)",    // 14   b7
        "day (units)",    // 15   b7
        "day (tens)",     // 16   b8
        "month",          // 17   b8
        "day of week",    // 18   b9
        "year (units)",   // 19   b9
        "year (tens)",    // 20   b10
        "?",              // 21   b10
        "crc",            // 22   b11
        "crc",            // 23   b11
    };

    for (int i = 0; i < 24; ++i)
    {
        snprintf(buf, sizeof(buf), "  nibble %2d : %X  %s", i, nibble(osdata, i), label[i]);
        Serial.println(buf);
    }
#endif
}

//
// message 3CCx or 02D1: temperature humidity
//
void decode_temp_hygro(const byte *osdata, size_t len)
{
    if (len < 9)
        return;

    byte crc = osdata[8];
    bool ok = checksum(osdata, 15, crc); // checksum = nibbles 1-15, result is nibbles 17..16

    byte channel = (osdata[2] >> 4);
    byte rolling_code = osdata[3];

    int temp = ((osdata[5] >> 4) * 100) + ((osdata[5] & 0x0F) * 10) + ((osdata[4] >> 4));
    if (osdata[6] & 0x08)
        temp = -temp;

    byte hum = ((osdata[7] & 0x0F) * 10) + (osdata[6] >> 4);
//
    byte BatteryLevel = (osdata[4] & 0x4) ? 10 : 90;
//    Serial.println("Oregon battery level: " + String(BatteryLevel));
//
    byte bat = osdata[4] & 0x4;
//    byte bat = osdata[4] & 0x0F;

#ifdef ARDUINO
    if (!ok)
        Serial.println(" bad crc");
    //Serial.print(" id: [");
    //Serial.print(rolling_code);
    //Serial.print("] channel: [");
    //Serial.print(channel);

    //Serial.print("] temperature: [");
    //Serial.print(temp / 10.);
    //Serial.print("] humidity: [");
    //Serial.print(hum);

    //Serial.print("] bat: [");
    //Serial.print(BatteryLevel);
//    Serial.print(bat);
    //if ((bat & 4) != 0)
    //{
    //    Serial.println(" low]");
    //}
    //else
    //{
    //    Serial.println(" ok]");
    //}
        sensor_info.id = rolling_code;
        sensor_info.channel = channel;
        //sensor_info.temp = temp;
        sensor_info.temp = temp / 10.;
        sensor_info.hum = hum;
        sensor_info.bat = BatteryLevel;
#else
    print_nibbles(osdata, len, "141214212");
    char buf[80];
    snprintf(buf, sizeof(buf), "channel=%d crc=$%02X %s id=%d temp=%.1lf°C hum=%d%% bat=%d",
             channel, crc, ok ? "OK" : "KO", rolling_code,
             temp / 10., hum, bat);
    Serial.println(buf);

    static const char *label[] = {
        "alwaysA",              // 0    b0 lsb  always A=1010
        "id_msg",               // 1    b0 msb
        "id_msg",               // 2    b1 lsb
        "id_msg",               // 3    b1 msb
        "id_msg",               // 4    b2 lsb
        "channel",              // 5    b2 msb
        "rolling code",         // 6    b3 lsb
        "rolling code",         // 7    b3 msb
        "battery",              // 8    b4 lsb  bit 3=1 => low?
        "temperature (tenths)", // 9    b4 msb
        "temperature (units)",  // 10   b5 lsb
        "temperature (tens)",   // 11   b5 msb
        "temperature (sign)",   // 12   b6 lsb
        "humidity (units)",     // 13   b6 msb
        "humidity (tens)",      // 14   b7 lsb
        "comfort",              // 15   b7 msb  comfort ??? (according to RFLink) 0: normal, 4: comfortable, 8: dry, C: wet
        "crc",                  // 16   b8 lsb
        "crc",                  // 17   b8 msb
    };

    for (int i = 0; i < 18; ++i)
    {
        snprintf(buf, sizeof(buf), "  nibble %2d : %X  %s", i, nibble(osdata, i), label[i]);
        Serial.println(buf);
    }
#endif
}

void oregon_decode(const byte *osdata, size_t len)
{
    // we need 2 bytes at least
    //  - the preamble A
    //  - the ID on four nibbles
    if (len < 3)
        return;

    uint16_t id = (((uint16_t)nibble(osdata, 4)) << 12) +
                  (((uint16_t)nibble(osdata, 3)) << 8) +
                  (((uint16_t)nibble(osdata, 2)) << 4) +
                  (((uint16_t)nibble(osdata, 1)));

#ifndef ARDUINO
    char buf[32];
    snprintf(buf, 32, "message: %04X len=%zu", id, len);
    Serial.println(buf);
#endif

    if ((id & 0xFFF0) == 0x3CC0 || id == 0x02D1)
    {
        decode_temp_hygro(osdata, len);
    }
    else if (id == 0x3EA8 || id == 0x3EC8)
    {
        decode_date_time(osdata, len);
    }
    else
    {
#ifndef ARDUINO
        print_nibbles(osdata, len, "1412");
        Serial.println("UNKNOWN");
#endif
    }
}
String tohex(int n) {
  if (n > 15) {
    return "0";
  }
  String result = "";
  char _16[] = {
    '0', '1', '2', '3', '4', '5', '6', '7', '8', '9', 'A', 'B', 'C', 'D', 'E', 'F'
  };
  result = _16[n];
  return result;
}
Raspberry pie first needs to write a service, read json data from USB serial port in the background and write it into rrd file.
First, create a new service in the / home/ubuntu / directory_ read_ sensor. Py file, the content is as follows, the main function is
Called by service file
#!/usr/bin/python3
import serial
import threading
import json
import time
import math
import rrdtool
import sys

DATA = "" # Read data
NOEND = True # End of reading
sensor_data = ""

def calc_heat_index(T, RH):
    '''NOAA The calculated somatosensory temperature parameter is air temperature(centigrade)And relative humidity(0~100 Or 0~1)'''
    if RH < 1:
        RH *= 100
    T = 1.8 * T + 32
    HI = 0.5 * (T + 61 + (T - 68) * 1.2 + RH * 0.094)
    if HI >= 80:  # If not less than 80 degrees Fahrenheit, recalculate with the complete formula
        HI = -42.379 + 2.04901523 * T + 10.14333127 * RH - .22475541 * T * RH \
             - .00683783 * T * T - .05481717 * RH * RH + .00122874 * T * T * RH \
             + .00085282 * T * RH * RH - .00000199 * T * T * RH * RH
        if RH < 13 and 80 < T < 112:
            ADJUSTMENT = (13 - RH) / 4 * math.sqrt((17 - abs(T - 95)) / 17)
            HI -= ADJUSTMENT
        elif RH > 85 and 80 < T < 87:
            ADJUSTMENT = (RH - 85) * (87 - T) / 50
            HI += ADJUSTMENT
    return round((HI - 32) / 1.8, 2)

# Ontology of reading data
def read_data(ser):
    #global DATA, NOEND, sensor_data
    global DATA, NOEND, sensor_data,logfile
    # Loop receiving data (this is an endless loop, which can be implemented by threads)
    while NOEND:
        if ser.in_waiting:
            #logfile = open("\tmp\read_serial.log", "a")
            #DATA = ser.read(ser.in_waiting).decode("gbk")
            DATA = ser.readline().decode("gbk")
            logfile.write("\n["+time.strftime("%Y-%m-%d %H:%M:%S", time.localtime())+"]receive:"+DATA+"\n")
            logfile.write("\n["+time.strftime("%Y-%m-%d %H:%M:%S", time.localtime())+"]json.loads:")
            try:
                sensor_data = json.loads(DATA)
            except ValueError:
                logfile.write("error for json\n")
            else:
                logfile.write(str(sensor_data)+"\n")
                update=rrdtool.updatev('/home/ubuntu/test2.rrd','N:%s:%s:%s:%s:%s:%s' % (str(sensor_data['data']['indoor']['temperature']),str(sensor_data['data']['indoor']['humidity']),str(sensor_data['data']['indoor']['heat-index']),str(sensor_data['data']['outdoor']['temperature']),str(sensor_data['data']['outdoor']['humidity']),str(calc_heat_index(sensor_data['data']['outdoor']['temperature'],sensor_data['data']['outdoor']['humidity']))))
                logfile.write("\n["+time.strftime("%Y-%m-%d %H:%M:%S", time.localtime())+"]rrdtool update:"+str(update)+"\n")
            logfile.flush()
            #logfile.close()
# Open serial port
def open_seri(portx, bps, timeout):
    global logfile
    ret = False
    try:
        # Open the serial port and get the serial port object
        ser = serial.Serial(portx, bps, timeout=timeout)
        # Judge whether it is successfully opened
        if(ser.is_open):
            ret = True
            th = threading.Thread(target=read_data, args=(ser,)) # Create a child thread to wait for data to be read
            th.start()
    except Exception as e:
        #logfile = open("\tmp\open_serial.log", "a")
        logfile.write("\n["+time.strftime("%Y-%m-%d %H:%M:%S", time.localtime())+"]open serial error:"+e+"\n")
        logfile.flush()
        #logfile.close()
    return ser, ret

# Close the serial port
def close_seri(ser):
    global NOEND
    NOEND = False
    ser.close()

# Write data
def write_to_seri(ser, text):
    res = ser.write(text.encode("gbk")) # write
    return res

# Read data
def read_from_seri():
    global DATA
    data = DATA
    DATA = "" #Clear current read
    return data

if __name__ == "__main__":

    logfile = open("/tmp/read_serial.log", "a")
    ser, ret = open_seri('/dev/ttyUSB0', 115200, 1)

    while True:
        time.sleep(2)
    logfile.close()
Create a new read in the / lib/systemd/system directory_ serial_ sensor. Service file, as follows:
[Unit]
Description=Read Serial Sensor Service
After=multi-user.target
Conflicts=getty@tty1.service

[Service]
Type=simple
ExecStart=/usr/bin/python3 /home/ubuntu/service_read_sensor.py
StandardInput=tty-force

[Install]
WantedBy=multi-user.target
sudo systemctl start read_serial_sensor.service
sudo systemctl status read_serial_sensor.service
sudo systemctl enable read_serial_sensor.service
In addition, write a script to execute regularly and generate rrd images every 5 minutes. The images are placed in the / usr/local/nginx/html/images / directory, which is a picture directory under my nginx root directory.
#!/usr/bin/env python3
import sys
import time
import rrdtool
rrdtool.graph(
'/usr/local/nginx/html/images/temp_test-1day.png',
'--title','24-hour curve of indoor and outdoor temperature and somatosensory temperature',
'--vertical-label','temp °C',
'--alt-autoscale-max',
'--slope-mode',
'--watermark',time.strftime("%a %b %d %H:%M:%S %Y", time.localtime()),
'--lower-limit','-10',
'--font','TITLE:10:',
'--font','AXIS:7:',
'--font','LEGEND:8:',
'--font','UNIT:7:',
'--font','WATERMARK:7:',
'DEF:a=/home/ubuntu/test2.rrd:in_temp:AVERAGE',
'DEF:b=/home/ubuntu/test2.rrd:out_temp:AVERAGE',
'DEF:c=/home/ubuntu/test2.rrd:in_hic:AVERAGE',
'DEF:d=/home/ubuntu/test2.rrd:out_hic:AVERAGE',
'LINE1:a#1E90FFFF: indoor temperature ',
'GPRINT:a:LAST: Current\:%2.2lf°C',
'GPRINT:a:AVERAGE:Average\:%2.2lf°C',
'GPRINT:a:MAX:Maximum\:%2.2lf°C',
'LINE1:c#87CEEBFF: indoor body feeling ',
'GPRINT:c:LAST: Current\:%2.2lf°C',
'GPRINT:c:AVERAGE:Average\:%2.2lf°C',
'GPRINT:c:MAX:Maximum\:%2.2lf°C',
'LINE1:b#00FF7FFF: outdoor temperature ',
'GPRINT:b:LAST:Current\:%2.2lf°C',
'GPRINT:b:AVERAGE:Average\:%2.2lf°C',
'GPRINT:b:MAX:Maximum\:%2.2lf°C',
'LINE1:d#66CD00FF: outdoor body feeling ',
'GPRINT:d:LAST:Current\:%2.2lf°C',
'GPRINT:d:AVERAGE:Average\:%2.2lf°C',
'GPRINT:d:MAX:Maximum\:%2.2lf°C')
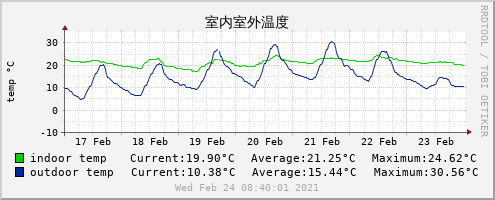
rrdtool.graph(
'/usr/local/nginx/html/images/temp_test-1week.png',
'--start','end-1w',
'--end','00:00',
'--title','Indoor and outdoor temperature',
'--vertical-label','temp °C',
'--alt-autoscale-max',
'--slope-mode',
'--watermark',time.strftime("%a %b %d %H:%M:%S %Y", time.localtime()),
'--lower-limit','-10',
'--font','TITLE:10:',
'--font','AXIS:7:',
'--font','LEGEND:8:',
'--font','UNIT:7:',
'--font','WATERMARK:7:',
'DEF:a=/home/ubuntu/test2.rrd:in_temp:AVERAGE',
'DEF:b=/home/ubuntu/test2.rrd:out_temp:AVERAGE',
'LINE1:a#00CF00FF:indoor temp',
'GPRINT:a:LAST: Current\:%2.2lf°C',
'GPRINT:a:AVERAGE:Average\:%2.2lf°C',
'GPRINT:a:MAX:Maximum\:%2.2lf°C\\n',
'LINE1:b#002A97FF:outdoor temp',
'GPRINT:b:LAST:Current\:%2.2lf°C',
'GPRINT:b:AVERAGE:Average\:%2.2lf°C',
'GPRINT:b:MAX:Maximum\:%2.2lf°C')
rrdtool.graph(
'/usr/local/nginx/html/images/temp_test-1month.png',
'--start','end-1m',
'--end','00:00',
'--title','Indoor and outdoor temperature',
'--vertical-label','temp °C',
'--alt-autoscale-max',
'--slope-mode',
'--watermark',time.strftime("%a %b %d %H:%M:%S %Y", time.localtime()),
'--lower-limit','-10',
'--font','TITLE:10:',
'--font','AXIS:7:',
'--font','LEGEND:8:',
'--font','UNIT:7:',
'--font','WATERMARK:7:',
'DEF:a=/home/ubuntu/test2.rrd:in_temp:AVERAGE',
'DEF:b=/home/ubuntu/test2.rrd:out_temp:AVERAGE',
'LINE1:a#00CF00FF:indoor temp',
'GPRINT:a:LAST: Current\:%2.2lf°C',
'GPRINT:a:AVERAGE:Average\:%2.2lf°C',
'GPRINT:a:MAX:Maximum\:%2.2lf°C\\n',
'LINE1:b#002A97FF:outdoor temp',
'GPRINT:b:LAST:Current\:%2.2lf°C',
'GPRINT:b:AVERAGE:Average\:%2.2lf°C',
'GPRINT:b:MAX:Maximum\:%2.2lf°C')
rrdtool.graph(
'/usr/local/nginx/html/images/temp_test-1year.png',
'--start','end-1y',
'--end','00:00',
'--title','Indoor and outdoor temperature',
'--vertical-label','temp °C',
'--alt-autoscale-max',
'--slope-mode',
'--watermark',time.strftime("%a %b %d %H:%M:%S %Y", time.localtime()),
'--lower-limit','-10',
'--font','TITLE:10:',
'--font','AXIS:7:',
'--font','LEGEND:8:',
'--font','UNIT:7:',
'--font','WATERMARK:7:',
'DEF:a=/home/ubuntu/test2.rrd:in_temp:AVERAGE',
'DEF:b=/home/ubuntu/test2.rrd:out_temp:AVERAGE',
'LINE1:a#00CF00FF:indoor temp',
'GPRINT:a:LAST: Current\:%2.2lf°C',
'GPRINT:a:AVERAGE:Average\:%2.2lf°C',
'GPRINT:a:MAX:Maximum\:%2.2lf°C\\n',
'LINE1:b#002A97FF:outdoor temp',
'GPRINT:b:LAST:Current\:%2.2lf°C',
'GPRINT:b:AVERAGE:Average\:%2.2lf°C',
'GPRINT:b:MAX:Maximum\:%2.2lf°C')
rrdtool.graph(
'/usr/local/nginx/html/images/hum_test-1day.png',
'--title','Indoor and outdoor humidity',
'--vertical-label','hum %',
'--alt-autoscale-max',
'--slope-mode',
'--watermark',time.strftime("%a %b %d %H:%M:%S %Y", time.localtime()),
'--lower-limit','0',
'--font','TITLE:10:',
'--font','AXIS:7:',
'--font','LEGEND:8:',
'--font','UNIT:7:',
'--font','WATERMARK:7:',
'DEF:a=/home/ubuntu/test2.rrd:in_hum:AVERAGE',
'DEF:b=/home/ubuntu/test2.rrd:out_hum:AVERAGE',
'LINE1:a#00CF00FF:indoor hum',
'GPRINT:a:LAST: Current\:%3.2lf%%',
'GPRINT:a:AVERAGE:Average\:%3.2lf%%',
'GPRINT:a:MAX:Maximum\:%3.2lf%%\\n',
'LINE1:b#002A97FF:outdoor hum',
'GPRINT:b:LAST:Current\:%3.2lf%%',
'GPRINT:b:AVERAGE:Average\:%3.2lf%%',
'GPRINT:b:MAX:Maximum\:%3.2lf%%')
rrdtool.graph(
'/usr/local/nginx/html/images/hum_test-1week.png',
'--start','end-1w',
'--end','00:00',
'--title','Indoor and outdoor humidity',
'--vertical-label','hum %',
'--alt-autoscale-max',
'--slope-mode',
'--watermark',time.strftime("%a %b %d %H:%M:%S %Y", time.localtime()),
'--lower-limit','0',
'--font','TITLE:10:',
'--font','AXIS:7:',
'--font','LEGEND:8:',
'--font','UNIT:7:',
'--font','WATERMARK:7:',
'DEF:a=/home/ubuntu/test2.rrd:in_hum:AVERAGE',
'DEF:b=/home/ubuntu/test2.rrd:out_hum:AVERAGE',
'LINE1:a#00CF00FF:indoor hum',
'GPRINT:a:LAST: Current\:%3.2lf%%',
'GPRINT:a:AVERAGE:Average\:%3.2lf%%',
'GPRINT:a:MAX:Maximum\:%3.2lf%%\\n',
'LINE1:b#002A97FF:outdoor hum',
'GPRINT:b:LAST:Current\:%3.2lf%%',
'GPRINT:b:AVERAGE:Average\:%3.2lf%%',
'GPRINT:b:MAX:Maximum\:%3.2lf%%')
rrdtool.graph(
'/usr/local/nginx/html/images/hum_test-1month.png',
'--start','end-1m',
'--end','00:00',
'--title','Indoor and outdoor humidity',
'--vertical-label','hum %',
'--alt-autoscale-max',
'--slope-mode',
'--watermark',time.strftime("%a %b %d %H:%M:%S %Y", time.localtime()),
'--lower-limit','0',
'--font','TITLE:10:',
'--font','AXIS:7:',
'--font','LEGEND:8:',
'--font','UNIT:7:',
'--font','WATERMARK:7:',
'DEF:a=/home/ubuntu/test2.rrd:in_hum:AVERAGE',
'DEF:b=/home/ubuntu/test2.rrd:out_hum:AVERAGE',
'LINE1:a#00CF00FF:indoor hum',
'GPRINT:a:LAST: Current\:%3.2lf%%',
'GPRINT:a:AVERAGE:Average\:%3.2lf%%',
'GPRINT:a:MAX:Maximum\:%3.2lf%%\\n',
'LINE1:b#002A97FF:outdoor hum',
'GPRINT:b:LAST:Current\:%3.2lf%%',
'GPRINT:b:AVERAGE:Average\:%3.2lf%%',
'GPRINT:b:MAX:Maximum\:%3.2lf%%')
rrdtool.graph(
'/usr/local/nginx/html/images/hum_test-1year.png',
'--start','end-1y',
'--end','00:00',
'--title','Indoor and outdoor humidity',
'--vertical-label','hum %',
'--alt-autoscale-max',
'--slope-mode',
'--watermark',time.strftime("%a %b %d %H:%M:%S %Y", time.localtime()),
'--lower-limit','0',
'--font','TITLE:10:',
'--font','AXIS:7:',
'--font','LEGEND:8:',
'--font','UNIT:7:',
'--font','WATERMARK:7:',
'DEF:a=/home/ubuntu/test2.rrd:in_hum:AVERAGE',
'DEF:b=/home/ubuntu/test2.rrd:out_hum:AVERAGE',
'LINE1:a#00CF00FF:indoor hum',
'GPRINT:a:LAST: Current\:%3.2lf%%',
'GPRINT:a:AVERAGE:Average\:%3.2lf%%',
'GPRINT:a:MAX:Maximum\:%3.2lf%%\\n',
'LINE1:b#002A97FF:outdoor hum',
'GPRINT:b:LAST:Current\:%3.2lf%%',
'GPRINT:b:AVERAGE:Average\:%3.2lf%%',
'GPRINT:b:MAX:Maximum\:%3.2lf%%')
rrdtool.graph(
'/usr/local/nginx/html/images/hic_test-1day.png',
'--title','Indoor and outdoor body temperature',
'--vertical-label','hic °C',
'--alt-autoscale-max',
'--slope-mode',
'--watermark',time.strftime("%a %b %d %H:%M:%S %Y", time.localtime()),
'--lower-limit','-10',
'--font','TITLE:10:',
'--font','AXIS:7:',
'--font','LEGEND:8:',
'--font','UNIT:7:',
'--font','WATERMARK:7:',
'DEF:a=/home/ubuntu/test2.rrd:in_hic:AVERAGE',
'DEF:b=/home/ubuntu/test2.rrd:out_hic:AVERAGE',
'LINE1:a#00CF00FF:indoor hic',
'GPRINT:a:LAST: Current\:%2.2lf°C',
'GPRINT:a:AVERAGE:Average\:%2.2lf°C',
'GPRINT:a:MAX:Maximum\:%2.2lf°C\\n',
'LINE1:b#002A97FF:outdoor hic',
'GPRINT:b:LAST:Current\:%2.2lf°C',
'GPRINT:b:AVERAGE:Average\:%2.2lf°C',
'GPRINT:b:MAX:Maximum\:%2.2lf°C')
rrdtool.graph(
'/usr/local/nginx/html/images/hic_test-1week.png',
'--start','end-1w',
'--end','00:00',
'--title','Indoor and outdoor body temperature',
'--vertical-label','hic °C',
'--alt-autoscale-max',
'--slope-mode',
'--watermark',time.strftime("%a %b %d %H:%M:%S %Y", time.localtime()),
'--lower-limit','-10',
'--font','TITLE:10:',
'--font','AXIS:7:',
'--font','LEGEND:8:',
'--font','UNIT:7:',
'--font','WATERMARK:7:',
'DEF:a=/home/ubuntu/test2.rrd:in_hic:AVERAGE',
'DEF:b=/home/ubuntu/test2.rrd:out_hic:AVERAGE',
'LINE1:a#00CF00FF:indoor hic',
'GPRINT:a:LAST: Current\:%2.2lf°C',
'GPRINT:a:AVERAGE:Average\:%2.2lf°C',
'GPRINT:a:MAX:Maximum\:%2.2lf°C\\n',
'LINE1:b#002A97FF:outdoor hic',
'GPRINT:b:LAST:Current\:%2.2lf°C',
'GPRINT:b:AVERAGE:Average\:%2.2lf°C',
'GPRINT:b:MAX:Maximum\:%2.2lf°C')
rrdtool.graph(
'/usr/local/nginx/html/images/hic_test-1month.png',
'--start','end-1m',
'--end','00:00',
'--title','Indoor and outdoor body temperature',
'--vertical-label','hic °C',
'--alt-autoscale-max',
'--slope-mode',
'--watermark',time.strftime("%a %b %d %H:%M:%S %Y", time.localtime()),
'--lower-limit','-10',
'--font','TITLE:10:',
'--font','AXIS:7:',
'--font','LEGEND:8:',
'--font','UNIT:7:',
'--font','WATERMARK:7:',
'DEF:a=/home/ubuntu/test2.rrd:in_hic:AVERAGE',
'DEF:b=/home/ubuntu/test2.rrd:out_hic:AVERAGE',
'LINE1:a#00CF00FF:indoor hic',
'GPRINT:a:LAST: Current\:%2.2lf°C',
'GPRINT:a:AVERAGE:Average\:%2.2lf°C',
'GPRINT:a:MAX:Maximum\:%2.2lf°C\\n',
'LINE1:b#002A97FF:outdoor hic',
'GPRINT:b:LAST:Current\:%2.2lf°C',
'GPRINT:b:AVERAGE:Average\:%2.2lf°C',
'GPRINT:b:MAX:Maximum\:%2.2lf°C')
rrdtool.graph(
'/usr/local/nginx/html/images/hic_test-1year.png',
'--start','end-1y',
'--end','00:00',
'--title','Indoor and outdoor body temperature',
'--vertical-label','hic °C',
'--alt-autoscale-max',
'--slope-mode',
'--watermark',time.strftime("%a %b %d %H:%M:%S %Y", time.localtime()),
'--lower-limit','-10',
'--font','TITLE:10:',
'--font','AXIS:7:',
'--font','LEGEND:8:',
'--font','UNIT:7:',
'--font','WATERMARK:7:',
'DEF:a=/home/ubuntu/test2.rrd:in_hic:AVERAGE',
'DEF:b=/home/ubuntu/test2.rrd:out_hic:AVERAGE',
'LINE1:a#00CF00FF:indoor hic',
'GPRINT:a:LAST: Current\:%2.2lf°C',
'GPRINT:a:AVERAGE:Average\:%2.2lf°C',
'GPRINT:a:MAX:Maximum\:%2.2lf°C\\n',
'LINE1:b#002A97FF:outdoor hic',
'GPRINT:b:LAST:Current\:%2.2lf°C',
'GPRINT:b:AVERAGE:Average\:%2.2lf°C',
'GPRINT:b:MAX:Maximum\:%2.2lf°C')
Add a task in the system cron, execute the script every 5 minutes, and generate the rrd diagram.
*/5 * * * * sudo python3 /home/ubuntu/rrdtool_graph.py >> /tmp/temp_hum_rrdtool_graph.log 2>&1
Create a new index in the html root directory of nginx html file, put the generated rrd graph into the html page, so that you can view the graph through the web page.
<!DOCTYPE HTML PUBLIC "-//W3C//DTD HTML 4.01//EN" "http://www.w3.org/TR/html4/strict.dtd">

<html>

<head>

<meta http-equiv="Content-Type" content="text/html;charset=UTF-8">
<meta http-equiv="Expires" content="0">
<meta http-equiv="Pragma" content="no-cache">
<meta http-equiv="Cache-control" content="no-cache">
<meta http-equiv="Cache" content="no-cache">
<meta http-equiv="refresh" content="300">
<title>Temperature and humidity monitoring</title>

</head>

<body>
<table>
    <tr>
        <td>
			<img src="images/temp_test-1day.png" alt="1day">
			1day
			</br>
			<img src="images/temp_test-1week.png" alt="1week">
			1week
			</br>
			<img src="images/temp_test-1month.png" alt="1month">
			1month
			</br>
			<img src="images/temp_test-1year.png" alt="1year">
			1year
		</td>
        <td>
			<img src="images/hum_test-1day.png" alt="1day">
			1day
			</br>
			<img src="images/hum_test-1week.png" alt="1week">
			1week
			</br>
			<img src="images/hum_test-1month.png" alt="1month">
			1month
			</br>
			<img src="images/hum_test-1year.png" alt="1year">
			1year
		</td>
        <td>
			<img src="images/hic_test-1day.png" alt="1day">
			1day
			</br>
			<img src="images/hic_test-1week.png" alt="1week">
			1week
			</br>
			<img src="images/hic_test-1month.png" alt="1month">
			1month
			</br>
			<img src="images/hic_test-1year.png" alt="1year">
			1year
		</td>
    </tr>
</table>

</body>

</html>
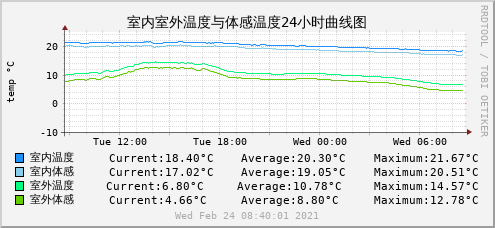
Program preview:
In the next article, we will transform this system and use Bosch bme280 sensor to replace DHT22 sensor. Through bme280 sensor, we can also get atmospheric pressure data. The development board is changed to ESP8266, the data output from the original serial port is changed to wifi connection, the data is published to mqtt broker in the form of mqtt, and domoticz is used to subscribe to this topic, so as to achieve the purpose of transmitting sensor data into domoticz.