1, Introduction
EMG is a method of recording the electrical activity of muscle at rest or contraction with electronic instruments, and examining the excitation and conduction function of nerve and muscle with electrical stimulation. EMG for short. Through this examination, the functional state of peripheral nerve, neuron, neuromuscular junction and muscle itself can be determined.
By measuring the time limit and amplitude of motor unit potential, whether there is spontaneous electrical activity under quiet conditions, and the wave pattern and amplitude of muscle vigorous contraction, neurogenic damage and myogenic damage can be distinguished, and acute and chronic damage of anterior horn of spinal cord (such as anterior poliomyelitis and motor neuron disease) can be diagnosed, Nerve root and peripheral neuropathy (for example, electromyography can help determine the location, degree, scope and prognosis of nerve injury). In addition, it also has diagnostic value for entrapment neuropathy, neuritis, genetic metabolic disorder, neuropathy and various muscle diseases. In addition, EMG is also used to track the recovery process and curative effect of various diseases during the treatment of various diseases.
Using computer technology, automatic analysis of electromyography can be made, such as analytical electromyography, single fiber electromyography and giant electromyography, so as to improve the positive rate of diagnosis.
Needle electrode and electric stimulation technology are often used in electromyography examination. There is certain pain and injury in the examination process. Therefore, unless necessary, this examination should not be abused. In addition, the examination requires that the muscles can be completely relaxed or exert varying degrees of force, so the subject is required to cooperate fully. For some examinations, the drugs should be stopped before the examination. For example, neostigmine drugs should be stopped 16 hours before the examination
The curve (electrogram) that records muscle action potential is called electromyography. Abbreviated as EMG. There are two kinds of tracing methods actually used: one is the surface derivation method, that is, the method of attaching the electrode to the skin to derive the potential; The other is the needle electrode method, that is, the needle electrode is inserted into the muscle to derive the local potential. The latter method can record the muscle action potential each time, and the abnormal frequency can be found according to the muscle action potential from several times to 20 or 30 times per second. Electromyography can also be used to diagnose the causes of motor dysfunction. The needle electrode commonly used is called concentric electrode. It is made by passing the thin needle electrode through the center of the injection needle and insulating and fixing the two.
2, Source code
%% Program Start
%%%%%%%%%%%%%%%%%%%%%%%%%%%%%%%%%%%%%%%%%%%%%%%%%%%%%%%%%%%%%%%%%%%%%%%%%%%%%%%%%%%%%%%%%%%%%%%%%%%%%%%%%%%%%%%%%%%%%%%%%%
%% Name: signal processing course design
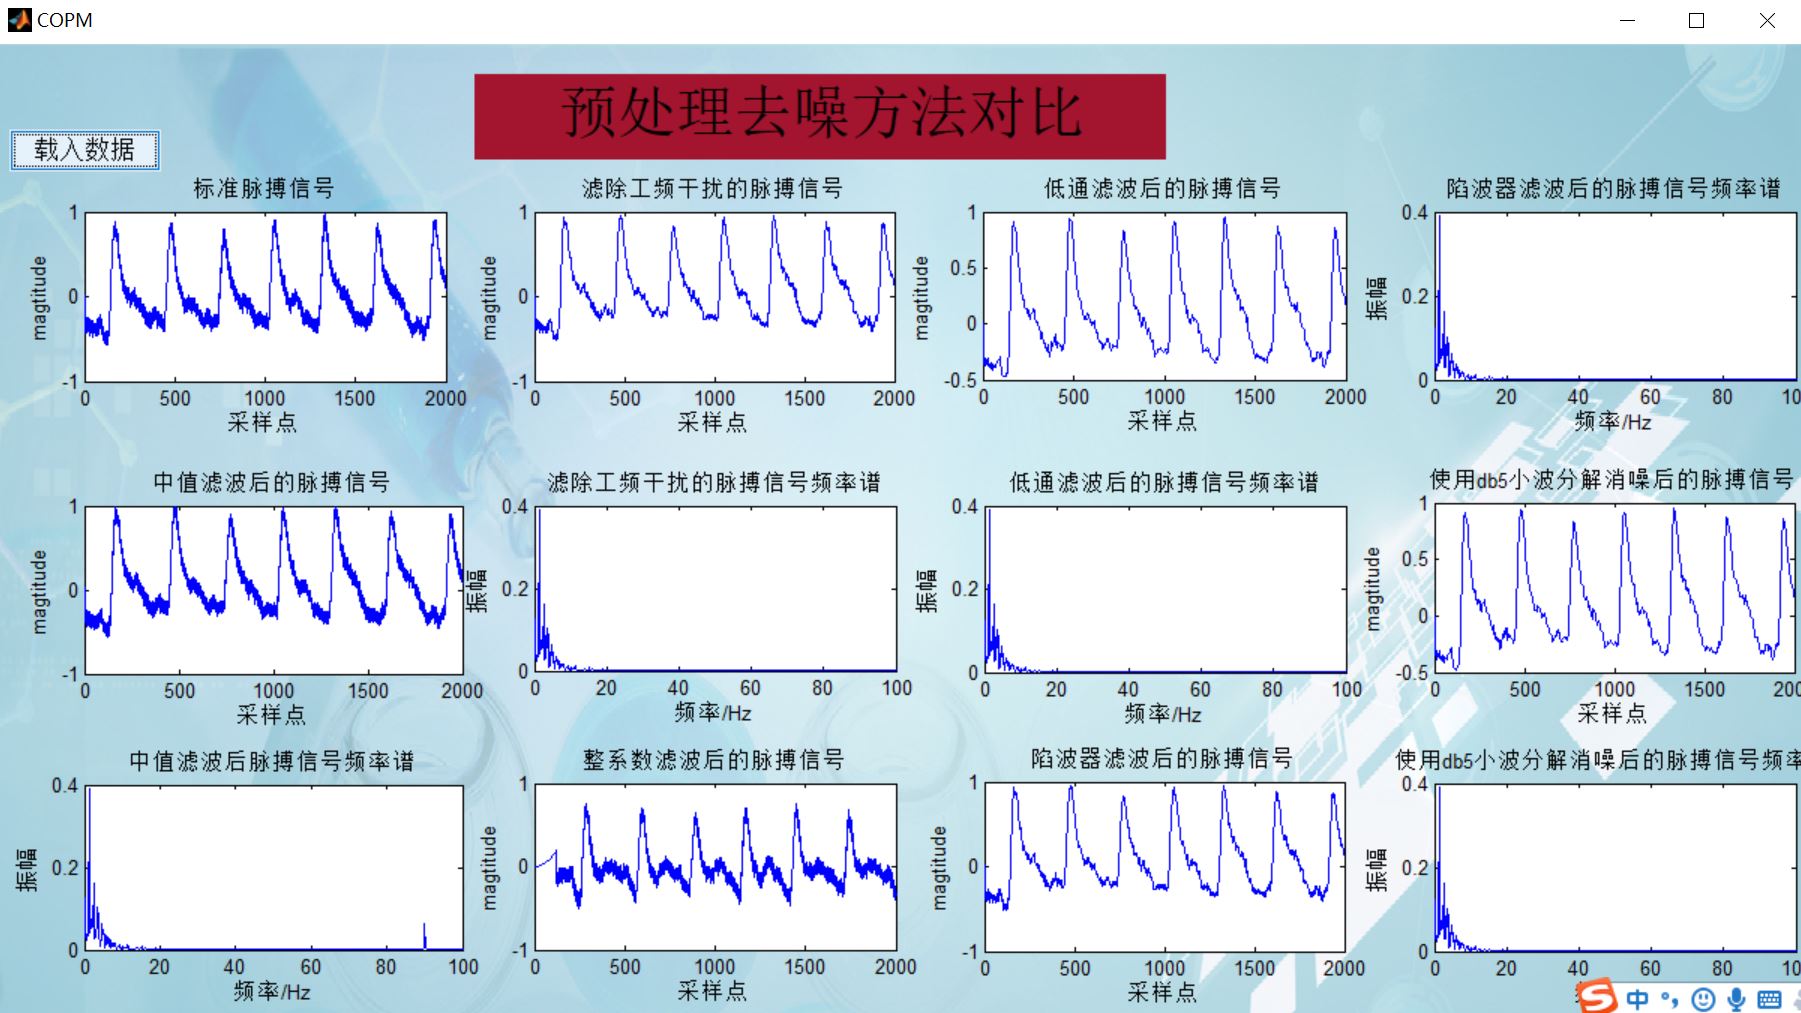
%% Function: pulse detection system GUI main interface
%%
%%%%%%%%%%%%%%%%%%%%%%%%%%%%%%%%%%%%%%%%%%%%%%%%%%%%%%%%%%%%%%%%%%%%%%%%%%%%%%%%%%%%%%%%%%%%%%%%%%%
%%%%%%%%%%%%%%%%%%%%%%%%%%%%%%%%%%%%%%%%%%%%%%%%%%%%%%%%%%%%%%%%%%%%%%%%%%%%%%%%%%%%%%%%%%%%%%%%%%%
%%
function varargout = mainjiemian(varargin)
% MAINJIEMIAN MATLAB code for mainjiemian.fig
% MAINJIEMIAN, by itself, creates a new MAINJIEMIAN or raises the existing
% singleton*.
%
% H = MAINJIEMIAN returns the handle to a new MAINJIEMIAN or the handle to
% the existing singleton*.
%
% MAINJIEMIAN('CALLBACK',hObject,eventData,handles,...) calls the local
% function named CALLBACK in MAINJIEMIAN.M with the given input arguments.
%
% MAINJIEMIAN('Property','Value',...) creates a new MAINJIEMIAN or raises the
% existing singleton*. Starting from the left, property value pairs are
% applied to the GUI before mainjiemian_OpeningFcn gets called. An
% unrecognized property name or invalid value makes property application
% stop. All inputs are passed to mainjiemian_OpeningFcn via varargin.
%
% *See GUI Options on GUIDE's Tools menu. Choose "GUI allows only one
% instance to run (singleton)".
%
% See also: GUIDE, GUIDATA, GUIHANDLES
% Edit the above text to modify the response to help mainjiemian
% Last Modified by GUIDE v2.5 29-Apr-2021 12:18:07
% Begin initialization code - DO NOT EDIT
gui_Singleton = 1;
gui_State = struct('gui_Name', mfilename, ...
'gui_Singleton', gui_Singleton, ...
'gui_OpeningFcn', @mainjiemian_OpeningFcn, ...
'gui_OutputFcn', @mainjiemian_OutputFcn, ...
'gui_LayoutFcn', [] , ...
'gui_Callback', []);
if nargin && ischar(varargin{1})
gui_State.gui_Callback = str2func(varargin{1});
end
if nargout
[varargout{1:nargout}] = gui_mainfcn(gui_State, varargin{:});
else
gui_mainfcn(gui_State, varargin{:});
end
% End initialization code - DO NOT EDIT
% --- Executes just before mainjiemian is made visible.
function mainjiemian_OpeningFcn(hObject, eventdata, handles, varargin)
% This function has no output args, see OutputFcn.
% hObject handle to figure
% eventdata reserved - to be defined in a future version of MATLAB
% handles structure with handles and user data (see GUIDATA)
% varargin command line arguments to mainjiemian (see VARARGIN)
% Choose default command line output for mainjiemian
handles.output = hObject;
ha=axes('units','normalized','position',[0 0 1 1]);
uistack(ha,'down')
II=imread('1.jpg');
image(II)
colormap gray
set(ha,'handlevisibility','off','visible','off');
% Update handles structure
% Update handles structure
guidata(hObject, handles);
% UIWAIT makes mainjiemian wait for user response (see UIRESUME)
% uiwait(handles.figure1);
% --- Outputs from this function are returned to the command line.
function varargout = mainjiemian_OutputFcn(hObject, eventdata, handles)
% varargout cell array for returning output args (see VARARGOUT);
% hObject handle to figure
% eventdata reserved - to be defined in a future version of MATLAB
% handles structure with handles and user data (see GUIDATA)
% Get default command line output from handles structure
varargout{1} = handles.output;
% --- Executes on button press in togglebutton1.
function togglebutton1_Callback(hObject, eventdata, handles)
untitled;
% hObject handle to togglebutton1 (see GCBO)
% eventdata reserved - to be defined in a future version of MATLAB
% handles structure with handles and user data (see GUIDATA)
% Hint: get(hObject,'Value') returns toggle state of togglebutton1
% --- Executes on button press in togglebutton2.
function togglebutton2_Callback(hObject, eventdata, handles)
yuchuli;
% hObject handle to togglebutton2 (see GCBO)
% eventdata reserved - to be defined in a future version of MATLAB
% handles structure with handles and user data (see GUIDATA)
% Hint: get(hObject,'Value') returns toggle state of togglebutton2
% --- Executes on button press in togglebutton3.
function togglebutton3_Callback(hObject, eventdata, handles)
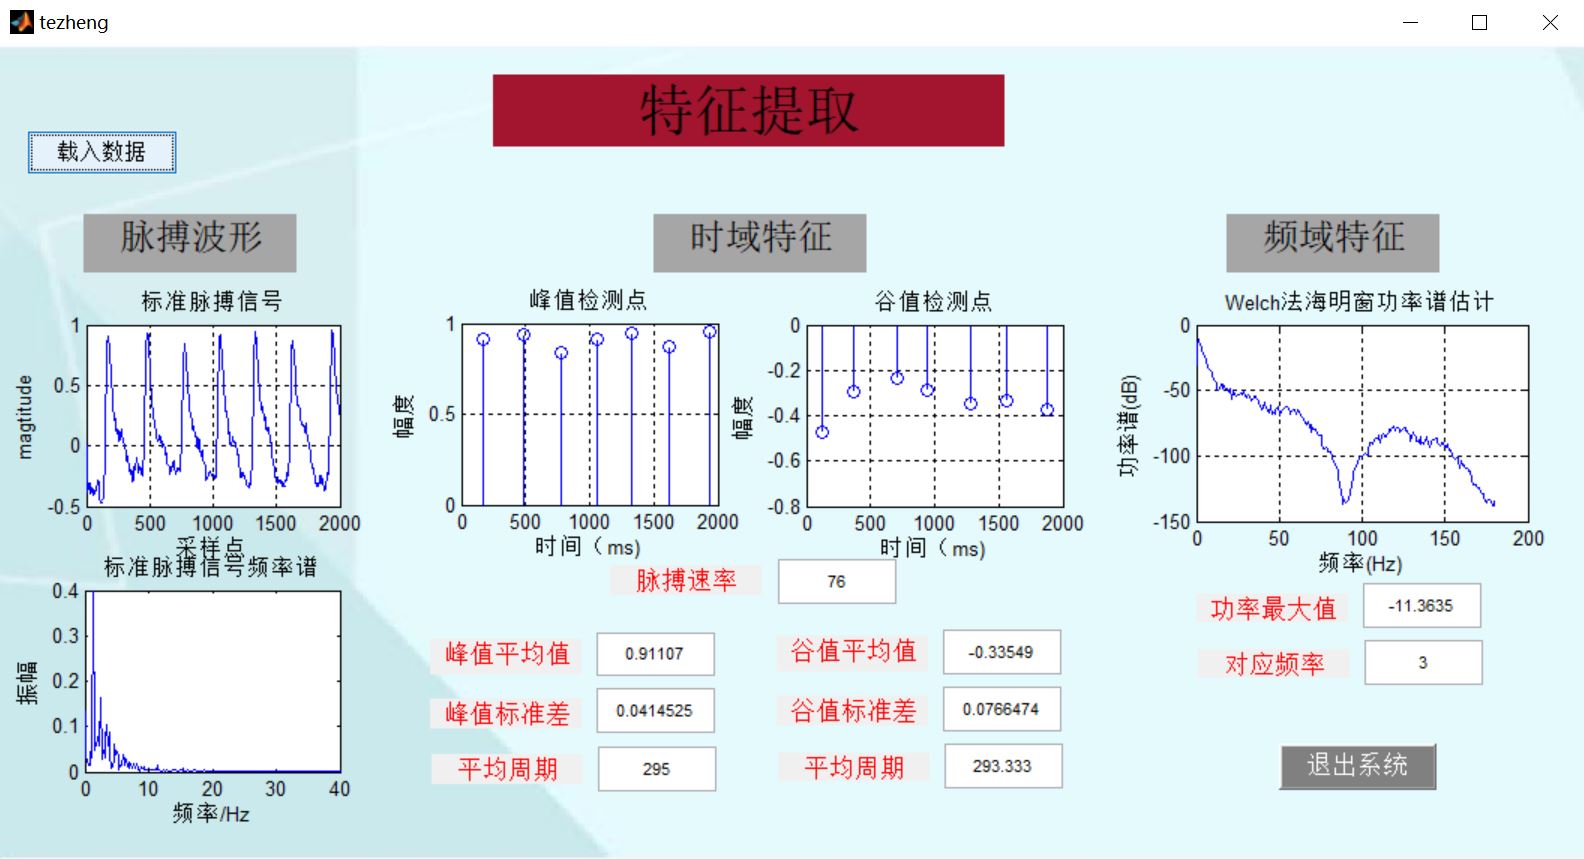
tezheng;
% hObject handle to togglebutton3 (see GCBO)
% eventdata reserved - to be defined in a future version of MATLAB
% handles structure with handles and user data (see GUIDATA)
% Hint: get(hObject,'Value') returns toggle state of togglebutton3
% --- Executes when figure1 is resized.
function figure1_SizeChangedFcn(hObject, eventdata, handles)
% hObject handle to figure1 (see GCBO)
% eventdata reserved - to be defined in a future version of MATLAB
% handles structure with handles and user data (see GUIDATA)
if nargout
[varargout{1:nargout}] = gui_mainfcn(gui_State, varargin{:});
else
gui_mainfcn(gui_State, varargin{:});
end
% End initialization code - DO NOT EDIT
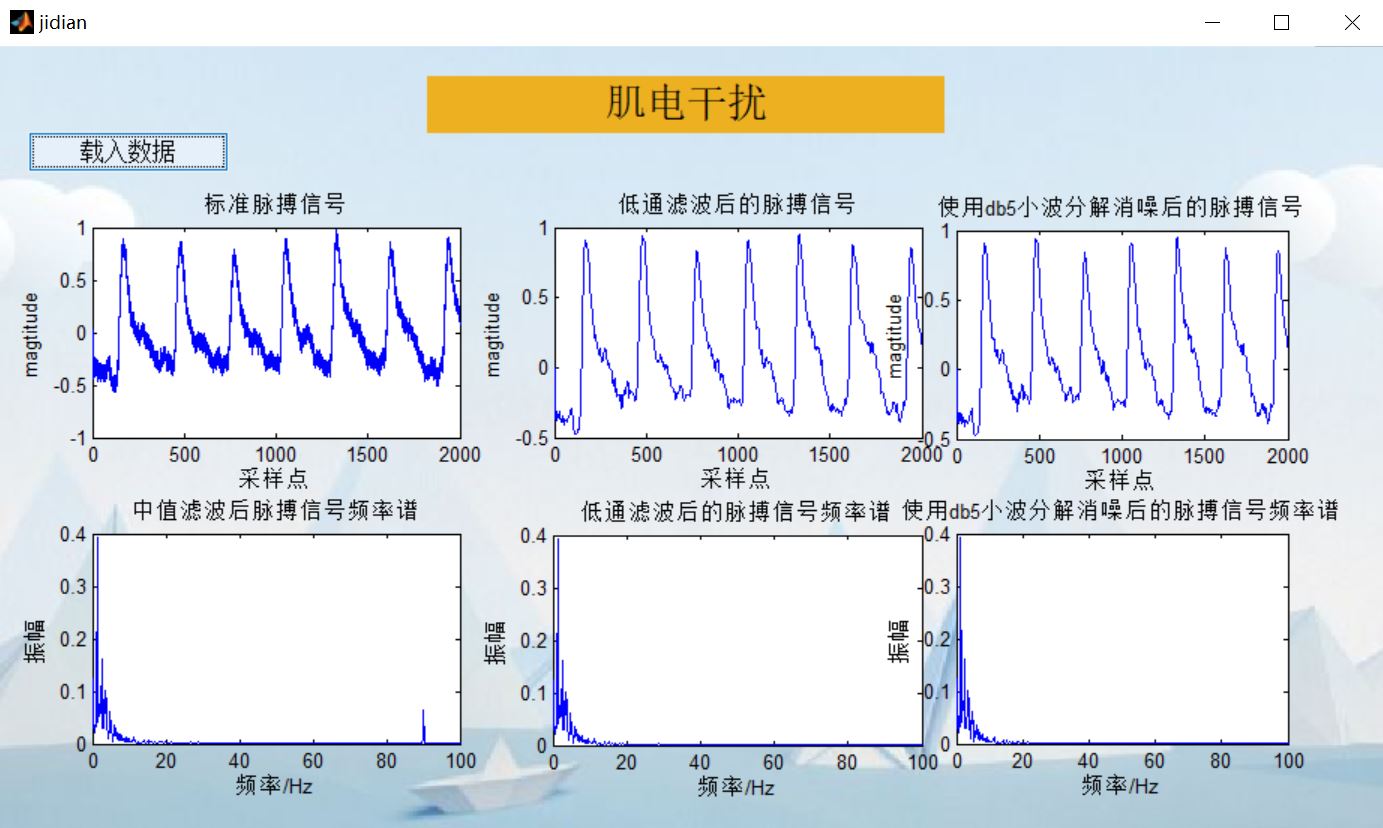
% --- Executes just before jidian is made visible.
function jidian_OpeningFcn(hObject, eventdata, handles, varargin)
% This function has no output args, see OutputFcn.
% hObject handle to figure
% eventdata reserved - to be defined in a future version of MATLAB
% handles structure with handles and user data (see GUIDATA)
% varargin command line arguments to jidian (see VARARGIN)
% Choose default command line output for jidian
handles.output = hObject;
ha=axes('units','normalized','position',[0 0 1 1]);
uistack(ha,'down')
II=imread('666.jpg');
image(II)
colormap gray
set(ha,'handlevisibility','off','visible','off');
axes(handles.axes1);
axes(handles.axes2);
axes(handles.axes3);
axes(handles.axes4);
axes(handles.axes5);
axes(handles.axes6);
% Update handles structure
guidata(hObject, handles);
% UIWAIT makes jidian wait for user response (see UIRESUME)
% uiwait(handles.figure1);
% --- Outputs from this function are returned to the command line.
function varargout = jidian_OutputFcn(hObject, eventdata, handles)
% varargout cell array for returning output args (see VARARGOUT);
% hObject handle to figure
% eventdata reserved - to be defined in a future version of MATLAB
% handles structure with handles and user data (see GUIDATA)
% Get default command line output from handles structure
varargout{1} = handles.output;
% --- Executes when figure1 is resized.
function figure1_SizeChangedFcn(hObject, eventdata, handles)
% hObject handle to figure1 (see GCBO)
% eventdata reserved - to be defined in a future version of MATLAB
% handles structure with handles and user data (see GUIDATA)
% --- Executes on button press in pushbutton1.
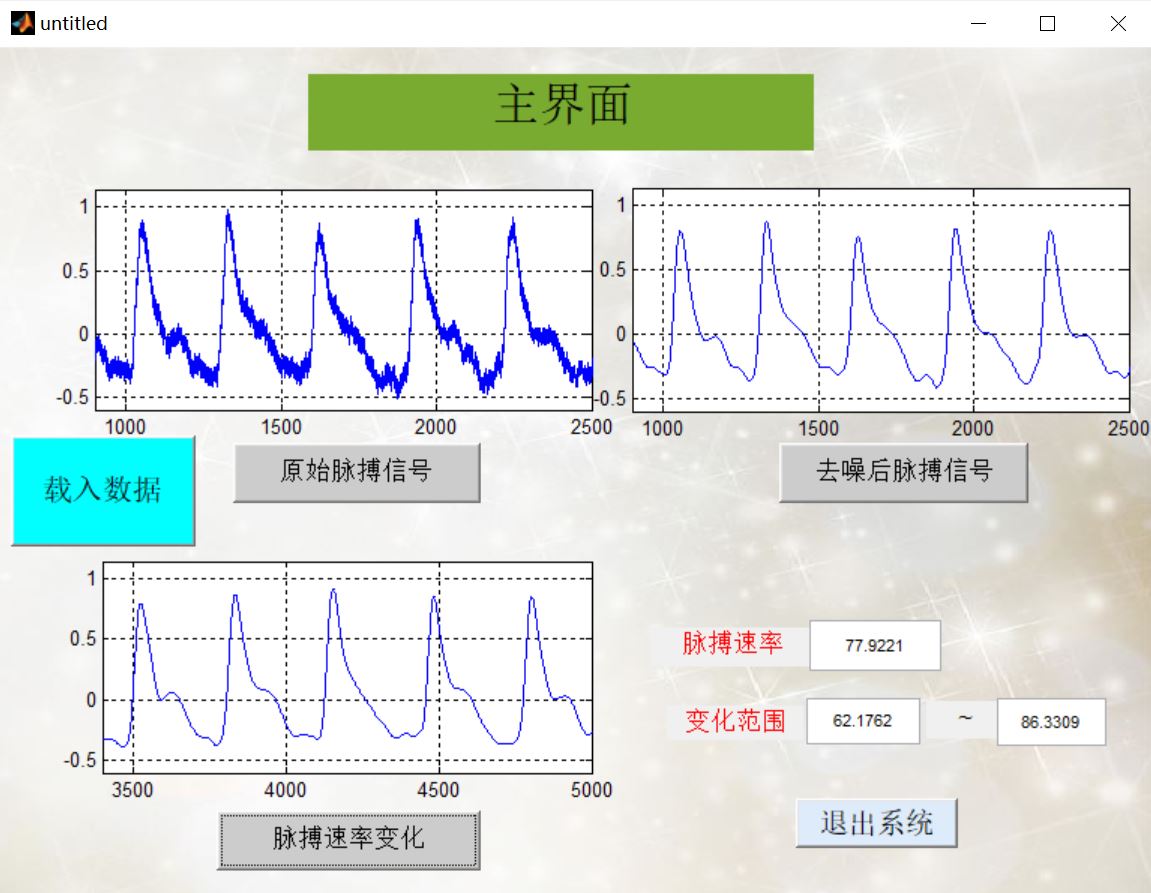
function pushbutton1_Callback(hObject, eventdata, handles)
%%%%%Put the code here and load it automatically at run time
[filename,filepath]=uigetfile('C:\Users\dell\Desktop\Signal processing course design-----Yang Shuo\Initial pulse data\MaiBobefore.txt');
filename=[filepath,filename];
[t,Pluse_pre]=textread(filename,'%f%f','headerlines',1);%Read in 2 floating-point values and skip line 1 of the document
[m,n]=size(Pluse_pre);
n=3;
s3=Pluse_pre;
%%%%%%%%%%%%--—Extract 2000 points for data processing——————%%%%%%%%%%%%%%%%%%%%
fs=360;%sampling rate
x0=s3(1:2000);%Take 1 to 2000 points in total
t=1:length(x0);%length(x0)finger x0 Number of array elements
axes(handles.axes1);
plot(t,x0)
xlabel('Sampling point');
ylabel('magtitude');
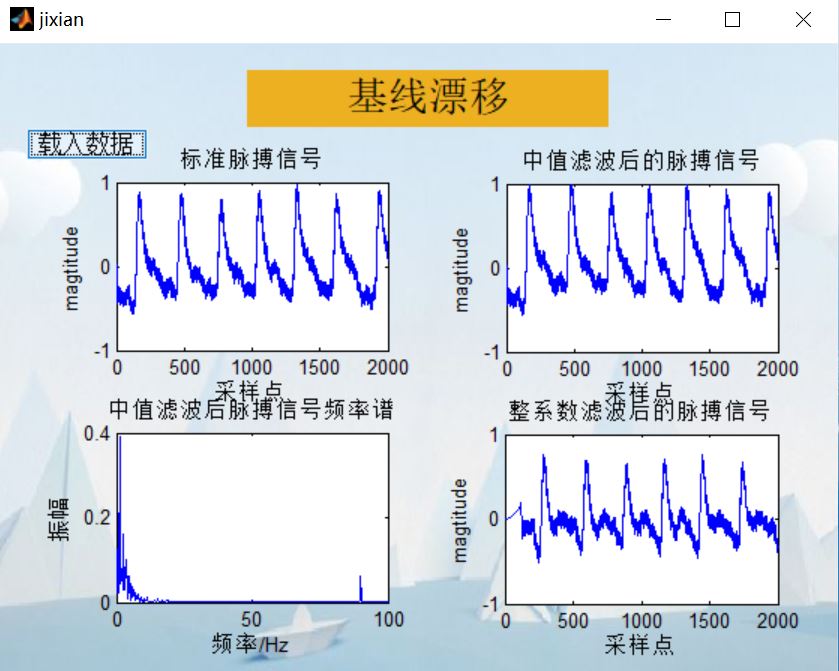
title('Standard pulse signal')
box1=msgbox('Loading, please wait','Tips');
%%%%%%%%%%%%%%%%%%%%%%%%%%%%Preliminary removal of baseline drift%%%%%%%%%%%%%%%%%%%%%%%%%%%%%%%%
%%%%%%%%%%%%%%%%%%%%%%%%%%%%%%%%%%%%%%%median filtering %%%%%%%%%%%%%%%%%%%%%%%%%%%%
L1=medfilt1(x0,330); %One dimensional median filter, x0 Is an array, that is, to process the original waveform, n Is the parameter of median filter, L1 Is the result of filtering (array)
L2=x0-L1;
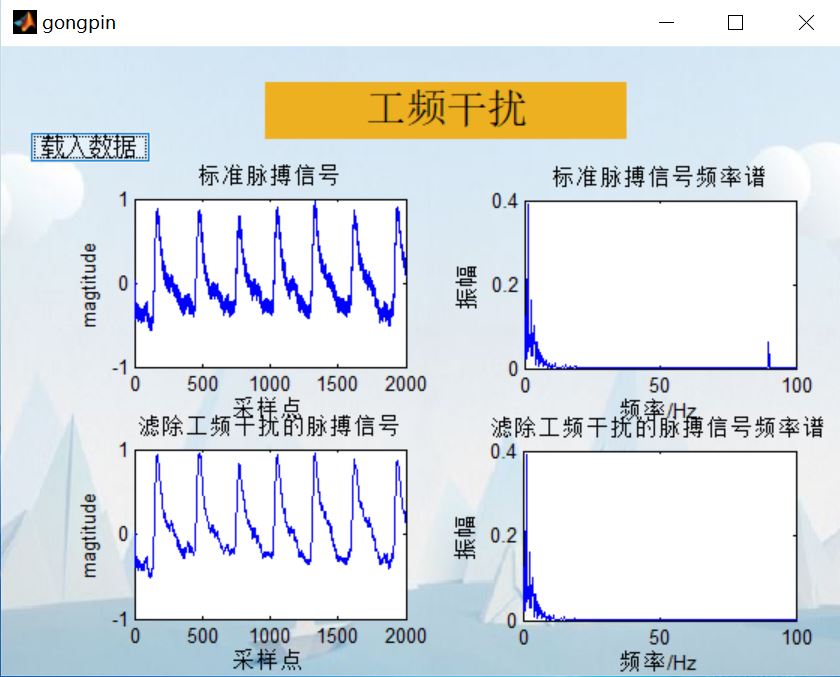
%%%%%%%%%%%%%%%%%%%%%%%%%%%%%%%%%spectrum%%%%%%%%%%%%%%%%%%%%%%%%
N=length(x0);%Number of samples
df=fs/(N-1);%resolving power
f=(0:N-1)*df;%Frequency of each point
Y=fft(L2(1:N))/N*2;%True amplitude
axes(handles.axes2);
plot(f(1:N/2),abs(Y(1:N/2)));%The spectrum after Fourier transform is symmetrical. It takes half here
xlabel('frequency/Hz');
ylabel('amplitude');
axis ( [0 100 0 0.4] );
title('Frequency spectrum of pulse signal after median filtering')
drawnow;
3, Operation results
4, Remarks
Complete code or write on behalf of QQ 1564658423