1. Data set introduction
ERA5 Daily Aggregates - Latest Climate Reanalysis Produced by ECMWF / Copernicus Climate Change Service
ERA5 daily summary - latest climate reanalysis produced by ECMWF / Copernicus Climate Change Service
ERA5 is the fifth generation ECMWF atmospheric reanalysis of global climate. Reanalysis combines model data with observations from around the world into a global complete and consistent data set. ERA5 replaces its predecessor era interim reanalysis.
ERA5 DAILY provides a summary of seven ERA5 climate reanalysis parameters every day: 2m air temperature, 2m dew point temperature, total precipitation, average sea level pressure, surface pressure, u component of 10m wind and 10m wind component. In addition, the minimum and maximum temperatures at 2m per day are calculated based on the hourly temperature data. The daily total precipitation value is given in the form of daily sum. All other parameters are provided as daily averages.
ERA5 data can be obtained in real time from 1979 to three months. More information and more ERA5 atmospheric parameters can be found in Copernicus climate data storage Found in.
Provider Description: the daily summary is calculated according to the ERA5 hour value of each parameter.
Related introduction:
- ERA5 is the most commonly used reanalysis product of meteorological ocean, and it is the fifth generation atmospheric reanalysis of global climate by ECMWF. At present, the numerical prediction results of ECMWF are recognized as the world leader, largely because of its advanced data assimilation system. Reanalysis of data is to use the method of data assimilation to combine the model data with the observation data from all over the world to form a global complete and consistent data set.
- Currently, the ERA5 dataset consists of ERA5, ERA5 1 and ERA5 land. ERA5 replaces era interim reanalysis data.
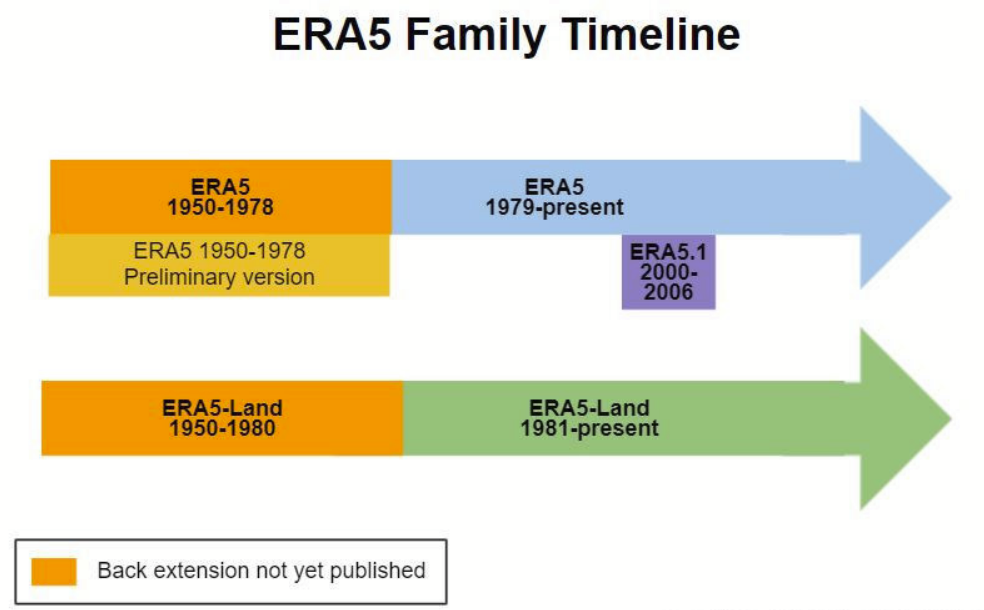
- ERA5 is a comprehensive reanalysis data, with a time span from 1979 (which will soon be traced back to 1950) to near real time. It assimilates as many observation data as possible in the upper atmosphere and near earth surface. ERA5 atmospheric model is coupled with land surface model and wave model.
- ERA5 support extension (preliminary version): at present, the data from 1950 to 1978 can be obtained, which is separated from ERA5 (1979 to now). As soon as possible, the quality of the data set is quite satisfactory in many aspects, but it shows that it is affected by tropical cyclones, sometimes very violently. To solve this problem, the currently released support extension is only a preliminary version until ERA51950 to near real-time version update release.
- ERA5.1: It is aimed at the rerun version of era5 from 2000 to 2006. In order to improve era5, the lower tropospheric boundary cold deviation is obvious during this period. The characteristics of era5 in most tropospheres are similar to that of era5 1 similar.
- ERA5 land: it is a land surface data set with a time span from 1981 (soon dating back to 1950) to now (nearly 2 months missing), providing higher resolution (9km) and driven by ERA5 atmospheric parameters corrected by temperature gradient, but without additional data assimilation.
- Era5 land is a reanalysis data set produced by ECMWF ERA5 reanalysis model. The model combines observation data from all over the world into a global complete and consistent data set through physical laws. The data set includes monthly dynamic data representing 50 indicators of temperature, lake, snow, soil moisture, radiation and heat, evapotranspiration and runoff, wind speed, air pressure, precipitation and vegetation since 1981, with a spatial resolution of 0.1 ° × 0.1 ° (about 9 °) × 9 km2 grid), which can accurately describe the past climate conditions.
- Generally, the ERA5 data set is obtained through CDS. The complete data set is archived on ECMWF tape (MARS), but some data subsets in specific longitude and latitude (all ERA5 land data) have been modified and put into CDS disk. Obtaining data through CDS is faster than Mars, so CSD disk is used to obtain data when conditions permit.
2. Data set band
| name | Company | minimum value | Maximum | describe |
|---|---|---|---|---|
| mean_2m_air_temperature | ķ | 223.6* | 304* | Average temperature at 2m height (daily average) |
| minimum_2m_air_temperature | ķ | 220.7* | 300.8* | Minimum temperature at 2m height (daily minimum) |
| maximum_2m_air_temperature | ķ | 225.8* | 310.2* | Maximum temperature at 2m height (daily maximum) |
| dewpoint_2m_temperature | ķ | 219.3* | 297.8* | Dew point temperature at 2m height (daily average) |
| total_precipitation | rice | 0* | 0.02* | Total precipitation (daily sum) |
| surface_pressure | PA | 65639* | 102595* | Surface pressure (daily average) |
| mean_sea_level_pressure | PA | 97657.4* | 103861* | Mean sea level pressure (daily average) |
| u_component_of_wind_10m | Meter second-1 | -11.4* | 11.4* | u component of 10m wind (daily average) |
| v_component_of_wind_10m | Meter second-1 | -10.1* | 10.1* | v component of 10m wind (daily average) |
3. GEE data loading and use
(1) JavaScript code
// Example script to load and visualize ERA5 climate reanalysis parameters in
// Google Earth Engine

// Daily mean 2m air temperature
var era5_2mt = ee.ImageCollection('ECMWF/ERA5/DAILY')
                   .select('mean_2m_air_temperature')
                   .filter(ee.Filter.date('2019-07-01', '2019-07-31'));
print(era5_2mt);

// Daily total precipitation sums
var era5_tp = ee.ImageCollection('ECMWF/ERA5/DAILY')
                  .select('total_precipitation')
                  .filter(ee.Filter.date('2019-07-01', '2019-07-31'));

// Daily mean 2m dewpoint temperature
var era5_2d = ee.ImageCollection('ECMWF/ERA5/DAILY')
                  .select('dewpoint_2m_temperature')
                  .filter(ee.Filter.date('2019-07-01', '2019-07-31'));

// Daily mean sea-level pressure
var era5_mslp = ee.ImageCollection('ECMWF/ERA5/DAILY')
                    .select('mean_sea_level_pressure')
                    .filter(ee.Filter.date('2019-07-01', '2019-07-31'));

// Daily mean surface pressure
var era5_sp = ee.ImageCollection('ECMWF/ERA5/DAILY')
                  .select('surface_pressure')
                  .filter(ee.Filter.date('2019-07-01', '2019-07-31'));

// Daily mean 10m u-component of wind
var era5_u_wind_10m = ee.ImageCollection('ECMWF/ERA5/DAILY')
                          .select('u_component_of_wind_10m')
                          .filter(ee.Filter.date('2019-07-01', '2019-07-31'));

// Convert pressure levels from Pa to hPa - Example for surface pressure
var era5_sp = era5_sp.map(function(image) {
  return image.divide(100).set(
      'system:time_start', image.get('system:time_start'));
});

// Visualization palette for total precipitation
var visTp = {
  min: 0,
  max: 0.1,
  palette: ['#FFFFFF', '#00FFFF', '#0080FF', '#DA00FF', '#FFA400', '#FF0000']
};

// Visualization palette for temperature (mean, min and max) and 2m dewpoint
// temperature
var vis2mt = {
  min: 250,
  max: 320,
  palette: [
    '#000080', '#0000D9', '#4000FF', '#8000FF', '#0080FF', '#00FFFF', '#00FF80',
    '#80FF00', '#DAFF00', '#FFFF00', '#FFF500', '#FFDA00', '#FFB000', '#FFA400',
    '#FF4F00', '#FF2500', '#FF0A00', '#FF00FF'
  ]
};

// Visualization palette for u- and v-component of 10m wind
var visWind = {
  min: 0,
  max: 30,
  palette: [
    '#FFFFFF', '#FFFF71', '#DEFF00', '#9EFF00', '#77B038', '#007E55', '#005F51',
    '#004B51', '#013A7B', '#023AAD'
  ]
};

// Visualization palette for pressure (surface pressure, mean sea level
// pressure) - adjust min and max values for mslp to min:990 and max:1050
var visPressure = {
  min: 500,
  max: 1150,
  palette: [
    '#01FFFF', '#058BFF', '#0600FF', '#DF00FF', '#FF00FF', '#FF8C00', '#FF8C00'
  ]
};


// Add layer to map
Map.addLayer(
    era5_tp.filter(ee.Filter.date('2019-07-15')), visTp,
    'Daily total precipitation sums');
Map.addLayer(
    era5_2d.filter(ee.Filter.date('2019-07-15')), vis2mt,
    'Daily mean 2m dewpoint temperature');
Map.addLayer(
    era5_2mt.filter(ee.Filter.date('2019-07-15')), vis2mt,
    'Daily mean 2m air temperature');
Map.addLayer(
    era5_u_wind_10m.filter(ee.Filter.date('2019-07-15')), visWind,
    'Daily mean 10m u-component of wind');
Map.addLayer(
    era5_sp.filter(ee.Filter.date('2019-07-15')), visPressure,
    'Daily mean surface pressure');

Map.setCenter(21.2, 22.2, 2);
(2) python code
# Loading ERA5 climate reanalysis data instance in GEE
# Daily mean 2m air temperature
era5_2mt = ee.ImageCollection('ECMWF/ERA5/DAILY') \
.select('mean_2m_air_temperature') \
.filter(ee.Filter.date('2019-07-01', '2019-07-31'))
# print(era5_2mt)
# Daily total precipitation sums
era5_tp = ee.ImageCollection('ECMWF/ERA5/DAILY') \
.select('total_precipitation') \
.filter(ee.Filter.date('2019-07-01', '2019-07-31'))
# Daily mean 2m dew point temperature
era5_2d = ee.ImageCollection('ECMWF/ERA5/DAILY') \
.select('dewpoint_2m_temperature') \
.filter(ee.Filter.date('2019-07-01', '2019-07-31'))
# Daily mean sea level pressure
era5_mslp = ee.ImageCollection('ECMWF/ERA5/DAILY') \
.select('mean_sea_level_pressure') \
.filter(ee.Filter.date('2019-07-01', '2019-07-31'))
# Daily mean surface pressure
era5_sp = ee.ImageCollection('ECMWF/ERA5/DAILY') \
.select('surface_pressure') \
.filter(ee.Filter.date('2019-07-01', '2019-07-31'))
# Daily mean 10m u-component of wind
era5_u_wind_10m = ee.ImageCollection('ECMWF/ERA5/DAILY') \
.select('u_component_of_wind_10m') \
.filter(ee.Filter.date('2019-07-01', '2019-07-31'))
# Convert pressure levels from Pa to hPa - Example for surface pressure
# Convert the air pressure unit from Pa to hPa
def func_xtx(image):
return image.divide(100).set(
'system:time_start', image.get('system:time_start'))
era5_sp = era5_sp.map(func_xtx)
# Visualization palette for total precipitation
# Precipitation visualization settings
visTp = {
'min': 0,
'max': 0.1,
'palette': ['#FFFFFF', '#00FFFF', '#0080FF', '#DA00FF', '#FFA400', '#FF0000']
}
# Visualization palette for temperature (mean, min and max) and 2m dewpoint
# temperature
vis2mt = {
'min': 250,
'max': 320,
'palette': [
'#000080', '#0000D9', '#4000FF', '#8000FF', '#0080FF', '#00FFFF', '#00FF80',
'#80FF00', '#DAFF00', '#FFFF00', '#FFF500', '#FFDA00', '#FFB000', '#FFA400',
'#FF4F00', '#FF2500', '#FF0A00', '#FF00FF'
]
}
# Visualization palette for u- and v-component of 10m wind
visWind = {
'min': 0,
'max': 30,
'palette': [
'#FFFFFF', '#FFFF71', '#DEFF00', '#9EFF00', '#77B038', '#007E55', '#005F51',
'#004B51', '#013A7B', '#023AAD'
]
}
# Visualization palette for pressure (surface pressure, mean sea level
# pressure) - adjust min and max values for mslp to min:990 and max:1050
visPressure = {
'min': 500,
'max': 1150,
'palette': [
'#01FFFF', '#058BFF', '#0600FF', '#DF00FF', '#FF00FF', '#FF8C00', '#FF8C00'
]
}
# Add layer to map
Map.addLayer(
era5_tp.filter(ee.Filter.date('2019-07-15')), visTp,
'Daily total precipitation sums')
Map.addLayer(
era5_2d.filter(ee.Filter.date('2019-07-15')), vis2mt,
'Daily mean 2m dewpoint temperature')
Map.addLayer(
era5_2mt.filter(ee.Filter.date('2019-07-15')), vis2mt,
'Daily mean 2m air temperature')
Map.addLayer(
era5_u_wind_10m.filter(ee.Filter.date('2019-07-15')), visWind,
'Daily mean 10m u-component of wind')
Map.addLayer(
era5_sp.filter(ee.Filter.date('2019-07-15')), visPressure,
'Daily mean surface pressure')
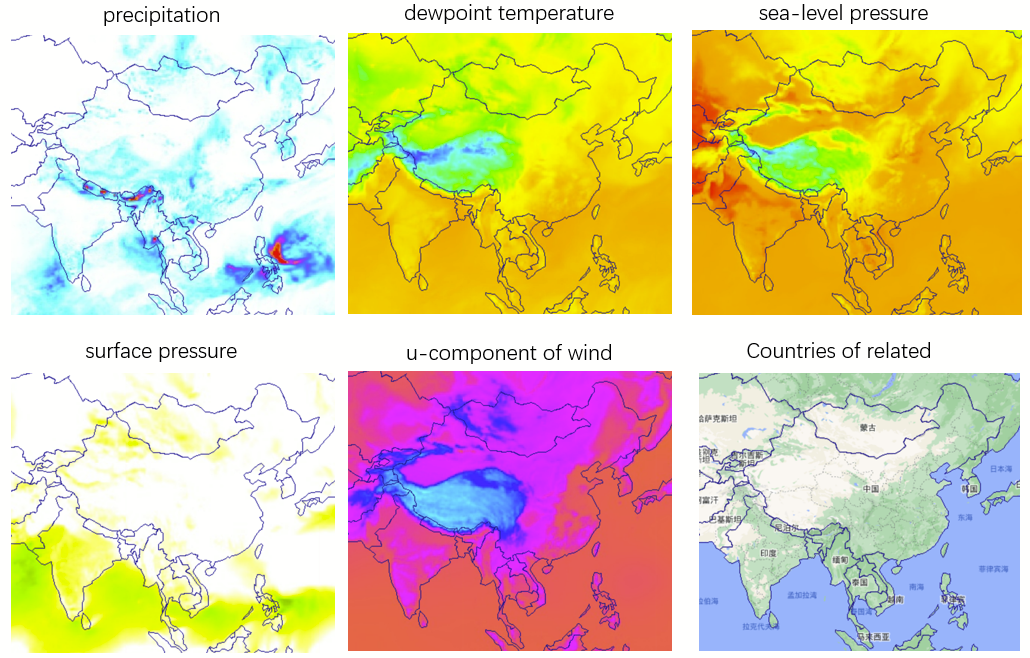
Map.setCenter(21.2, 22.2, 2)In order to more intuitively observe the data distribution, the world administrative region boundary is superimposed
# Load administrative region boundary
countries_shp = '../data/countries.shp'
countries = geemap.shp_to_ee(countries_shp)

Map.addLayer(ee.Image().paint(countries, 0, 1), {'palette':'darkblue'}, 'world countris')
(3) The results are shown below
Intercept local area (China)
4. ERA5 dataset reference
reference resources:
- https://blog.csdn.net/wuwenhuanwu/article/details/114504373
- https://developers.google.com/earth-engine/datasets/catalog/ECMWF_ERA5_DAILY#description