preface:
The project needs to write a K-line diagram. The charts of echarts can't realize the functions inside, so it's really a headache to use TradingView. Baidu has few things, and it took a long time to realize them.
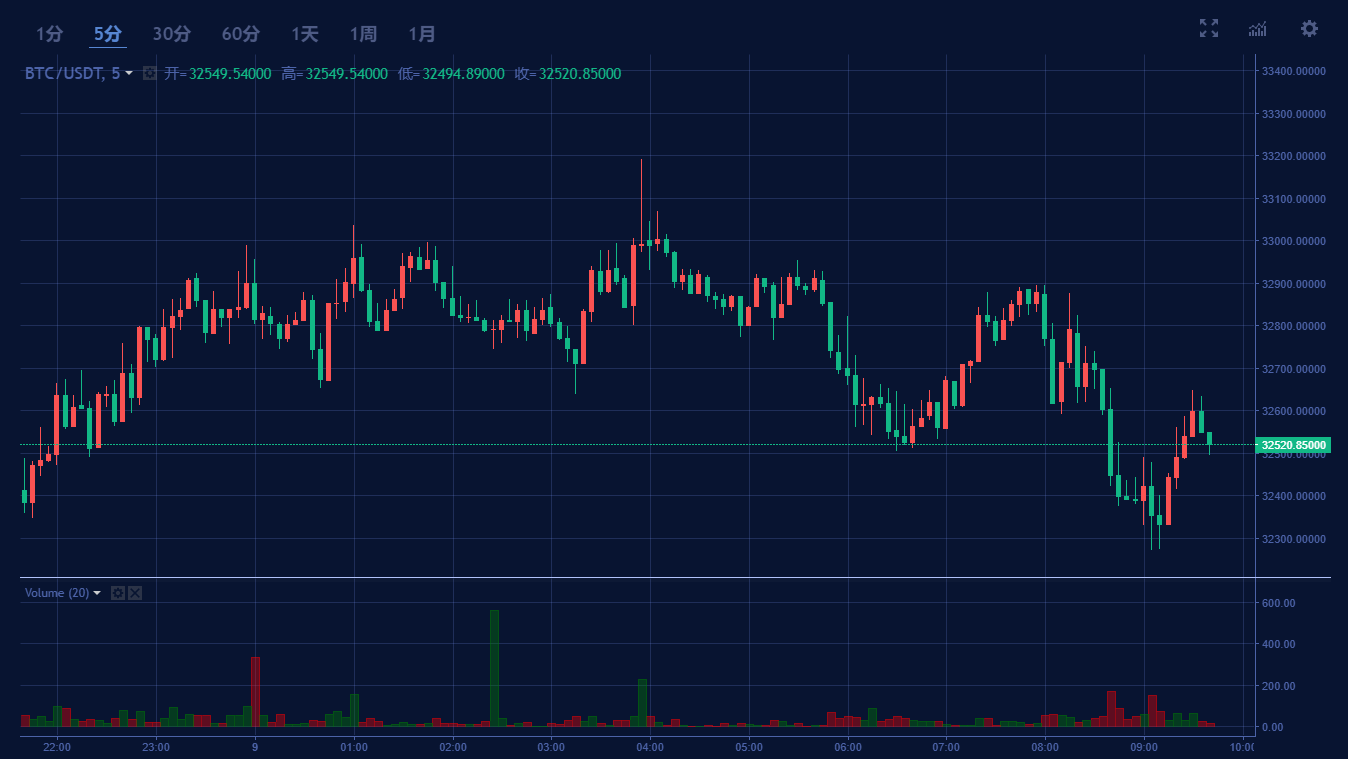
design sketch:
The k-line is updated in real time and can jump normally according to the data
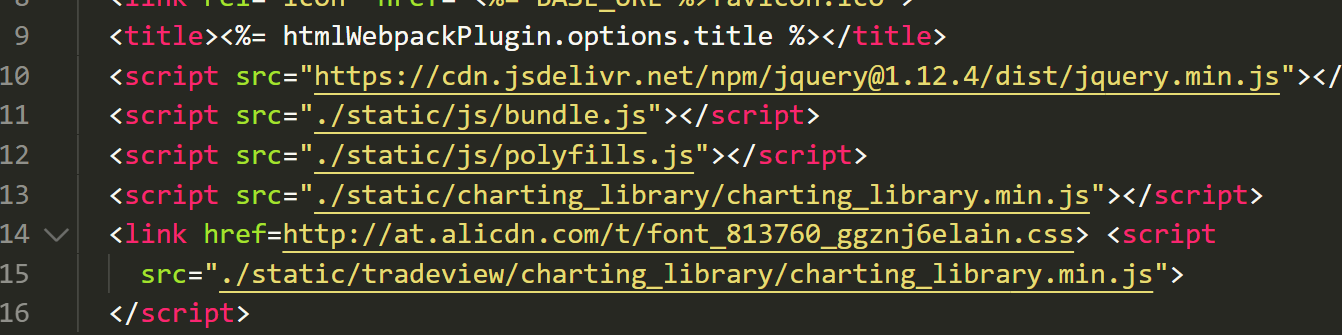
index.html introduces js and css files
This is vue-cli4, which is different from vue-cli2
If you are the css and js in vue-cli4, remember to put them in the public folder. vue-cli2 is used normally
Create container
First, create a div to save the k-line diagram (the style is modified according to your own project)
<template>
  <div class="tvContent">
    <div id="tv_chart_container"></div>
  </div>
</template>

<style scoped>
.tvContent {
  width: 100%;
  height: 800px;
  background: #061f46;
  border: 1px solid #4390e4;
  border-radius: 5px;
  padding: 20px;
  box-sizing: border-box;
}
#tv_chart_container {
  width: 100%;
  height: 100%;
}
</style>
Screenshot of parent component
Introduce the component and pass the required parameters to the sub component

The rest are subcomponents
props the value that the parent component wants to wear
props: {
    symbol: {
      type: String,
      required: true,
      default: "BTC/USDT", //Currency type
    },
    currency_id: {
      type: Number,
      required: true,  //id
    },
  },
Listen for the type passed by the parent component
watch: {
    listenState: function (a, b) {
      //Monitor transaction pairs
      if (a != b && b != "") {
        this.widget.setSymbol(
          a,
          localStorage.getItem("tim"),
          function onReadyCallback() {}
        ); //Switch currency
      }
    },
    symbol: {
      handler(n) {
      //  This place is the use of socket. No, please see the article on socket
        this.$socket.on("reconnect");
      },
      deep: true, // Deeply monitor the changes of objects passed by the parent component
      immediate: true,
    },
  },
Data in data()
      widget: null, //Created instance
      symbolInfo: null, //information
      priceScale: 100000, //Price accuracy
      aa: null,
      time1: null,
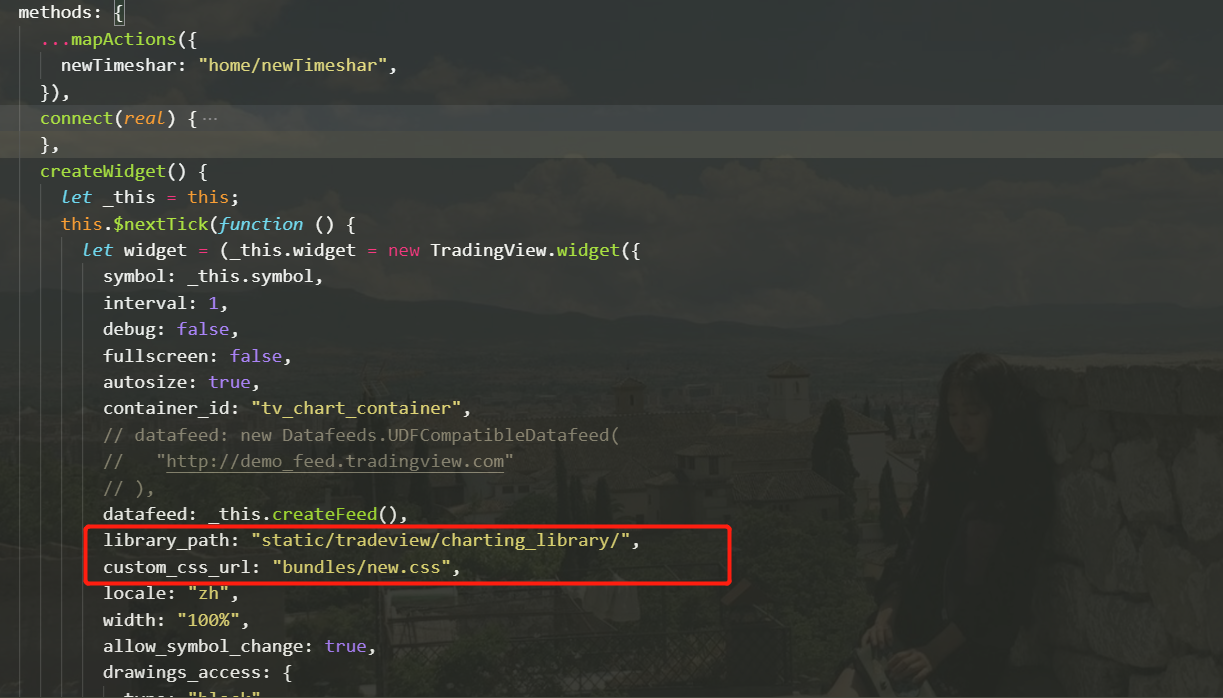
Create createWidget() function
createWidget() {
let _this = this;
this.$nextTick(function () {
let widget = (_this.widget = new TradingView.widget({
symbol: _this.symbol,
interval: 1,
debug: false,
fullscreen: false,
autosize: true,
container_id: "tv_chart_container",
datafeed: _this.createFeed(),
library_path: "static/tradeview/charting_library/",
custom_css_url: "bundles/new.css",
locale: "zh",
width: "100%",
allow_symbol_change: true,
drawings_access: {
type: "black",
// tools: [{name: "Regression Trend"}]//todo: moje
tools: [
{ name: "Trend Line", grayed: true },
{ name: "Trend Angle", grayed: true },
], //todo: bb
},
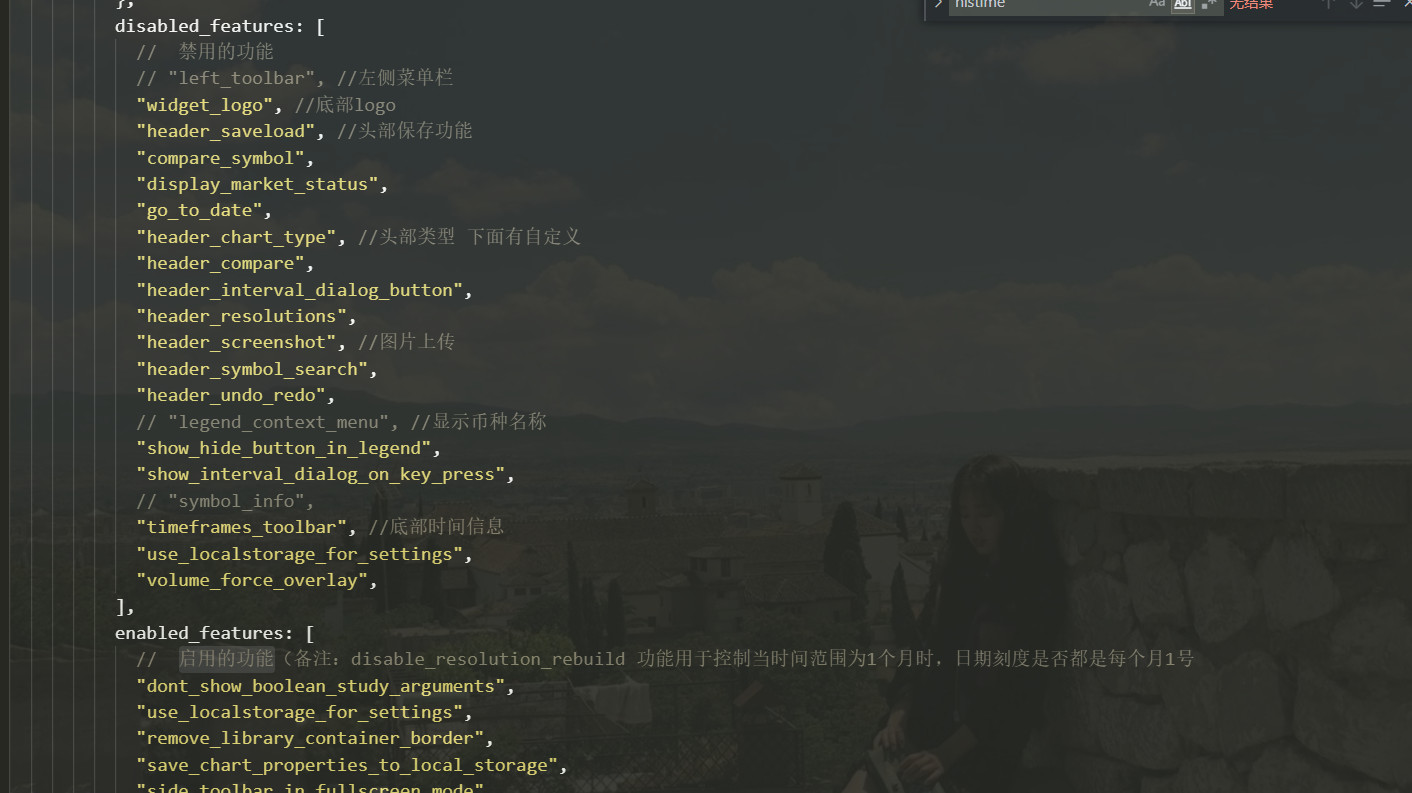
disabled_features: [
// Disabled features
"left_toolbar", //Left menu bar
"widget_logo", //Bottom logo
"header_saveload", //Head saving function
"compare_symbol",
"display_market_status",
"go_to_date",
"header_chart_type", //There are custom under the head type
"header_compare",
"header_interval_dialog_button",
"header_resolutions",
"header_screenshot", //Picture upload
"header_symbol_search",
"header_undo_redo",
// "legend_context_menu", / / display currency name
"show_hide_button_in_legend",
"show_interval_dialog_on_key_press",
// "symbol_info",
"timeframes_toolbar", //Bottom time information
"use_localstorage_for_settings",
"volume_force_overlay",
],
enabled_features: [
// Enabled function (Note: disable_resolution_rebuild function is used to control whether the date scale is the 1st day of each month when the time range is 1 month
"dont_show_boolean_study_arguments",
"use_localstorage_for_settings",
"remove_library_container_border",
"save_chart_properties_to_local_storage",
"side_toolbar_in_fullscreen_mode",
"hide_last_na_study_output",
"constraint_dialogs_movement",
"legend_widget",
],
charts_storage_url: "http://saveload.tradingview.com",
charts_storage_api_version: "1.1",
toolbar_bg: "transparent",
timezone: "Asia/Shanghai",
studies_overrides: {
"volume.precision": "1000",
},
overrides: _this.overrides(),
}));
widget.MAStudies = [];
widget.selectedIntervalButton = null;
widget.onChartReady(function () {
let buttonArr = [
{
value: "5",
period: "5min",
text: "5 branch",
chartType: 1,
type: "5min",
},
{
value: "15",
period: "15min",
text: "15 branch",
chartType: 1,
type: "15min",
},
{
value: "30",
period: "30min",
text: "30 branch",
chartType: 1,
type: "30min",
},
{
value: "60",
period: "60min",
text: "60 branch",
chartType: 1,
type: "60min",
},
{
value: "1D",
period: "1D",
text: "1 day",
chartType: 1,
type: "1day",
},
{
value: "1W",
period: "1W",
text: "1 week",
chartType: 1,
type: "1week",
},
{
value: "1M",
period: "1mon",
text: "1 month",
chartType: 1,
type: "1mon",
},
];
let btn = {};
let nowTime = "";
buttonArr.forEach((v, i) => {
let button = widget.createButton();
button.attr("title", v.text).addClass("my2").text(v.text);
if (v.text === "5 branch") {
button.css({
color: "#5786d2",
"border-bottom": "1px solid #5786d2",
});
localStorage.setItem("tim", "5");
}
btn = button.on("click", function (e) {
$(this).parents(".left").children().find(".my2").removeAttr("style");
handleClick(e, v.value, v.type);
button.css({
color: "#5786d2",
"border-bottom": "1px solid #5786d2",
});
_this.$store.commit("upType", v.type);
widget.chart().setChartType(v.chartType); //Change K-line type
});
});
let handleClick = (e, value, type) => {
_this.setSymbol = function (symbol, value) {
gh.chart().setSymbol(symbol, value);
};
widget.chart().setResolution(value, function onReadyCallback() {}); //Change resolution
$(e.target)
.addClass("mydate")
.closest("div.space-single")
.siblings("div.space-single")
.find("div.button")
.removeClass("mydate");
};
});
_this.widget = widget;
});
},
Precautions in createWidget() function
1. If you are vue-cli4, library_path and custom_ css_ The path of the URL must be the same as mine. If you use a relative path, an error will be reported. vue-cli2 then it is used normally
2. Some functions are used in the selection code of disabled functions and enabled functions. They can be deleted according to my remarks. If not, you can find them in the document
TradingView Chinese development document (function set address)
https://aitrade.ga/books/tradingview/book/Featuresets.htm
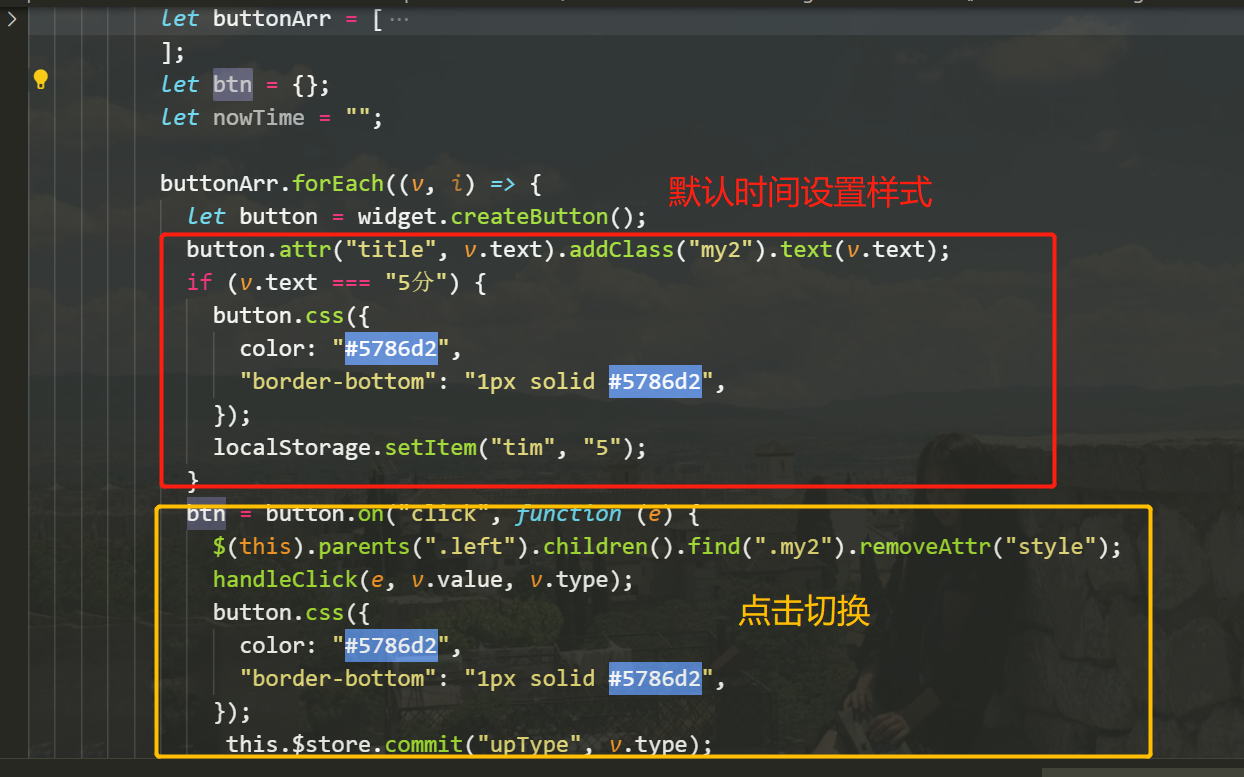
3. Customize navigation bar cycle
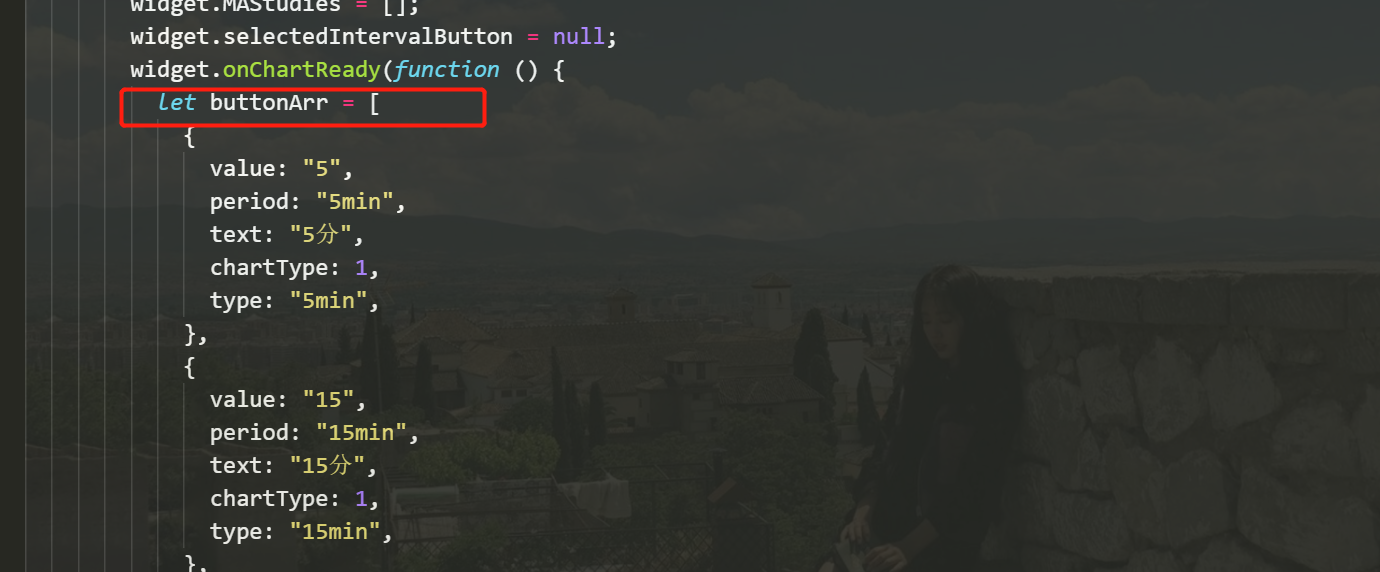
Set default time style and toggle
Create createFeed() function
createFeed() {
      let this_vue = this;
      let Datafeed = {};

      Datafeed.DataPulseUpdater = function (datafeed, updateFrequency) {
        this._datafeed = datafeed;
        this._subscribers = {};

        this._requestsPending = 0;
        var that = this;

        var update = function () {
          if (that._requestsPending > 0) {
            return;
          }

          for (var listenerGUID in that._subscribers) {
            var subscriptionRecord = that._subscribers[listenerGUID];
            var resolution = subscriptionRecord.resolution;

            var datesRangeRight = parseInt(new Date().valueOf() / 1000);

            //	BEWARE: please note we really need 2 bars, not the only last one
            //	see the explanation below. `10` is the `large enough` value to work around holidays
            var datesRangeLeft =
              datesRangeRight - that.periodLengthSeconds(resolution, 10);

            that._requestsPending++;

            (function (_subscriptionRecord) {
              // eslint-disable-line
              that._datafeed.getBars(
                _subscriptionRecord.symbolInfo,
                resolution,
                datesRangeLeft,
                datesRangeRight,
                function (bars) {
                  that._requestsPending--;

                  //	means the subscription was cancelled while waiting for data
                  if (!that._subscribers.hasOwnProperty(listenerGUID)) {
                    return;
                  }

                  if (bars.length === 0) {
                    return;
                  }

                  var lastBar = bars[bars.length - 1];
                  if (
                    !isNaN(_subscriptionRecord.lastBarTime) &&
                    lastBar.time < _subscriptionRecord.lastBarTime
                  ) {
                    return;
                  }

                  var subscribers = _subscriptionRecord.listeners;

                  //	BEWARE: this one isn't working when first update comes and this update makes a new bar. In this case
                  //	_subscriptionRecord.lastBarTime = NaN
                  var isNewBar =
                    !isNaN(_subscriptionRecord.lastBarTime) &&
                    lastBar.time > _subscriptionRecord.lastBarTime;

                  //	Pulse updating may miss some trades data (ie, if pulse period = 10 secods and new bar is started 5 seconds later after the last update, the
                  //	old bar's last 5 seconds trades will be lost). Thus, at fist we should broadcast old bar updates when it's ready.
                  if (isNewBar) {
                    if (bars.length < 2) {
                      throw new Error(
                        "Not enough bars in history for proper pulse update. Need at least 2."
                      );
                    }

                    var previousBar = bars[bars.length - 2];
                    for (var i = 0; i < subscribers.length; ++i) {
                      subscribers[i](previousBar);
                    }
                  }

                  _subscriptionRecord.lastBarTime = lastBar.time;

                  for (var i = 0; i < subscribers.length; ++i) {
                    subscribers[i](lastBar);
                  }
                },

                //	on error
                function () {
                  that._requestsPending--;
                }
              );
            })(subscriptionRecord);
          }
        };

        if (typeof updateFrequency != "undefined" && updateFrequency > 0) {
          setInterval(update, updateFrequency);
        }
      };

      Datafeed.DataPulseUpdater.prototype.periodLengthSeconds = function (
        resolution,
        requiredPeriodsCount
      ) {
        var daysCount = 0;
        if (resolution === "D") {
          daysCount = requiredPeriodsCount;
        } else if (resolution === "M") {
          daysCount = 31 * requiredPeriodsCount;
        } else if (resolution === "W") {
          daysCount = 7 * requiredPeriodsCount;
        } else {
          daysCount = (requiredPeriodsCount * resolution) / (24 * 60);
        }

        return daysCount * 24 * 60 * 60;
      };

      Datafeed.DataPulseUpdater.prototype.subscribeDataListener = function (
        symbolInfo,
        resolution,
        newDataCallback,
        listenerGUID
      ) {
        this._datafeed._logMessage("Subscribing " + listenerGUID);

        if (!this._subscribers.hasOwnProperty(listenerGUID)) {
          this._subscribers[listenerGUID] = {
            symbolInfo: symbolInfo,
            resolution: resolution,
            lastBarTime: NaN,
            listeners: [],
          };
        }

        this._subscribers[listenerGUID].listeners.push(newDataCallback);
      };

      Datafeed.DataPulseUpdater.prototype.unsubscribeDataListener = function (
        listenerGUID
      ) {
        this._datafeed._logMessage("Unsubscribing " + listenerGUID);
        delete this._subscribers[listenerGUID];
      };

      Datafeed.Container = function (updateFrequency) {
        this._configuration = {
          supports_search: false,
          supports_group_request: false,
          supported_resolutions: ["5", "15", "30", "60", "1D", "1W", "1M"],
          supports_marks: true,
          supports_timescale_marks: true,
          exchanges: ["gh"],
        };

        this._barsPulseUpdater = new Datafeed.DataPulseUpdater(
          this,
          updateFrequency || 10 * 1000
        );
        // this._quotesPulseUpdater = new Datafeed.QuotesPulseUpdater(this);

        this._enableLogging = true;
        this._callbacks = {};

        this._initializationFinished = true;
        this._fireEvent("initialized");
        this._fireEvent("configuration_ready");
      };

      Datafeed.Container.prototype._fireEvent = function (event, argument) {
        if (this._callbacks.hasOwnProperty(event)) {
          var callbacksChain = this._callbacks[event];
          for (var i = 0; i < callbacksChain.length; ++i) {
            callbacksChain[i](argument);
          }

          this._callbacks[event] = [];
        }
      };

      Datafeed.Container.prototype._logMessage = function (message) {
        if (this._enableLogging) {
          var now = new Date();
        }
      };

      Datafeed.Container.prototype.on = function (event, callback) {
        if (!this._callbacks.hasOwnProperty(event)) {
          this._callbacks[event] = [];
        }

        this._callbacks[event].push(callback);
        return this;
      };

      Datafeed.Container.prototype.onReady = function (callback) {
        let that = this;
        if (that._configuration) {
          setTimeout(function () {
            callback(that._configuration);
          }, 0);
        } else {
          this.on("configuration_ready", function () {
            callback(that._configuration);
          });
        }
      };

      Datafeed.Container.prototype.resolveSymbol = function (
        symbolName,
        onSymbolResolvedCallback,
        onResolveErrorCallback
      ) {
        this._logMessage("GOWNO :: resolve symbol " + symbolName);
        Promise.resolve().then(() => {
          onSymbolResolvedCallback({
            name: this_vue.symbol,
            timezone: "Asia/Shanghai",
            pricescale: this_vue.priceScale,
            minmov: 1, //Minmov, pricescale, minmove2, fractional
            minmov2: 0, //This is a magical number to format prices in complex situations.
            ticker: this_vue.symbol,
            description: "",
            type: "bitcoin",
            volume_precision: 8,
            // "exchange-traded": "sdt",
            // "exchange-listed": "sdt",
            //Now, these two fields are the abbreviations of an exchange. Will be displayed in the legend of the chart to represent this item. This field is not currently used for other purposes.
            has_intraday: true,
            has_weekly_and_monthly: true,
            has_no_volume: false, //Boolean indicates whether the commodity has volume data.
            session: "24x7",
            supported_resolutions: ["5", "15", "30", "60", "1D", "1W", "1M"],
          });
        });
      };

      //Initialization data
      Datafeed.Container.prototype.getBars = async function (
        symbolInfo,
        resolution,
        rangeStartDate,
        rangeEndDate,
        onHistoryCallback,
        onErrorCallback
      ) {
        if (
          resolution.indexOf("D") == -1 &&
          resolution.indexOf("W") == -1 &&
          resolution.indexOf("M") == -1
        ) {
          resolution = resolution + "min";
        } else if (resolution.indexOf("W") != -1 || resolution.indexOf("M") != -1) {
          resolution = resolution;
        }
        //this_vue.newTimeshar I request that the encapsulation method of historical data be changed to my own
        const res = await this_vue.newTimeshar({
          from: rangeStartDate,
          to: rangeEndDate,
          symbol: symbolInfo.name,
          period: resolution,
          currency_id: this_vue.currency_id,
        });

        if (res.code == 1 && res.data.length > 0) {
          this_vue.$store.commit("upSma1", res.data[res.data.length - 2].sma1);
          this_vue.$store.commit("upSma2", res.data[res.data.length - 2].sma2);
          //I transmit data to the background in real time. If I can't use it, I'll delete it myself
          this_vue.time1 = setInterval(function () {
            this_vue.$socket.emit("sub", this_vue.emitData); //Trigger socket connection
          }, 1000);
          //Clear timer
          this_vue.$once("hook:beforeDestroy", () => {
            clearInterval(this_vue.time1);
          });
          res.data.forEach((item, i) => {
            item.open = Number(item.open);
            item.close = Number(item.close);
            item.high = Number(item.high);
            item.low = Number(item.low);
          });
          onHistoryCallback(res.data, { noData: false });
          onHistoryCallback([], { noData: true });
        }
        if (!res.data || res.code == -1) {
          onHistoryCallback([], { noData: true });
        }
        if (res.data && res.data.length == 0) {
          onHistoryCallback([], { noData: true });
        }
      };
      //real-time data
      Datafeed.Container.prototype.subscribeBars = function (
        symbolInfo,
        resolution,
        onRealtimeCallback,
        listenerGUID,
        onResetCacheNeededCallback
      ) {
        this_vue.connect(onRealtimeCallback);

        //this._barsPulseUpdater.subscribeDataListener(symbolInfo, resolution, onRealtimeCallback, listenerGUID, onResetCacheNeededCallback);
      };

      Datafeed.Container.prototype.unsubscribeBars = function (listenerGUID) {
        this._barsPulseUpdater.unsubscribeDataListener(listenerGUID);
      };

      return new Datafeed.Container();
    },
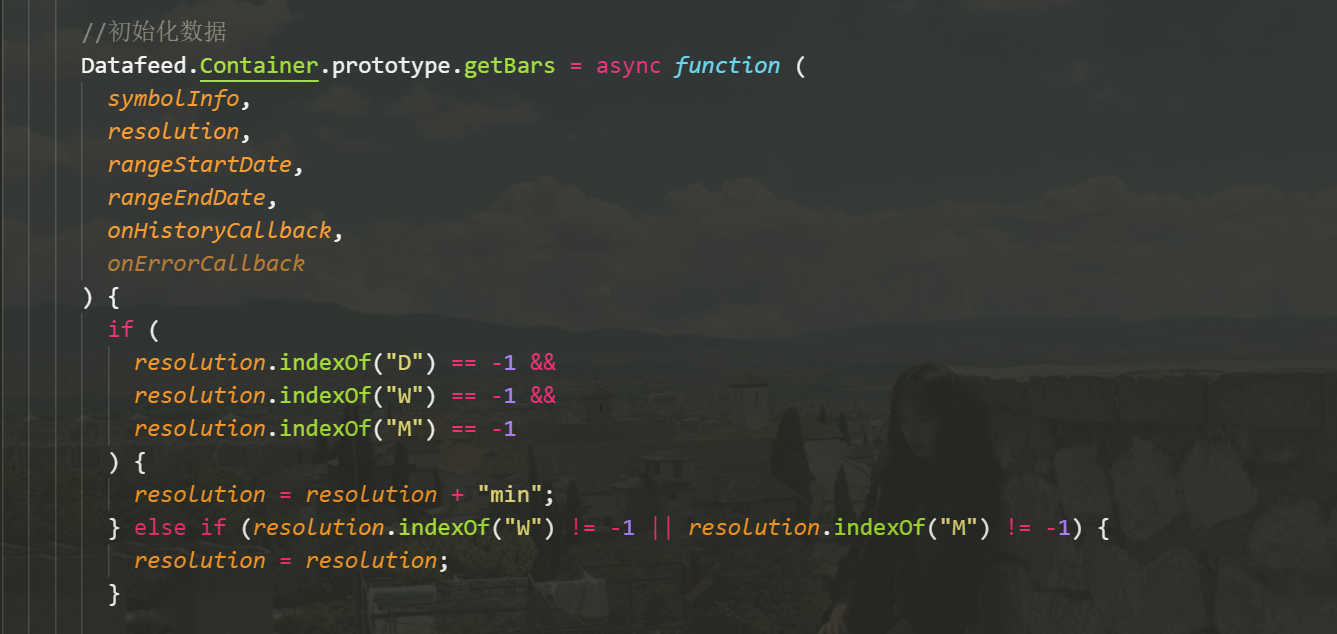
Precautions in createFeed() function
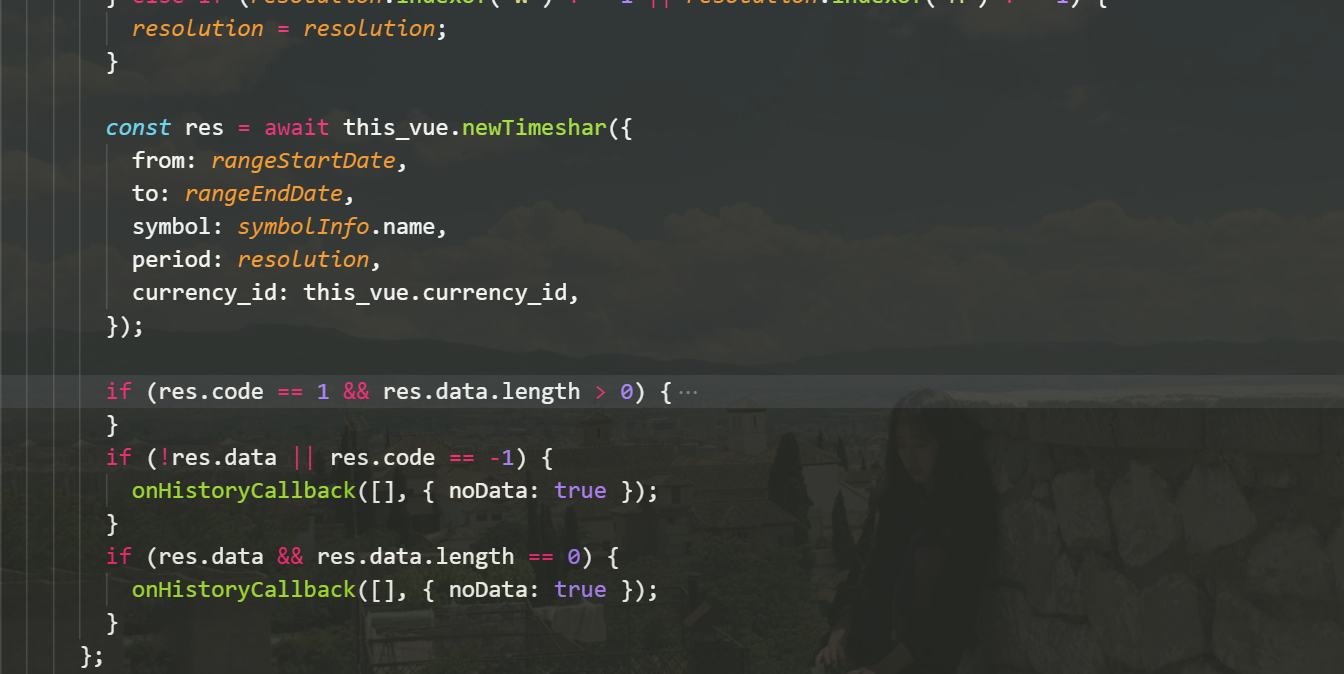
1. Obtain historical data
this_vue.newTimeshar () is my encapsulated interface for obtaining data. Just replace it with your own
2. Update data in real time
this_vue.connect() real time callback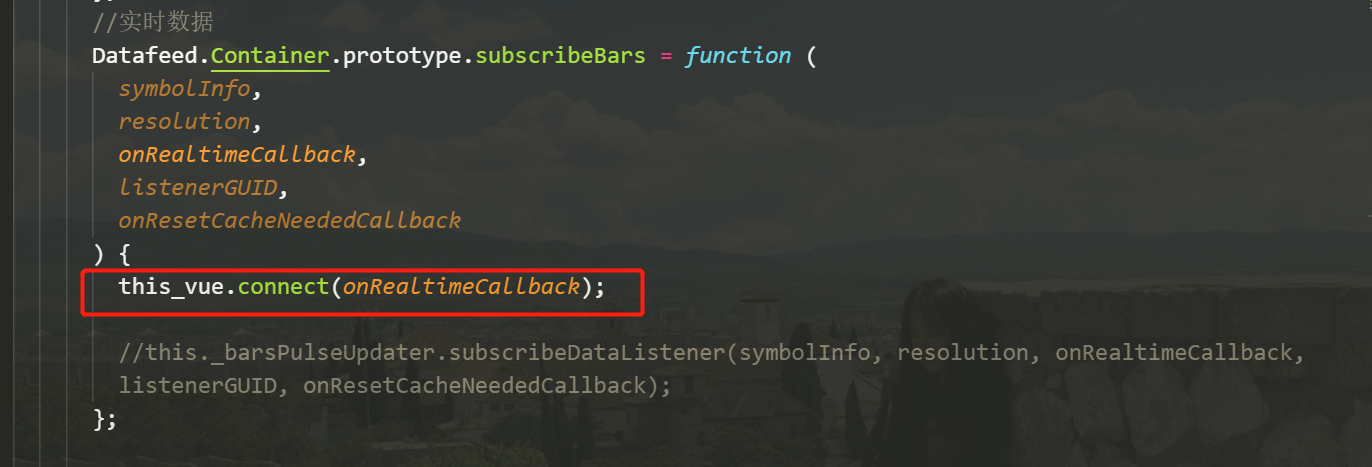
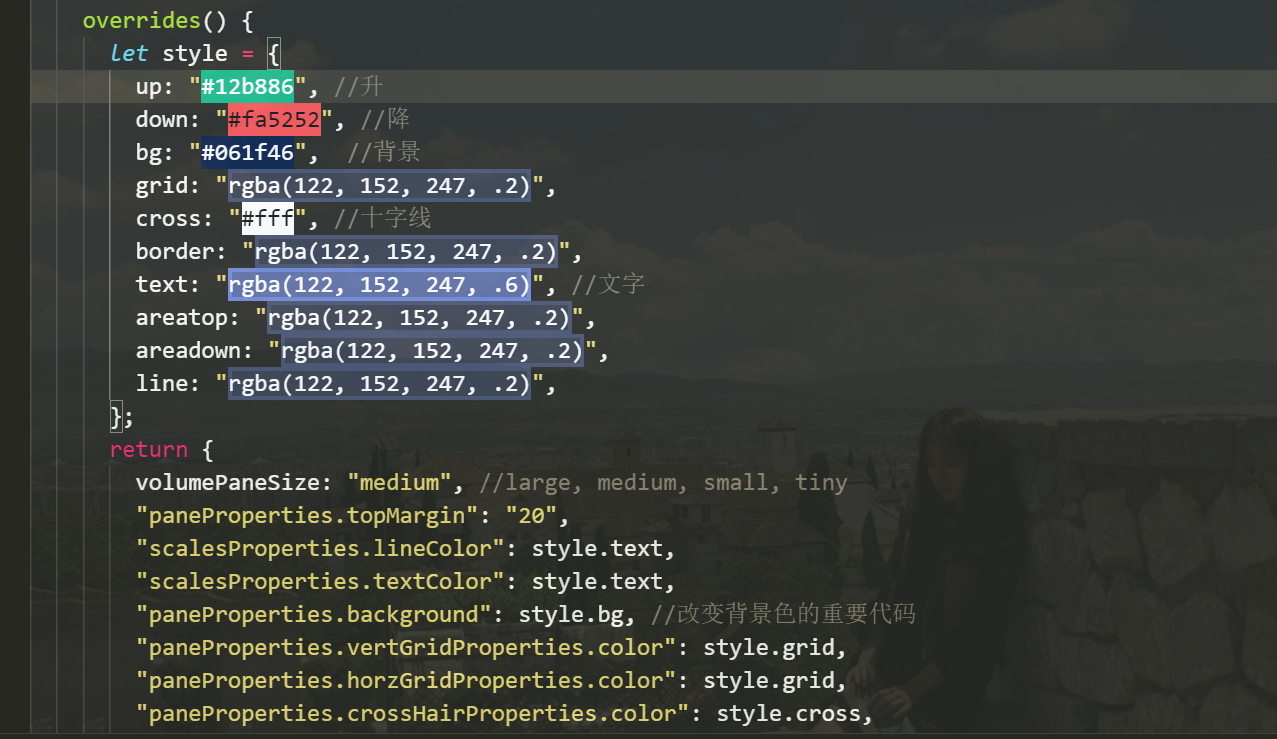
Create overrides() function
overrides() {
      let style = {
        up: "#12b886 ", / / L
        down: "#fa5252 ", / / drop
        bg: "#061f46 ", / / background
        grid: "rgba(122, 152, 247, .2)",
        cross: "#fff ", / / crosshair
        border: "rgba(122, 152, 247, .2)",
        text: "rgba(122, 152, 247, .6)", //written words
        areatop: "rgba(122, 152, 247, .2)",
        areadown: "rgba(122, 152, 247, .2)",
        line: "rgba(122, 152, 247, .2)",
      };
      return {
        volumePaneSize: "medium", //large, medium, small, tiny
        "paneProperties.topMargin": "20",
        "scalesProperties.lineColor": style.text,
        "scalesProperties.textColor": style.text,
        "paneProperties.background": style.bg, //Important code for changing background color
        "paneProperties.vertGridProperties.color": style.grid,
        "paneProperties.horzGridProperties.color": style.grid,
        "paneProperties.crossHairProperties.color": style.cross,
        "paneProperties.crossHairProperties.lineType": 2,
        "paneProperties.legendProperties.showLegend": true,
        "paneProperties.legendProperties.showStudyArguments": true,
        "paneProperties.legendProperties.showStudyTitles": true,
        "paneProperties.legendProperties.showStudyValues": true,
        "paneProperties.legendProperties.showSeriesTitle": true,
        "paneProperties.legendProperties.showSeriesOHLC": true,
        "mainSeriesProperties.candleStyle.upColor": style.up,
        "mainSeriesProperties.candleStyle.downColor": style.down,
        "mainSeriesProperties.candleStyle.drawWick": true,
        "mainSeriesProperties.candleStyle.drawBorder": true,
        "mainSeriesProperties.candleStyle.borderColor": style.border,
        "mainSeriesProperties.candleStyle.borderUpColor": style.up,
        "mainSeriesProperties.candleStyle.borderDownColor": style.down,
        "mainSeriesProperties.candleStyle.wickUpColor": style.up,
        "mainSeriesProperties.candleStyle.wickDownColor": style.down,
        "mainSeriesProperties.candleStyle.barColorsOnPrevClose": false,
        "mainSeriesProperties.hollowCandleStyle.upColor": style.up,
        "mainSeriesProperties.hollowCandleStyle.downColor": style.down,

        "mainSeriesProperties.hollowCandleStyle.drawWick": true,
        "mainSeriesProperties.hollowCandleStyle.drawBorder": true,
        "mainSeriesProperties.hollowCandleStyle.borderColor": style.border,
        "mainSeriesProperties.hollowCandleStyle.borderUpColor": style.up,
        "mainSeriesProperties.hollowCandleStyle.borderDownColor": style.down,
        "mainSeriesProperties.hollowCandleStyle.wickColor": style.line,
        "mainSeriesProperties.haStyle.upColor": style.up,
        "mainSeriesProperties.haStyle.downColor": style.down,
        "mainSeriesProperties.haStyle.drawWick": true,
        "mainSeriesProperties.haStyle.drawBorder": true,
        "mainSeriesProperties.haStyle.borderColor": style.border,
        "mainSeriesProperties.haStyle.borderUpColor": style.up,
        "mainSeriesProperties.haStyle.borderDownColor": style.down,
        "mainSeriesProperties.haStyle.wickColor": style.border,
        "mainSeriesProperties.haStyle.barColorsOnPrevClose": false,
        "mainSeriesProperties.barStyle.upColor": style.up,
        "mainSeriesProperties.barStyle.downColor": style.down,
        "mainSeriesProperties.barStyle.barColorsOnPrevClose": false,
        "mainSeriesProperties.barStyle.dontDrawOpen": false,
        "mainSeriesProperties.lineStyle.color": style.border,
        "mainSeriesProperties.lineStyle.linewidth": 2,
        "mainSeriesProperties.lineStyle.styleType": 2,
        "mainSeriesProperties.lineStyle.linestyle": 2,
        "mainSeriesProperties.lineStyle.priceSource": "close",
        "mainSeriesProperties.areaStyle.color1": style.areatop,
        "mainSeriesProperties.areaStyle.color2": style.areadown,
        "mainSeriesProperties.areaStyle.linecolor": style.border,
        "mainSeriesProperties.areaStyle.linewidth": 2,
        "mainSeriesProperties.areaStyle.linestyle": 2,
        "mainSeriesProperties.areaStyle.priceSource": "close",
      };
    },
Precautions in the overrides() function
Colors can be modified according to their own items (for other styles, please refer to Chinese documents)
TradingView Chinese development document (shape and overlay address)
https://aitrade.ga/books/tradingview/book/Shapes-and-Overrides.html
tv full code:
I use socket The background of IO connection, real-time docking data,
If you are using other methods, put the socket directly Just replace the things in io.
If you're interested in socket If you are interested, please see the link: https://blog.csdn.net//article/details/106191646.
<template>
<div class="tvContent">
<div id="tv_chart_container"></div>
</div>
</template>
<style scoped>
.tvContent {
width: 100%;
height: 800px;
background: #061f46;
border: 1px solid #4390e4;
border-radius: 5px;
padding: 20px;
box-sizing: border-box;
}
#tv_chart_container {
width: 100%;
height: 100%;
}
</style>
<script>
import { mapActions } from "vuex";
export default {
name: "tv",
props: {
symbol: {
type: String,
required: true,
default: "BTC/USDT",
},
currency_id: {
type: Number,
required: true,
},
},
data() {
return {
widget: null, //Created instance
symbolInfo: null, //information
priceScale: 100000, //Price accuracy
aa: null,
time1: null,
};
},
// socket I use
sockets: {
//Check whether the socket is rendered successfully
connect() {},
disconnect() {
console.log("break link");
}, //Detect socket disconnection
reconnect() {
console.log("re-link");
// this.$socket.emit("connection", 1);
this.$socket.open();
},
//The client receives socket events transmitted in the background
kline: function (msg) {
let obj = {};
var that = this;
let type = that.$store.state.type;
if (that.symbol == msg.symbol && msg.period == type) {
obj.open = Number(msg.open);
obj.low = Number(msg.low);
obj.high = Number(msg.high);
obj.close = Number(msg.close);
obj.volume = Number(msg.volume);
obj.time = Number(msg.time);
if (that.$store.state.nextId != msg.id) {
that.$store.commit("upId", msg.id);
that.$store.commit("upSma1", msg.sma1);
that.$store.commit("upSma2", msg.sma2);
}
this.aa && this.aa(obj);
}
},
},
computed: {
listenState() {
//Monitor transaction pairs
return this.symbol;
},
kind() {
return this.symbol.split("/")[0].toLowerCase();
},
// What I pass to the backstage will be deleted by myself
emitData() {
return (
this.kind +
"-" +
this.$store.state.type +
"-" +
this.$store.state.sma1 +
"-" +
this.$store.state.sma2
);
},
},
watch: {
listenState: function (a, b) {
//Monitor transaction pairs
if (a != b && b != "") {
this.widget.setSymbol(
a,
localStorage.getItem("tim"),
function onReadyCallback() {}
); //Switch currency
}
},
symbol: {
handler(n) {
this.$socket.on("reconnect");
},
deep: true, // Deeply monitor the changes of objects passed by the parent component
immediate: true,
},
},
mounted() {
this.createWidget();
},
destroyed() {
this.removeWidget();
},
methods: {
...mapActions({
newTimeshar: "home/newTimeshar",
}),
connect(real) {
this.aa = real;
let that = this;
//Real time data callback link socket
this.$socket.on("connect", function () {
this.$socket.on("kline", (msg) => {
let obj = {};
let type = that.$store.state.type;
if (that.symbol == msg.symbol && msg.period == type) {
obj.open = Number(msg.open);
obj.low = Number(msg.low);
obj.high = Number(msg.high);
obj.close = Number(msg.close);
obj.volume = Number(msg.volume);
obj.time = Number(msg.time);
if (that.$store.state.nextId != msg.id) {
that.$store.commit("upId", msg.id);
that.$store.commit("upSma1", msg.sma1);
that.$store.commit("upSma2", msg.sma2);
}
real(obj);
}
});
});
},
createWidget() {
let _this = this;
this.$nextTick(function () {
let widget = (_this.widget = new TradingView.widget({
symbol: _this.symbol,
interval: 1,
debug: false,
fullscreen: false,
autosize: true,
container_id: "tv_chart_container",
// datafeed: new Datafeeds.UDFCompatibleDatafeed(
// "http://demo_feed.tradingview.com"
// ),
datafeed: _this.createFeed(),
library_path: "static/tradeview/charting_library/",
custom_css_url: "bundles/new.css",
locale: "zh",
width: "100%",
allow_symbol_change: true,
drawings_access: {
type: "black",
// tools: [{name: "Regression Trend"}]//todo: moje
tools: [
{ name: "Trend Line", grayed: true },
{ name: "Trend Angle", grayed: true },
], //todo: bb
},
disabled_features: [
// Disabled features
// "left_toolbar", / / left menu bar
"widget_logo", //Bottom logo
"header_saveload", //Head saving function
"compare_symbol",
"display_market_status",
"go_to_date",
"header_chart_type", //There are custom under the head type
"header_compare",
"header_interval_dialog_button",
"header_resolutions",
"header_screenshot", //Picture upload
"header_symbol_search",
"header_undo_redo",
// "legend_context_menu", / / display currency name
"show_hide_button_in_legend",
"show_interval_dialog_on_key_press",
// "symbol_info",
"timeframes_toolbar", //Bottom time information
"use_localstorage_for_settings",
"volume_force_overlay",
],
enabled_features: [
// Enabled function (Note: disable_resolution_rebuild function is used to control whether the date scale is the 1st day of each month when the time range is 1 month
"dont_show_boolean_study_arguments",
"use_localstorage_for_settings",
"remove_library_container_border",
"save_chart_properties_to_local_storage",
"side_toolbar_in_fullscreen_mode",
"hide_last_na_study_output",
"constraint_dialogs_movement",
"legend_widget",
],
charts_storage_url: "http://saveload.tradingview.com",
charts_storage_api_version: "1.1",
toolbar_bg: "transparent",
timezone: "Asia/Shanghai",
studies_overrides: {
"volume.precision": "1000",
},
overrides: _this.overrides(),
}));
widget.MAStudies = [];
widget.selectedIntervalButton = null;
widget.onChartReady(function () {
let buttonArr = [
{
value: "1",
period: "1min",
text: "1 branch",
chartType: 1,
type: "1min",
},
{
value: "5",
period: "5min",
text: "5 branch",
chartType: 1,
type: "5min",
},
{
value: "30",
period: "30min",
text: "30 branch",
chartType: 1,
type: "30min",
},
{
value: "60",
period: "60min",
text: "60 branch",
chartType: 1,
type: "60min",
},
{
value: "1D",
period: "1D",
text: "1 day",
chartType: 1,
type: "1day",
},
{
value: "1W",
period: "1W",
text: "1 week",
chartType: 1,
type: "1week",
},
{
value: "1M",
period: "1mon",
text: "1 month",
chartType: 1,
type: "1mon",
},
];
let btn = {};
let nowTime = "";
buttonArr.forEach((v, i) => {
let button = widget.createButton();
button.attr("title", v.text).addClass("my2").text(v.text);
if (v.text === "5 branch") {
button.css({
color: "#5786d2",
"border-bottom": "1px solid #5786d2",
});
localStorage.setItem("tim", "5");
}
btn = button.on("click", function (e) {
$(this).parents(".left").children().find(".my2").removeAttr("style");
handleClick(e, v.value, v.type);
button.css({
color: "#5786d2",
"border-bottom": "1px solid #5786d2",
});
_this.$store.commit("upType", v.type);
widget.chart().setChartType(v.chartType); //Change K-line type
});
});
let handleClick = (e, value, type) => {
_this.setSymbol = function (symbol, value) {
gh.chart().setSymbol(symbol, value);
};
widget.chart().setResolution(value, function onReadyCallback() {}); //Change resolution
$(e.target)
.addClass("mydate")
.closest("div.space-single")
.siblings("div.space-single")
.find("div.button")
.removeClass("mydate");
};
});
_this.widget = widget;
});
},
createFeed() {
let this_vue = this;
let Datafeed = {};
Datafeed.DataPulseUpdater = function (datafeed, updateFrequency) {
this._datafeed = datafeed;
this._subscribers = {};
this._requestsPending = 0;
var that = this;
var update = function () {
if (that._requestsPending > 0) {
return;
}
for (var listenerGUID in that._subscribers) {
var subscriptionRecord = that._subscribers[listenerGUID];
var resolution = subscriptionRecord.resolution;
var datesRangeRight = parseInt(new Date().valueOf() / 1000);
// BEWARE: please note we really need 2 bars, not the only last one
// see the explanation below. `10` is the `large enough` value to work around holidays
var datesRangeLeft =
datesRangeRight - that.periodLengthSeconds(resolution, 10);
that._requestsPending++;
(function (_subscriptionRecord) {
// eslint-disable-line
that._datafeed.getBars(
_subscriptionRecord.symbolInfo,
resolution,
datesRangeLeft,
datesRangeRight,
function (bars) {
that._requestsPending--;
// means the subscription was cancelled while waiting for data
if (!that._subscribers.hasOwnProperty(listenerGUID)) {
return;
}
if (bars.length === 0) {
return;
}
var lastBar = bars[bars.length - 1];
if (
!isNaN(_subscriptionRecord.lastBarTime) &&
lastBar.time < _subscriptionRecord.lastBarTime
) {
return;
}
var subscribers = _subscriptionRecord.listeners;
// BEWARE: this one isn't working when first update comes and this update makes a new bar. In this case
// _subscriptionRecord.lastBarTime = NaN
var isNewBar =
!isNaN(_subscriptionRecord.lastBarTime) &&
lastBar.time > _subscriptionRecord.lastBarTime;
// Pulse updating may miss some trades data (ie, if pulse period = 10 secods and new bar is started 5 seconds later after the last update, the
// old bar's last 5 seconds trades will be lost). Thus, at fist we should broadcast old bar updates when it's ready.
if (isNewBar) {
if (bars.length < 2) {
throw new Error(
"Not enough bars in history for proper pulse update. Need at least 2."
);
}
var previousBar = bars[bars.length - 2];
for (var i = 0; i < subscribers.length; ++i) {
subscribers[i](previousBar);
}
}
_subscriptionRecord.lastBarTime = lastBar.time;
for (var i = 0; i < subscribers.length; ++i) {
subscribers[i](lastBar);
}
},
// on error
function () {
that._requestsPending--;
}
);
})(subscriptionRecord);
}
};
if (typeof updateFrequency != "undefined" && updateFrequency > 0) {
setInterval(update, updateFrequency);
}
};
Datafeed.DataPulseUpdater.prototype.periodLengthSeconds = function (
resolution,
requiredPeriodsCount
) {
var daysCount = 0;
if (resolution === "D") {
daysCount = requiredPeriodsCount;
} else if (resolution === "M") {
daysCount = 31 * requiredPeriodsCount;
} else if (resolution === "W") {
daysCount = 7 * requiredPeriodsCount;
} else {
daysCount = (requiredPeriodsCount * resolution) / (24 * 60);
}
return daysCount * 24 * 60 * 60;
};
Datafeed.DataPulseUpdater.prototype.subscribeDataListener = function (
symbolInfo,
resolution,
newDataCallback,
listenerGUID
) {
this._datafeed._logMessage("Subscribing " + listenerGUID);
if (!this._subscribers.hasOwnProperty(listenerGUID)) {
this._subscribers[listenerGUID] = {
symbolInfo: symbolInfo,
resolution: resolution,
lastBarTime: NaN,
listeners: [],
};
}
this._subscribers[listenerGUID].listeners.push(newDataCallback);
};
Datafeed.DataPulseUpdater.prototype.unsubscribeDataListener = function (
listenerGUID
) {
this._datafeed._logMessage("Unsubscribing " + listenerGUID);
delete this._subscribers[listenerGUID];
};
Datafeed.Container = function (updateFrequency) {
this._configuration = {
supports_search: false,
supports_group_request: false,
supported_resolutions: ["5", "15", "30", "60", "1D", "1W", "1M"],
supports_marks: true,
supports_timescale_marks: true,
exchanges: ["gh"],
};
this._barsPulseUpdater = new Datafeed.DataPulseUpdater(
this,
updateFrequency || 10 * 1000
);
// this._quotesPulseUpdater = new Datafeed.QuotesPulseUpdater(this);
this._enableLogging = true;
this._callbacks = {};
this._initializationFinished = true;
this._fireEvent("initialized");
this._fireEvent("configuration_ready");
};
Datafeed.Container.prototype._fireEvent = function (event, argument) {
if (this._callbacks.hasOwnProperty(event)) {
var callbacksChain = this._callbacks[event];
for (var i = 0; i < callbacksChain.length; ++i) {
callbacksChain[i](argument);
}
this._callbacks[event] = [];
}
};
Datafeed.Container.prototype._logMessage = function (message) {
if (this._enableLogging) {
var now = new Date();
}
};
Datafeed.Container.prototype.on = function (event, callback) {
if (!this._callbacks.hasOwnProperty(event)) {
this._callbacks[event] = [];
}
this._callbacks[event].push(callback);
return this;
};
Datafeed.Container.prototype.onReady = function (callback) {
let that = this;
if (that._configuration) {
setTimeout(function () {
callback(that._configuration);
}, 0);
} else {
this.on("configuration_ready", function () {
callback(that._configuration);
});
}
};
Datafeed.Container.prototype.resolveSymbol = function (
symbolName,
onSymbolResolvedCallback,
onResolveErrorCallback
) {
this._logMessage("GOWNO :: resolve symbol " + symbolName);
Promise.resolve().then(() => {
onSymbolResolvedCallback({
name: this_vue.symbol,
timezone: "Asia/Shanghai",
pricescale: this_vue.priceScale,
minmov: 1, //Minmov, pricescale, minmove2, fractional
minmov2: 0, //This is a magical number to format prices in complex situations.
ticker: this_vue.symbol,
description: "",
type: "bitcoin",
volume_precision: 8,
// "exchange-traded": "sdt",
// "exchange-listed": "sdt",
//Now, these two fields are the abbreviations of an exchange. Will be displayed in the legend of the chart to represent this item. This field is not currently used for other purposes.
has_intraday: true,
has_weekly_and_monthly: true,
has_no_volume: false, //Boolean indicates whether the commodity has volume data.
session: "24x7",
supported_resolutions: ["5", "15", "30", "60", "1D", "1W", "1M"],
});
});
};
//Initialization data
Datafeed.Container.prototype.getBars = async function (
symbolInfo,
resolution,
rangeStartDate,
rangeEndDate,
onHistoryCallback,
onErrorCallback
) {
if (
resolution.indexOf("D") == -1 &&
resolution.indexOf("W") == -1 &&
resolution.indexOf("M") == -1
) {
resolution = resolution + "min";
} else if (resolution.indexOf("W") != -1 || resolution.indexOf("M") != -1) {
resolution = resolution;
}
//this_vue.newTimeshar I request that the encapsulation method of historical data be changed to my own
const res = await this_vue.newTimeshar({
from: rangeStartDate,
to: rangeEndDate,
symbol: symbolInfo.name,
period: resolution,
currency_id: this_vue.currency_id,
});
if (res.code == 1 && res.data.length > 0) {
this_vue.$store.commit("upSma1", res.data[res.data.length - 2].sma1);
this_vue.$store.commit("upSma2", res.data[res.data.length - 2].sma2);
//I transmit data to the background in real time. If I can't use it, I'll delete it myself
this_vue.time1 = setInterval(function () {
this_vue.$socket.emit("sub", this_vue.emitData); //Trigger socket connection
}, 1000);
//Clear timer
this_vue.$once("hook:beforeDestroy", () => {
clearInterval(this_vue.time1);
});
res.data.forEach((item, i) => {
item.open = Number(item.open);
item.close = Number(item.close);
item.high = Number(item.high);
item.low = Number(item.low);
});
onHistoryCallback(res.data, { noData: false });
onHistoryCallback([], { noData: true });
}
if (!res.data || res.code == -1) {
onHistoryCallback([], { noData: true });
}
if (res.data && res.data.length == 0) {
onHistoryCallback([], { noData: true });
}
};
//real-time data
Datafeed.Container.prototype.subscribeBars = function (
symbolInfo,
resolution,
onRealtimeCallback,
listenerGUID,
onResetCacheNeededCallback
) {
this_vue.connect(onRealtimeCallback);
//this._barsPulseUpdater.subscribeDataListener(symbolInfo, resolution, onRealtimeCallback, listenerGUID, onResetCacheNeededCallback);
};
Datafeed.Container.prototype.unsubscribeBars = function (listenerGUID) {
this._barsPulseUpdater.unsubscribeDataListener(listenerGUID);
};
return new Datafeed.Container();
},
updateData(data) {
if (data) {
this.$emit("real-time", data);
}
},
updateWidget(item) {
this.symbolInfo = {
name: item,
ticker: item,
description: "",
session: "24x7",
supported_resolutions: ["5", "15", "30", "60", "1D", "1W", "1M"],
has_intraday: true,
has_daily: true,
has_weekly_and_monthly: true,
timezone: "UTC",
};
this.removeWidget();
this.createWidget();
},
removeWidget() {
if (this.widget) {
this.widget.remove();
this.widget = null;
}
},
overrides() {
let style = {
up: "#12b886 ", / / L
down: "#fa5252 ", / / drop
bg: "#061f46 ", / / background
grid: "rgba(122, 152, 247, .2)",
cross: "#fff ", / / crosshair
border: "rgba(122, 152, 247, .2)",
text: "rgba(122, 152, 247, .6)", //written words
areatop: "rgba(122, 152, 247, .2)",
areadown: "rgba(122, 152, 247, .2)",
line: "rgba(122, 152, 247, .2)",
};
return {
volumePaneSize: "medium", //large, medium, small, tiny
"paneProperties.topMargin": "20",
"scalesProperties.lineColor": style.text,
"scalesProperties.textColor": style.text,
"paneProperties.background": style.bg, //Important code for changing background color
"paneProperties.vertGridProperties.color": style.grid,
"paneProperties.horzGridProperties.color": style.grid,
"paneProperties.crossHairProperties.color": style.cross,
"paneProperties.crossHairProperties.lineType": 2,
"paneProperties.legendProperties.showLegend": true,
"paneProperties.legendProperties.showStudyArguments": true,
"paneProperties.legendProperties.showStudyTitles": true,
"paneProperties.legendProperties.showStudyValues": true,
"paneProperties.legendProperties.showSeriesTitle": true,
"paneProperties.legendProperties.showSeriesOHLC": true,
"mainSeriesProperties.candleStyle.upColor": style.up,
"mainSeriesProperties.candleStyle.downColor": style.down,
"mainSeriesProperties.candleStyle.drawWick": true,
"mainSeriesProperties.candleStyle.drawBorder": true,
"mainSeriesProperties.candleStyle.borderColor": style.border,
"mainSeriesProperties.candleStyle.borderUpColor": style.up,
"mainSeriesProperties.candleStyle.borderDownColor": style.down,
"mainSeriesProperties.candleStyle.wickUpColor": style.up,
"mainSeriesProperties.candleStyle.wickDownColor": style.down,
"mainSeriesProperties.candleStyle.barColorsOnPrevClose": false,
"mainSeriesProperties.hollowCandleStyle.upColor": style.up,
"mainSeriesProperties.hollowCandleStyle.downColor": style.down,
"mainSeriesProperties.hollowCandleStyle.drawWick": true,
"mainSeriesProperties.hollowCandleStyle.drawBorder": true,
"mainSeriesProperties.hollowCandleStyle.borderColor": style.border,
"mainSeriesProperties.hollowCandleStyle.borderUpColor": style.up,
"mainSeriesProperties.hollowCandleStyle.borderDownColor": style.down,
"mainSeriesProperties.hollowCandleStyle.wickColor": style.line,
"mainSeriesProperties.haStyle.upColor": style.up,
"mainSeriesProperties.haStyle.downColor": style.down,
"mainSeriesProperties.haStyle.drawWick": true,
"mainSeriesProperties.haStyle.drawBorder": true,
"mainSeriesProperties.haStyle.borderColor": style.border,
"mainSeriesProperties.haStyle.borderUpColor": style.up,
"mainSeriesProperties.haStyle.borderDownColor": style.down,
"mainSeriesProperties.haStyle.wickColor": style.border,
"mainSeriesProperties.haStyle.barColorsOnPrevClose": false,
"mainSeriesProperties.barStyle.upColor": style.up,
"mainSeriesProperties.barStyle.downColor": style.down,
"mainSeriesProperties.barStyle.barColorsOnPrevClose": false,
"mainSeriesProperties.barStyle.dontDrawOpen": false,
"mainSeriesProperties.lineStyle.color": style.border,
"mainSeriesProperties.lineStyle.linewidth": 2,
"mainSeriesProperties.lineStyle.styleType": 2,
"mainSeriesProperties.lineStyle.linestyle": 2,
"mainSeriesProperties.lineStyle.priceSource": "close",
"mainSeriesProperties.areaStyle.color1": style.areatop,
"mainSeriesProperties.areaStyle.color2": style.areadown,
"mainSeriesProperties.areaStyle.linecolor": style.border,
"mainSeriesProperties.areaStyle.linewidth": 2,
"mainSeriesProperties.areaStyle.linestyle": 2,
"mainSeriesProperties.areaStyle.priceSource": "close",
};
},
},
};
</script>
TradingView extension
TradingView set and hide moving average: https://blog.csdn.net//article/details/118582663.
vue TradingView marks the k-line: https://blog.csdn.net//article/details/118584281.