K-nearest neighbor algorithm
K-nearest neighbor algorithm (KNN) is a basic classification and regression method proposed in 1967. The working principle is: there is a sample data set, also known as the training sample set, and each data in the sample set has a label, that is, we know the corresponding relationship between each data in the sample set and its classification. After entering the new data without labels, each feature of the new data is compared with the corresponding feature of the data in the sample set, and then the algorithm extracts the classification label of the most similar data in the sample. Generally speaking, we only select the first k most similar data in the sample data set, which is the source of K of k-nearest neighbor algorithm. Generally, K is an integer not greater than 20. Finally, the most frequent classification among the k most similar data is selected as the classification of new data.
1. Classify whether a movie is an action movie or a love movie
The data set, that is, the training sample set, has two characteristics: the number of fighting shots and the number of kissing shots. In addition, we also know the type of each film, that is, the classification label.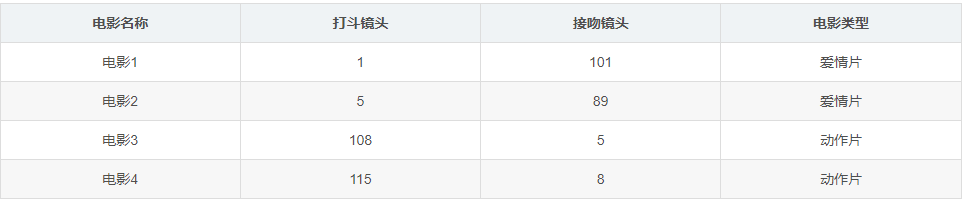
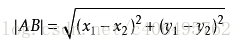
Using the distance formula of two points learned in high school
The steps of K-nearest neighbor algorithm are as follows:
1. Calculate the distance between the point in the known category dataset and the current point
2. Sort by increasing distance
3. Select the K points with the smallest distance from the current point
4. Determine the occurrence frequency of the category where the first K points are located
5. Return the category with the highest frequency of the first K points to the prediction classification of the current point
1.1 data preparation
import numpy as np
def createDataSet():
    group = np.array([[1,101],[5,89],[108,5],[115,8]])
    labels = ['affectional film','affectional film','action movie','action movie']
    return group, labels
if __name__ == "__main__":
    group, labels =createDataSet()
    print(group)
    print(labels)
1.2 calculation distance
The distance formula between two points, calculate the distance, select the first K points with the smallest distance, and return the result
# -*- coding: UTF-8 -*-
import numpy as np
import operator

"""
Function description:kNN algorithm,classifier

Parameters:
    inX - Data for classification(Test set)
    dataSet - Data for training(Training set)
    labes - Classification label
    k - kNN Algorithm parameters,Select the one with the smallest distance k Point
Returns:
    sortedClassCount[0][0] - Classification results

Modify:
    2017-07-13
"""
def classify0(inX, dataSet, labels, k):
    #numpy function shape[0] returns the number of rows of dataSet
    dataSetSize = dataSet.shape[0]
    #Repeat inX once in the direction of column vector (horizontal), and inX times in the direction of row vector (vertical)
    diffMat = np.tile(inX, (dataSetSize, 1)) - dataSet
    #Square of two-dimensional feature subtraction
    sqDiffMat = diffMat**2
    #sum() adds all elements, sum(0) columns and sum(1) rows
    sqDistances = sqDiffMat.sum(axis=1)
    #Square off and calculate the distance
    distances = sqDistances**0.5
    #Returns the index value of the elements in distances sorted from small to large
    sortedDistIndices = distances.argsort()
    #Define a dictionary that records the number of times of a category
    classCount = {}
    for i in range(k):
        #Take out the category of the first k elements
        voteIlabel = labels[sortedDistIndices[i]]
        #dict.get(key,default=None), the get() method of the dictionary, returns the value of the specified key. If the value is not in the dictionary, it returns the default value.
        #Calculate the number of categories
        classCount[voteIlabel] = classCount.get(voteIlabel,0) + 1
    #Replace itemtems() in python2 with items() in python3
    #key=operator. Itemsetter (1) sorts by dictionary value
    #key=operator. Itemsetter (0) sorts by dictionary key
    #reverse descending sort dictionary
    sortedClassCount = sorted(classCount.items(),key=operator.itemgetter(1),reverse=True)
    #The category that returns the most times, that is, the category to be classified
    return sortedClassCount[0][0]
1.3 overall code
# -*- coding: UTF-8 -*-
import numpy as np
import operator

"""
Function description:Create dataset

Parameters:
    nothing
Returns:
    group - data set
    labels - Classification label
Modify:
    2017-07-13
"""
def createDataSet():
    #Four sets of 2D features
    group = np.array([[1,101],[5,89],[108,5],[115,8]])
    #Labels for four sets of features
    labels = ['affectional film','affectional film','action movie','action movie']
    return group, labels

"""
Function description:kNN algorithm,classifier

Parameters:
    inX - Data for classification(Test set)
    dataSet - Data for training(Training set)
    labes - Classification label
    k - kNN Algorithm parameters,Select the one with the smallest distance k Point
Returns:
    sortedClassCount[0][0] - Classification results

Modify:
    2017-07-13
"""
def classify0(inX, dataSet, labels, k):
    #numpy function shape[0] returns the number of rows of dataSet
    dataSetSize = dataSet.shape[0]
    #Repeat inX once in the direction of column vector (horizontal), and inX times in the direction of row vector (vertical)
    diffMat = np.tile(inX, (dataSetSize, 1)) - dataSet
    #Square of two-dimensional feature subtraction
    sqDiffMat = diffMat**2
    #sum() adds all elements, sum(0) columns and sum(1) rows
    sqDistances = sqDiffMat.sum(axis=1)
    #Square off and calculate the distance
    distances = sqDistances**0.5
    #Returns the index value of the elements in distances sorted from small to large
    sortedDistIndices = distances.argsort()
    #Define a dictionary that records the number of times of a category
    classCount = {}
    for i in range(k):
        #Take out the category of the first k elements
        voteIlabel = labels[sortedDistIndices[i]]
        #dict.get(key,default=None), the get() method of the dictionary, returns the value of the specified key. If the value is not in the dictionary, it returns the default value.
        #Calculate the number of categories
        classCount[voteIlabel] = classCount.get(voteIlabel,0) + 1
    #Replace itemtems() in python2 with items() in python3
    #key=operator. Itemsetter (1) sorts by dictionary value
    #key=operator. Itemsetter (0) sorts by dictionary key
    #reverse descending sort dictionary
    sortedClassCount = sorted(classCount.items(),key=operator.itemgetter(1),reverse=True)
    #The category that returns the most times, that is, the category to be classified
    return sortedClassCount[0][0]

if __name__ == '__main__':
    #Create dataset
    group, labels = createDataSet()
    #Test set
    test = [101,20]
    #kNN classification
    test_class = classify0(test, group, labels, 3)
    #Print classification results
    print(test_class)
result

2.K-nearest neighbor algorithm to determine the pairing effect of dating websites
General process of K-nearest neighbor algorithm:
1. Data collection: crawlers can be used to collect data, and free or charged data provided by a third party can also be used. Generally speaking, the data is placed in txt text and stored in a certain format to facilitate analysis and processing.
2. Prepare data: use python to parse and preprocess data.
3. Analyze data: many methods can be used to analyze data, such as matplotlib for data visualization
4. Test algorithm: calculate the error rate
5. Use algorithm: if the error rate is within an acceptable range, you can run K-nearest neighbor algorithm for classification
2.1 actual combat background
Ms. Helen looks for her date on the online website. Although dating websites will recommend different candidates, she doesn't like everyone. She is divided into three categories:
didntLike
smallDises
largeDoses
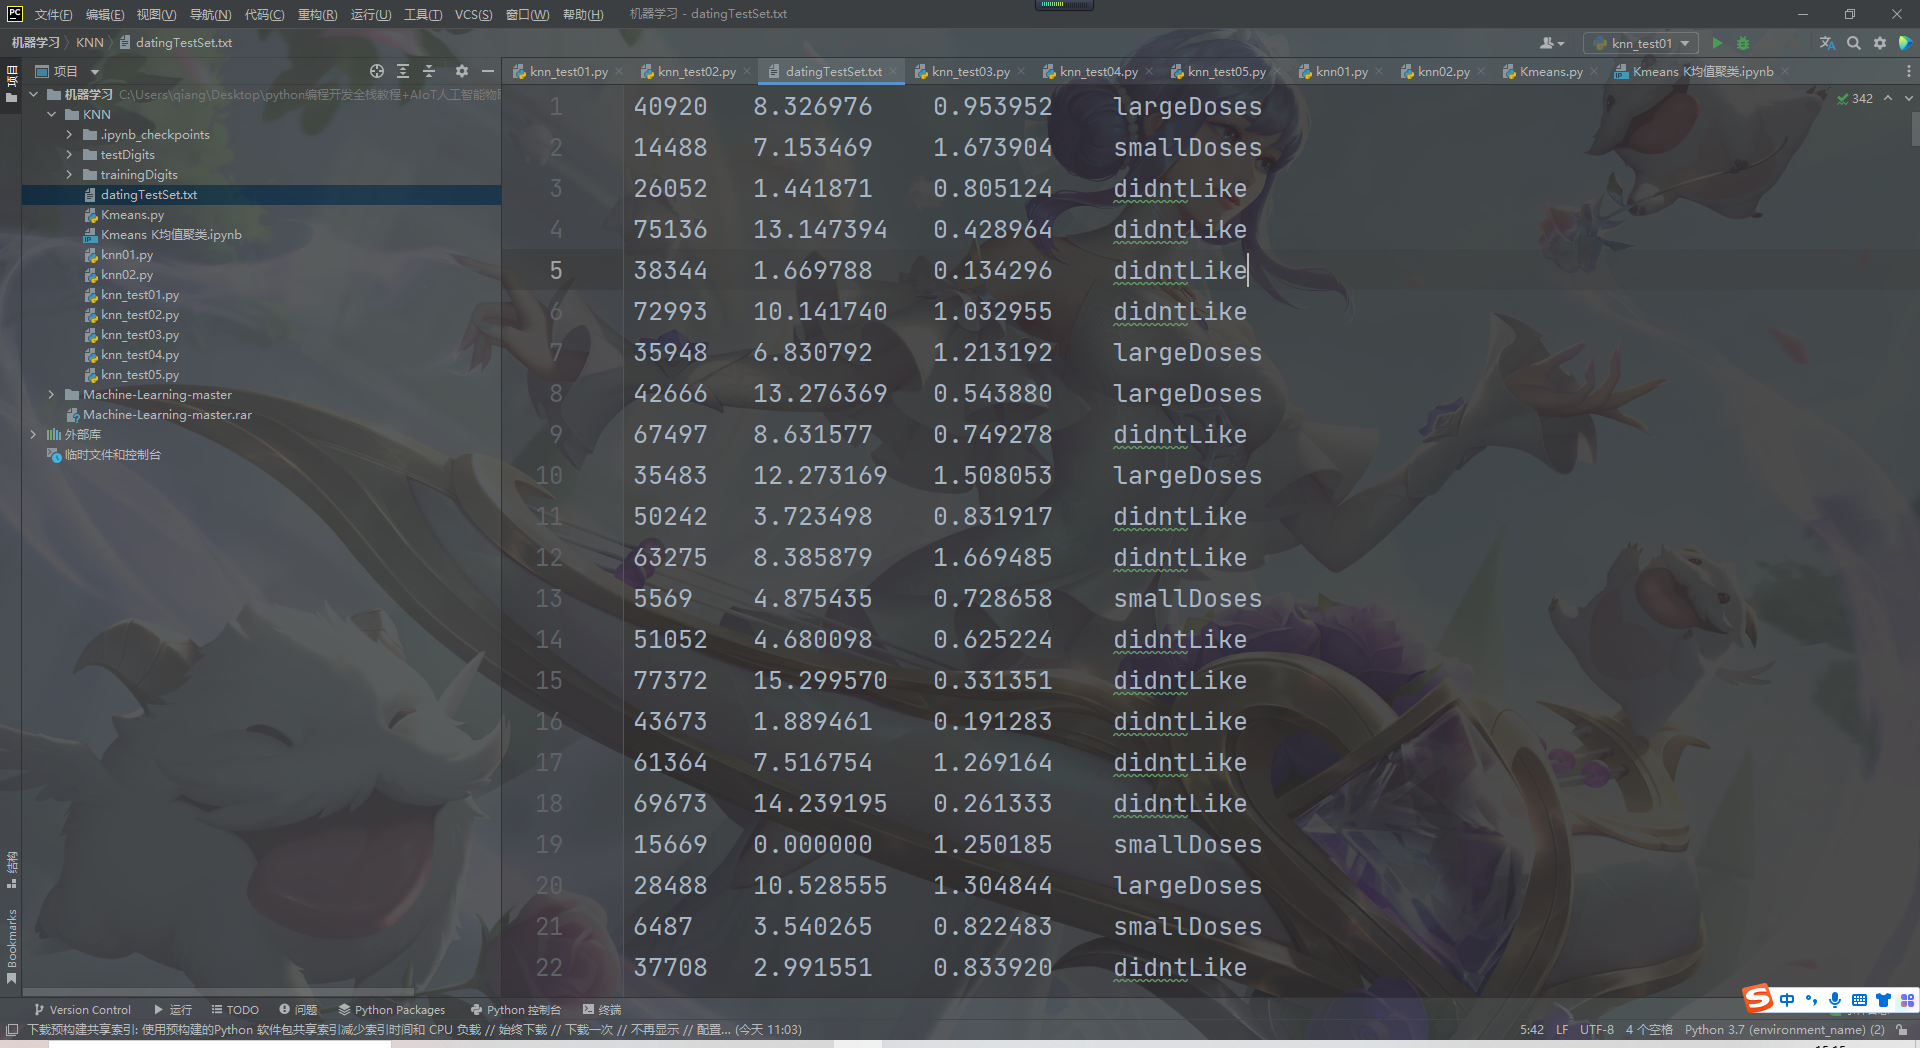
Put the data in datingtestset Txt file, each sample data occupies one line, with a total of 1000 lines.
The sample data collected by Helen mainly includes three characteristics:
Frequent flyer miles per year
Percentage of time spent playing video games
Litres of ice cream consumed per week
2.2 data preparation: data analysis
Before inputting data features into the classifier, the data format to be processed must be changed to the format that the classifier can receive. The data format received by the classifier is: feature matrix and corresponding classification label vector.
# -*- coding: UTF-8 -*-
import numpy as np
"""
Function description:Open and parse the file and classify the data: 1 means you don't like it,2 Represents general charm,3 The representative is very charming

Parameters:
    filename - file name
Returns:
    returnMat - Characteristic matrix
    classLabelVector - classification Label vector

Modify:
    2017-03-24
"""
def file2matrix(filename):
    #Open file
    fr = open(filename)
    #Read all contents of the file
    arrayOLines = fr.readlines()
    #Get the number of file lines
    numberOfLines = len(arrayOLines)
    #Returned NumPy matrix, parsed data: numberOfLines row, 3 columns
    returnMat = np.zeros((numberOfLines,3))
    #Returned category label vector
    classLabelVector = []
    #Index value of row
    index = 0
    for line in arrayOLines:
        #s.strip(rm). When rm is empty, the blank character (including '\ n','\r','\t', ') is deleted by default
        line = line.strip()
        #Use s.split(str="",num=string,cout(str)) to slice the string according to the '\ t' separator.
        listFromLine = line.split('\t')
        #The first three columns of data are extracted and stored in the NumPy matrix of returnMat, that is, the characteristic matrix
        returnMat[index,:] = listFromLine[0:3]
        #According to the degree of liking marked in the text, 1 represents dislike, 2 represents general charm and 3 represents great charm
        if listFromLine[-1] == 'didntLike':
            classLabelVector.append(1)
        elif listFromLine[-1] == 'smallDoses':
            classLabelVector.append(2)
        elif listFromLine[-1] == 'largeDoses':
            classLabelVector.append(3)
        index += 1
    return returnMat, classLabelVector

"""
Function description:main function

Parameters:
    nothing
Returns:
    nothing

Modify:
    2017-03-24
"""
if __name__ == '__main__':
    #Open file name
    filename = "datingTestSet.txt"
    #Open and process data
    datingDataMat, datingLabels = file2matrix(filename)
    print(datingDataMat)
    print(datingLabels)
The obtained characteristic matrix and label vector can be used for the next operation
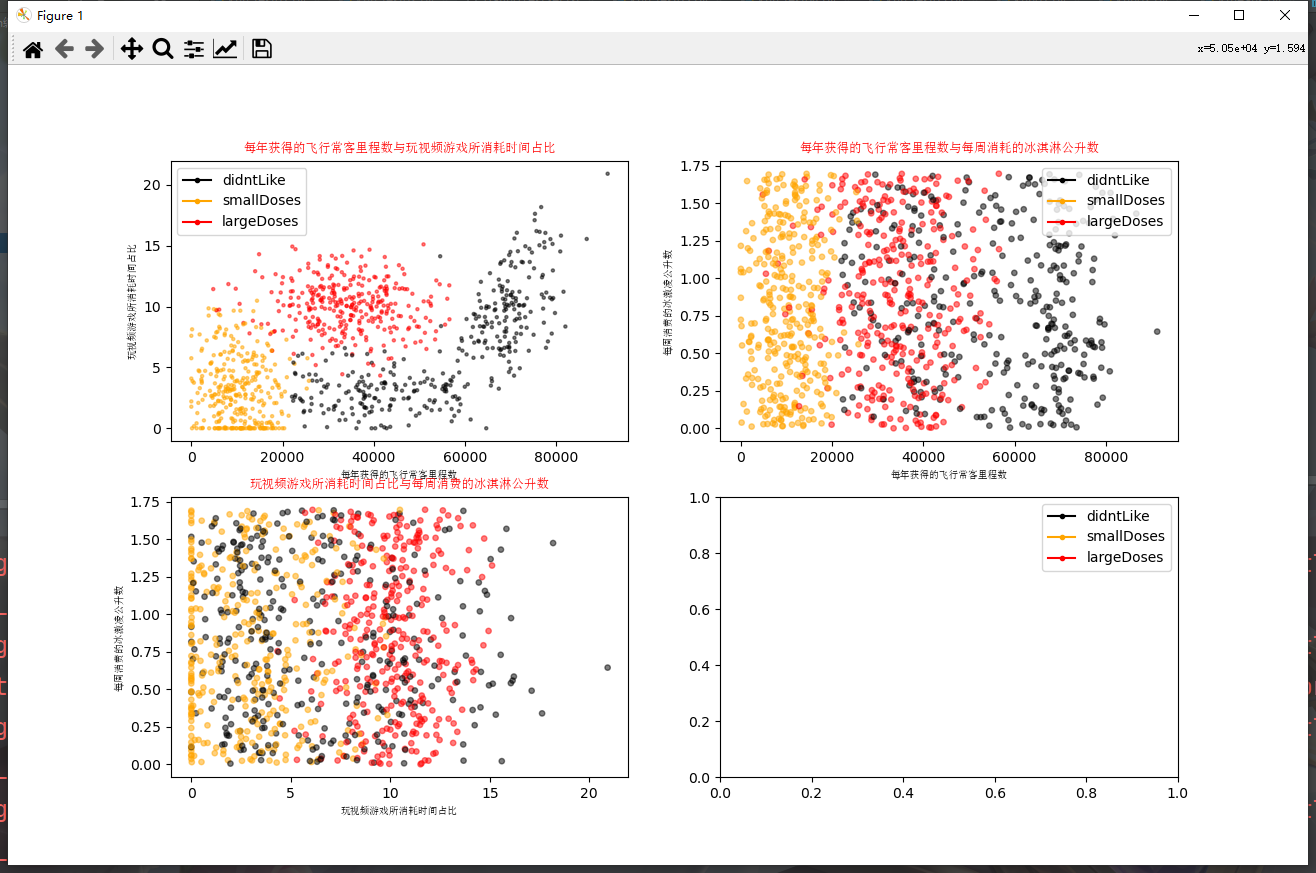
2.3 analysis data: Data Visualization
Write the function of showdata to visualize the data. The code is as follows:
# -*- coding: UTF-8 -*-

from matplotlib.font_manager import FontProperties
import matplotlib.lines as mlines
import matplotlib.pyplot as plt
import numpy as np

"""
Function description:Open and parse the file and classify the data: 1 means you don't like it,2 Represents general charm,3 The representative is very charming

Parameters:
    filename - file name
Returns:
    returnMat - Characteristic matrix
    classLabelVector - classification Label vector

Modify:
    2017-03-24
"""
def file2matrix(filename):
    #Open file
    fr = open(filename)
    #Read all contents of the file
    arrayOLines = fr.readlines()
    #Get the number of file lines
    numberOfLines = len(arrayOLines)
    #Returned NumPy matrix, parsed data: numberOfLines row, 3 columns
    returnMat = np.zeros((numberOfLines,3))
    #Returned category label vector
    classLabelVector = []
    #Index value of row
    index = 0
    for line in arrayOLines:
        #s.strip(rm). When rm is empty, the blank character (including '\ n','\r','\t', ') is deleted by default
        line = line.strip()
        #Use s.split(str="",num=string,cout(str)) to slice the string according to the '\ t' separator.
        listFromLine = line.split('\t')
        #The first three columns of data are extracted and stored in the NumPy matrix of returnMat, that is, the characteristic matrix
        returnMat[index,:] = listFromLine[0:3]
        #According to the degree of liking marked in the text, 1 represents dislike, 2 represents general charm and 3 represents great charm
        if listFromLine[-1] == 'didntLike':
            classLabelVector.append(1)
        elif listFromLine[-1] == 'smallDoses':
            classLabelVector.append(2)
        elif listFromLine[-1] == 'largeDoses':
            classLabelVector.append(3)
        index += 1
    return returnMat, classLabelVector

"""
Function description:Visual data

Parameters:
    datingDataMat - Characteristic matrix
    datingLabels - classification Label
Returns:
    nothing
Modify:
    2017-03-24
"""
def showdatas(datingDataMat, datingLabels):
    #Format Chinese characters
    font = FontProperties(fname=r"c:\windows\fonts\simsun.ttc", size=14)
    #The fig canvas is divided into one row and one column. The x-axis and y-axis are not shared. The size of the fig canvas is (13,8)
    #When nrow = 2 and nclos = 2, the representative fig canvas is divided into four areas, and axs[0][0] represents the first area in the first line
    fig, axs = plt.subplots(nrows=2, ncols=2,sharex=False, sharey=False, figsize=(13,8))

    numberOfLabels = len(datingLabels)
    LabelsColors = []
    for i in datingLabels:
        if i == 1:
            LabelsColors.append('black')
        if i == 2:
            LabelsColors.append('orange')
        if i == 3:
            LabelsColors.append('red')
    #Draw the scatter diagram, and draw the scatter data with the first (frequent flyer routine) and second column (game playing) data of the datingDataMat matrix. The scatter size is 15 and the transparency is 0.5
    axs[0][0].scatter(x=datingDataMat[:,0], y=datingDataMat[:,1], color=LabelsColors,s=15, alpha=.5)
    #Set title, x-axis label,y-axis label
    axs0_title_text = axs[0][0].set_title(u'Proportion of frequent flyer mileage obtained each year and time spent playing video games',FontProperties=font)
    axs0_xlabel_text = axs[0][0].set_xlabel(u'Frequent flyer miles per year',FontProperties=font)
    axs0_ylabel_text = axs[0][0].set_ylabel(u'Percentage of time spent playing video games',FontProperties=font)
    plt.setp(axs0_title_text, size=9, weight='bold', color='red')
    plt.setp(axs0_xlabel_text, size=7, weight='bold', color='black')
    plt.setp(axs0_ylabel_text, size=7, weight='bold', color='black')

    #Draw the scatter diagram, and draw the scatter data with the first (frequent flyer routine) and third column (ice cream) data of the datingDataMat matrix. The scatter size is 15 and the transparency is 0.5
    axs[0][1].scatter(x=datingDataMat[:,0], y=datingDataMat[:,2], color=LabelsColors,s=15, alpha=.5)
    #Set title, x-axis label,y-axis label
    axs1_title_text = axs[0][1].set_title(u'Frequent flyer miles earned per year and ice cream litres consumed per week',FontProperties=font)
    axs1_xlabel_text = axs[0][1].set_xlabel(u'Frequent flyer miles per year',FontProperties=font)
    axs1_ylabel_text = axs[0][1].set_ylabel(u'Litres of ice cream consumed per week',FontProperties=font)
    plt.setp(axs1_title_text, size=9, weight='bold', color='red')
    plt.setp(axs1_xlabel_text, size=7, weight='bold', color='black')
    plt.setp(axs1_ylabel_text, size=7, weight='bold', color='black')

    #Draw the scatter diagram, and draw the scatter data with the second (playing games) and third column (ice cream) data of the datingDataMat matrix. The scatter size is 15 and the transparency is 0.5
    axs[1][0].scatter(x=datingDataMat[:,1], y=datingDataMat[:,2], color=LabelsColors,s=15, alpha=.5)
    #Set title, x-axis label,y-axis label
    axs2_title_text = axs[1][0].set_title(u'Proportion of time spent playing video games and litres of ice cream consumed per week',FontProperties=font)
    axs2_xlabel_text = axs[1][0].set_xlabel(u'Percentage of time spent playing video games',FontProperties=font)
    axs2_ylabel_text = axs[1][0].set_ylabel(u'Litres of ice cream consumed per week',FontProperties=font)
    plt.setp(axs2_title_text, size=9, weight='bold', color='red')
    plt.setp(axs2_xlabel_text, size=7, weight='bold', color='black')
    plt.setp(axs2_ylabel_text, size=7, weight='bold', color='black')
    #Set legend
    didntLike = mlines.Line2D([], [], color='black', marker='.',
                      markersize=6, label='didntLike')
    smallDoses = mlines.Line2D([], [], color='orange', marker='.',
                      markersize=6, label='smallDoses')
    largeDoses = mlines.Line2D([], [], color='red', marker='.',
                      markersize=6, label='largeDoses')
    #Add legend
    axs[0][0].legend(handles=[didntLike,smallDoses,largeDoses])
    axs[0][1].legend(handles=[didntLike,smallDoses,largeDoses])
    axs[1][0].legend(handles=[didntLike,smallDoses,largeDoses])
    #display picture
    plt.show()

"""
Function description:main function

Parameters:
    nothing
Returns:
    nothing

Modify:
    2017-03-24
"""
if __name__ == '__main__':
    #Open file name
    filename = "datingTestSet.txt"
    #Open and process data
    datingDataMat, datingLabels = file2matrix(filename)
    showdatas(datingDataMat, datingLabels)
Run the code to see the data visualization results
2.4 data preparation: data normalization
Because the numerical attribute of each characteristic data has a great impact on the results, it is necessary to normalize the characteristic values and convert the data to between 0-1 or between - 1 and 1.
newValue = (oldValue - min) / (max - min)
Add the function of autoNorm to the above code, and use this function to automatically normalize the data. The code is as follows
# -*- coding: UTF-8 -*-
import numpy as np

"""
Function description:Open and parse the file and classify the data: 1 means you don't like it,2 Represents general charm,3 The representative is very charming

Parameters:
    filename - file name
Returns:
    returnMat - Characteristic matrix
    classLabelVector - classification Label vector

Modify:
    2017-03-24
"""
def file2matrix(filename):
    #Open file
    fr = open(filename)
    #Read all contents of the file
    arrayOLines = fr.readlines()
    #Get the number of file lines
    numberOfLines = len(arrayOLines)
    #Returned NumPy matrix, parsed data: numberOfLines row, 3 columns
    returnMat = np.zeros((numberOfLines,3))
    #Returned category label vector
    classLabelVector = []
    #Index value of row
    index = 0
    for line in arrayOLines:
        #s.strip(rm). When rm is empty, the blank character (including '\ n','\r','\t', ') is deleted by default
        line = line.strip()
        #Use s.split(str="",num=string,cout(str)) to slice the string according to the '\ t' separator.
        listFromLine = line.split('\t')
        #The first three columns of data are extracted and stored in the NumPy matrix of returnMat, that is, the characteristic matrix
        returnMat[index,:] = listFromLine[0:3]
        #According to the degree of liking marked in the text, 1 represents dislike, 2 represents general charm and 3 represents great charm
        if listFromLine[-1] == 'didntLike':
            classLabelVector.append(1)
        elif listFromLine[-1] == 'smallDoses':
            classLabelVector.append(2)
        elif listFromLine[-1] == 'largeDoses':
            classLabelVector.append(3)
        index += 1
    return returnMat, classLabelVector

"""
Function description:Normalize the data

Parameters:
    dataSet - Characteristic matrix
Returns:
    normDataSet - Normalized characteristic matrix
    ranges - Data range
    minVals - Data minimum

Modify:
    2017-03-24
"""
def autoNorm(dataSet):
    #Get the minimum value of data
    minVals = dataSet.min(0)
    maxVals = dataSet.max(0)
    #Range of maximum and minimum values
    ranges = maxVals - minVals
    #shape(dataSet) returns the number of matrix rows and columns of the dataSet
    normDataSet = np.zeros(np.shape(dataSet))
    #Returns the number of rows in the dataSet
    m = dataSet.shape[0]
    #Original value minus minimum value
    normDataSet = dataSet - np.tile(minVals, (m, 1))
    #The normalized data is obtained by dividing the difference between the maximum and minimum values
    normDataSet = normDataSet / np.tile(ranges, (m, 1))
    #Return normalized data result, data range and minimum value
    return normDataSet, ranges, minVals

"""
Function description:main function

Parameters:
    nothing
Returns:
    nothing

Modify:
    2017-03-24
"""
if __name__ == '__main__':
    #Open file name
    filename = "datingTestSet.txt"
    #Open and process data
    datingDataMat, datingLabels = file2matrix(filename)
    normDataSet, ranges, minVals = autoNorm(datingDataMat)
    print(normDataSet)
    print(ranges)
    print(minVals)
The result of running the code is as follows:

2.6 using algorithms: build a complete and usable system
Create classifyPerson in the file with the following code:
# -*- coding: UTF-8 -*-

import numpy as np
import operator

"""
Function description:kNN algorithm,classifier

Parameters:
    inX - Data for classification(Test set)
    dataSet - Data for training(Training set)
    labes - Classification label
    k - kNN Algorithm parameters,Select the one with the smallest distance k Point
Returns:
    sortedClassCount[0][0] - Classification results

Modify:
    2017-03-24
"""
def classify0(inX, dataSet, labels, k):
    #numpy function shape[0] returns the number of rows of dataSet
    dataSetSize = dataSet.shape[0]
    #Repeat inX once in the direction of column vector (horizontal), and inX times in the direction of row vector (vertical)
    diffMat = np.tile(inX, (dataSetSize, 1)) - dataSet
    #Square of two-dimensional feature subtraction
    sqDiffMat = diffMat**2
    #sum() adds all elements, sum(0) columns and sum(1) rows
    sqDistances = sqDiffMat.sum(axis=1)
    #Square off and calculate the distance
    distances = sqDistances**0.5
    #Returns the index value of the elements in distances sorted from small to large
    sortedDistIndices = distances.argsort()
    #Define a dictionary that records the number of times of a category
    classCount = {}
    for i in range(k):
        #Take out the category of the first k elements
        voteIlabel = labels[sortedDistIndices[i]]
        #dict.get(key,default=None), the get() method of the dictionary, returns the value of the specified key. If the value is not in the dictionary, it returns the default value.
        #Calculate the number of categories
        classCount[voteIlabel] = classCount.get(voteIlabel,0) + 1
    #Replace itemtems() in python2 with items() in python3
    #key=operator. Itemsetter (1) sorts by dictionary value
    #key=operator. Itemsetter (0) sorts by dictionary key
    #reverse descending sort dictionary
    sortedClassCount = sorted(classCount.items(),key=operator.itemgetter(1),reverse=True)
    #The category that returns the most times, that is, the category to be classified
    return sortedClassCount[0][0]


"""
Function description:Open and parse the file and classify the data: 1 means you don't like it,2 Represents general charm,3 The representative is very charming

Parameters:
    filename - file name
Returns:
    returnMat - Characteristic matrix
    classLabelVector - classification Label vector

Modify:
    2017-03-24
"""
def file2matrix(filename):
    #Open file
    fr = open(filename)
    #Read all contents of the file
    arrayOLines = fr.readlines()
    #Get the number of file lines
    numberOfLines = len(arrayOLines)
    #Returned NumPy matrix, parsed data: numberOfLines row, 3 columns
    returnMat = np.zeros((numberOfLines,3))
    #Returned category label vector
    classLabelVector = []
    #Index value of row
    index = 0
    for line in arrayOLines:
        #s.strip(rm). When rm is empty, the blank character (including '\ n','\r','\t', ') is deleted by default
        line = line.strip()
        #Use s.split(str="",num=string,cout(str)) to slice the string according to the '\ t' separator.
        listFromLine = line.split('\t')
        #The first three columns of data are extracted and stored in the NumPy matrix of returnMat, that is, the characteristic matrix
        returnMat[index,:] = listFromLine[0:3]
        #According to the degree of liking marked in the text, 1 represents dislike, 2 represents general charm and 3 represents great charm
        if listFromLine[-1] == 'didntLike':
            classLabelVector.append(1)
        elif listFromLine[-1] == 'smallDoses':
            classLabelVector.append(2)
        elif listFromLine[-1] == 'largeDoses':
            classLabelVector.append(3)
        index += 1
    return returnMat, classLabelVector

"""
Function description:Normalize the data

Parameters:
    dataSet - Characteristic matrix
Returns:
    normDataSet - Normalized characteristic matrix
    ranges - Data range
    minVals - Data minimum

Modify:
    2017-03-24
"""
def autoNorm(dataSet):
    #Get the minimum value of data
    minVals = dataSet.min(0)
    maxVals = dataSet.max(0)
    #Range of maximum and minimum values
    ranges = maxVals - minVals
    #shape(dataSet) returns the number of matrix rows and columns of the dataSet
    normDataSet = np.zeros(np.shape(dataSet))
    #Returns the number of rows in the dataSet
    m = dataSet.shape[0]
    #Original value minus minimum value
    normDataSet = dataSet - np.tile(minVals, (m, 1))
    #The normalized data is obtained by dividing the difference between the maximum and minimum values
    normDataSet = normDataSet / np.tile(ranges, (m, 1))
    #Return normalized data result, data range and minimum value
    return normDataSet, ranges, minVals

"""
Function description:By entering a person's 3D features,Perform classified output

Parameters:
    nothing
Returns:
    nothing

Modify:
    2017-03-24
"""
def classifyPerson():
    #Output results
    resultList = ['Disgusting','Some like','like it very much']
    #3D feature user input
    precentTats = float(input("Percentage of time spent playing video games:"))
    ffMiles = float(input("Frequent flyer miles per year:"))
    iceCream = float(input("Litres of ice cream consumed per week:"))
    #Open file name
    filename = "datingTestSet.txt"
    #Open and process data
    datingDataMat, datingLabels = file2matrix(filename)
    #Training set normalization
    normMat, ranges, minVals = autoNorm(datingDataMat)
    #Generate NumPy array and test set
    inArr = np.array([precentTats, ffMiles, iceCream])
    #Test set normalization
    norminArr = (inArr - minVals) / ranges
    #Return classification results
    classifierResult = classify0(norminArr, normMat, datingLabels, 3)
    #Print results
    print("You may%s this man" % (resultList[classifierResult-1]))

"""
Function description:main function

Parameters:
    nothing
Returns:
    nothing

Modify:
    2017-03-24
"""
if __name__ == '__main__':
    classifyPerson()
The operation results are as follows:


summary
Advantages and disadvantages of KNN algorithm
advantage
Simple and easy to use, easy to understand, high precision, can be used for classification or regression
It can be used for numerical and discrete data
The training time complexity is O (n), and there is no fixed input hypothesis
Insensitive to outliers
shortcoming
High computational complexity and space complexity
Sample imbalance problem (the number of samples in the existing category is large, while the number of other samples is small)
Generally, this is not used when the value is very large, and the amount of calculation is too large. However, a single sample should not be too small, otherwise it is prone to misclassification.
The biggest disadvantage is misclassification, which gives the internal meaning of the data.