1, Foreword
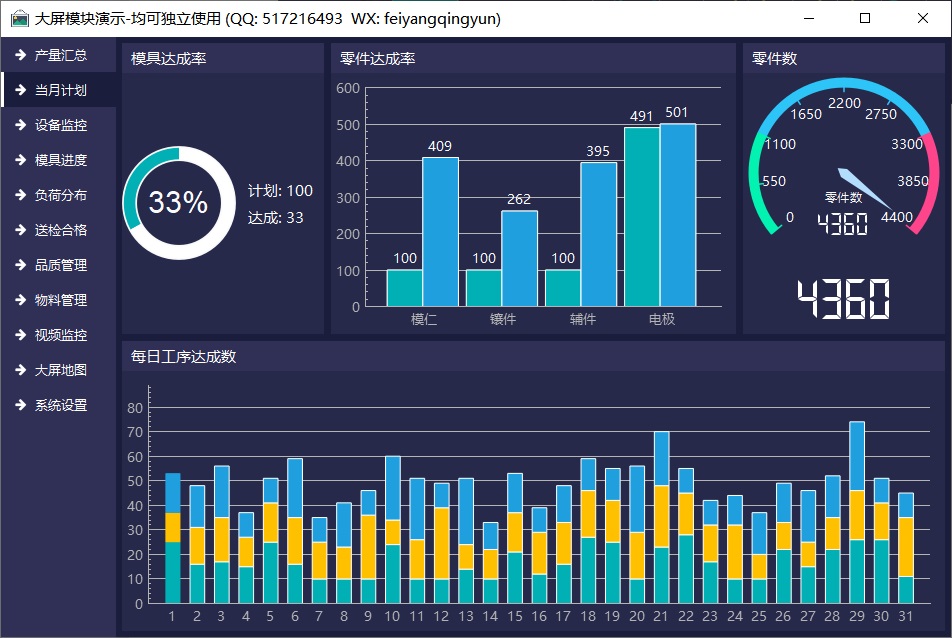
Continue the design idea of layered modularization. The plan module of the current month mainly includes five sub modules: mold achievement rate, part achievement rate, part number and daily process achievement number. The mold achievement rate is displayed by the ring chart of user-defined controls, such as how much is achieved according to the plan and how much is achieved as the progress; The achievement rate of parts is displayed in the vertical group diagram, and the corresponding completed quantity is displayed at the top of the histogram; The number of parts is displayed on the dashboard with user-defined controls; The number of processes achieved per day is displayed by standard histogram, and there are as many columns as there are days in the month.
In the whole visual large screen electronic Kanban system, in order to randomly generate random numbers in a reasonable range, a function is specially encapsulated for special processing, and the range value is passed in to generate random numbers from Qt5 The QRandomGenerator class has been built in since October to deal with this problem.
double QUIHelperOther::getRandValue(int min, int max, bool contansMin, bool contansMax)
{
    int value;
#if (QT_VERSION <= QT_VERSION_CHECK(5,10,0))
    //The general formula a is the starting value and n is the range of integers
    //int value = a + rand() % n;
    if (contansMin) {
        if (contansMax) {
            value = min + 0 + (rand() % (max - min + 1));
        } else {
            value = min + 0 + (rand() % (max - min + 0));
        }
    } else {
        if (contansMax) {
            value = min + 1 + (rand() % (max - min + 0));
        } else {
            value = min + 1 + (rand() % (max - min - 1));
        }
    }
#else
    if (contansMin) {
        if (contansMax) {
            value = QRandomGenerator::global()->bounded(min + 0, max + 1);
        } else {
            value = QRandomGenerator::global()->bounded(min + 0, max + 0);
        }
    } else {
        if (contansMax) {
            value = QRandomGenerator::global()->bounded(min + 1, max + 1);
        } else {
            value = QRandomGenerator::global()->bounded(min + 1, max + 0);
        }
    }
#endif
    return value;
}
Corresponding table of sub module table name:
| Sub module title | Sub module table name |
|---|---|
| Mold achievement rate | t_2_1_mold_achie_rate |
| Part achievement rate | t_2_2_wp_achie_rate |
| Number of parts | t_2_3_wp_achie_number |
| Daily process completion | t_2_4_process_achie_number |
1. Mold achievement rate
Table name: t_2_1_mold_achie_rate
| Field name | Chinese name | type | length | explain |
|---|---|---|---|---|
| internal_id | Serial number | INTEGER | 11 | Primary key auto increment |
| plan | Planned number | INTEGER | 11 | :------ |
| achieved | Achieved number | INTEGER | 11 | :------ |
Default data: 1 200 110
2 parts achievement rate
Table name: t_2_2_wp_achie_rate
| Field name | Chinese name | type | length | explain |
|---|---|---|---|---|
| internal_id | Serial number | INTEGER | 11 | Primary key auto increment |
| name | name | VARCHAR | 255 | Not empty |
| plan | Planned number | INTEGER | 11 | :------ |
| achieved | Achieved number | INTEGER | 11 | :------ |
Default data:
| internal_id | name | plan | achieved |
|---|---|---|---|
| 1 | Mold kernel | 100 | 200 |
| 2 | Insert | 122 | 100 |
| 3 | Accessories | 300 | 500 |
| 4 | electrode | 155 | 200 |
3 number of parts
Table name: t_2_3_wp_achie_number
| Field name | Chinese name | type | length | explain |
|---|---|---|---|---|
| internal_id | Serial number | INTEGER | 11 | Primary key auto increment |
| wp_achie_number | Number of parts | INTEGER | 11 | :------ |
Default data: 1 1234
4 daily process completion
Table name: t_2_4_process_achie_number
| Field name | Chinese name | type | length | explain |
|---|---|---|---|---|
| internal_id | Serial number | INTEGER | 11 | Primary key auto increment |
| day | date | VARCHAR | 2 | :------ |
| green | Green quantity | INTEGER | 11 | :------ |
| blue | Blue quantity | INTEGER | 11 | :------ |
| red | Red quantity | INTEGER | 11 | :------ |
Default data:
| internal_id | day | green | blue | red |
|---|---|---|---|---|
| 1 | 1 | 20 | 3 | 0 |
| 2 | 2 | 20 | 2 | 0 |
| 3 | 3 | 23 | 3 | 0 |
| 4 | 4 | 32 | 4 | 0 |
| 5 | 5 | 43 | 5 | 0 |
| 6 | 6 | 23 | 3 | 0 |
| 7 | 7 | 44 | 0 | 5 |
| 8 | 8 | 12 | 0 | 5 |
| 9 | 9 | 54 | 0 | 4 |
| 10 | 10 | 42 | 0 | 3 |
| 11 | 11 | 47 | 6 | 0 |
| 12 | 12 | 34 | 4 | 0 |
| 13 | 13 | 25 | 3 | 0 |
| 14 | 14 | 38 | 6 | 0 |
| 15 | 15 | 43 | 0 | 4 |
| 16 | 16 | 56 | 0 | 3 |
| 17 | 17 | 65 | 4 | 0 |
| 18 | 18 | 43 | 5 | 0 |
| 19 | 19 | 34 | 0 | 5 |
| 20 | 20 | 55 | 3 | 0 |
| 21 | 21 | 47 | 6 | 0 |
| 22 | 22 | 34 | 4 | 0 |
| 23 | 23 | 25 | 3 | 0 |
| 24 | 24 | 38 | 6 | 0 |
| 25 | 25 | 43 | 0 | 4 |
| 26 | 26 | 56 | 0 | 3 |
| 27 | 27 | 65 | 4 | 0 |
| 28 | 28 | 43 | 5 | 0 |
| 29 | 29 | 34 | 0 | 5 |
| 30 | 30 | 55 | 3 | 0 |
| 31 | 31 | 42 | 0 | 3 |
2, Functional features
- The layered design is adopted, and the overall interface is divided into three levels. The first level interface is the overall layout, the second level interface is a single functional module, and the third level interface is a single control.
- Sub controls include pie chart, doughnut chart, curve chart, histogram, column grouping chart, horizontal histogram, horizontal column grouping chart, qualification rate control, percentage control, progress control, equipment status panel, table data, map control, video control, etc.
- The secondary interface can drag and float freely, and supports minimizing hiding, maximizing closing, and responding to double clicking the custom title bar.
- The data source supports analog data (default), database collection, serial communication (customized), network communication (customized), network request, etc. the collection interval of each sub interface, i.e. data refresh frequency, can be freely set.
- Written with pure QWidget and tested Qt4 6 to Qt6 2 any version, which theoretically supports other subsequent Qt versions.
- Super cross platform, personal testing of windows, linux, mac, domestic uos, domestic Galaxy kylin and other systems, with perfect results. At the same time, it also supports embedded linux, such as raspberry pie, Orange Pie, Quanzhi, imx6 and so on.
- At the same time, it integrates user-defined controls, qchart pie chart, echart map and other functions.
- Built in multiple sets of color matching styles (purple, blue, dark blue, black), default purple, adaptive to any resolution.
- You can set the system title, target resolution and layout scheme, and start the immediate application.
- You can set the main background color, panel color, crosshair cursor color and other colors.
- Multiple curves can be set with different colors. If no color is set, multiple sets of exquisite colors are built in and applied randomly.
- You can set the background color and text color of the title block.
- You can set the background color, text color and grid color of the curve chart.
- Normal color, warning color, alarm color, disabled color and percentage progress color can be set.
- Various font sizes can be set separately, such as global font, software name, title bar, sub title bar, bold label, etc.
- You can set the height of title block, header and row.
- Curves support cursors, positioning lines, hovering highlighted data points, and hovering display values.
- The bar chart supports the display of data at the top (top, upper, middle and bottom can be set), and all adaptive calculation positions.
- Support smooth curve, built-in multiple smooth curve algorithms, and support area map smoothing.
- A variety of rules can be selected for the filling color of the area map, such as monochrome transparency filling, transparency gradient filling, etc.
- The database supports sqlite, mysql, postgresql, oracle, National People's Congress gold warehouse and other databases.
- In the main interface, right-click to switch layout, color scheme, close and open a secondary form.
- Automatically memorize the size and position of all sub windows, and apply immediately after the next startup.
- Dynamically load the layout scheme menu. You can dynamically create, restore, save and save layouts. You can create any layout.
- Secondary form, double-click to separate from the main form and float, and you can adjust the size freely. Double click the title bar again to maximize and double-click restore again.
- The sub module can also be displayed in full screen as a large screen, so that multiple sub large screens can be expanded from one large screen. Zoom in to view the data details of the sub module, which is suitable for multi screen display.
- Each module can customize the collection speed. If it is database collection, it will be automatically queued for processing. In the later stage, it can also expand the independent database collection of each sub module.
- The system setting module is provided to set the overall configuration parameters, and the effect is applied immediately.
- Provide exquisite and cool large screen map modules, including static pictures, flickering effects, migration effects, world maps, regional maps, etc. you can specify the longitude and latitude coordinates of points, identify click responses, make map jumps, etc. each point can have different colors and prompt information.
- In addition to providing a large screen system, each module is also provided with an independent module example interface, which can be learned and used independently. The controls used in it are also provided with a separate control example interface to facilitate learning how to use each control.
- Very detailed development and user manual, including database description, module comparison diagram, control comparison diagram, project structure, code description (accurate to each class), demonstration demo, usage method, etc.
3, Experience address
- Experience address: https://pan.baidu.com/s/1d7TH_GEYl5nOecuNlWJJ7g Extraction code: 01jf file name: bin_bigscreen.zip.
- Domestic sites: https://gitee.com/feiyangqingyun
- International sites: https://github.com/feiyangqingyun
- Personal homepage: https://blog.csdn.net/feiyangqingyun
- Zhihu homepage: https://www.zhihu.com/people/feiyangqingyun/
- Online documentation: https://feiyangqingyun.gitee.io/qwidgetdemo/bigscreen/
4, Renderings
5, Core code
#include "frmmodule2.h"
#include "ui_frmmodule2.h"
#include "quihelper.h"

frmModule2::frmModule2(QWidget *parent) : QWidget(parent), ui(new Ui::frmModule2)
{
    ui->setupUi(this);
    this->initForm();
    this->initRing();
    this->initGauge();
    this->initPlot1();
    this->initPlot2();
}

frmModule2::~frmModule2()
{
    delete ui;
}

void frmModule2::initForm()
{
    //Set the corresponding properties and apply a specific style
    ui->labTitle1->setProperty("flag", "title");
    ui->labTitle2->setProperty("flag", "title");
    ui->labTitle3->setProperty("flag", "title");
    ui->labTitle4->setProperty("flag", "title");

    ui->widgetSub1->setProperty("flag", "sub");
    ui->widgetSub2->setProperty("flag", "sub");
    ui->widgetSub3->setProperty("flag", "sub");
    ui->widgetSub4->setProperty("flag", "sub");
    ui->widgetLab->setProperty("flag", "lab");

    //Timer analog data
    timer = new QTimer(this);
    connect(timer, SIGNAL(timeout()), this, SLOT(loadRing()));
    connect(timer, SIGNAL(timeout()), this, SLOT(loadGauge()));
    connect(timer, SIGNAL(timeout()), this, SLOT(loadPlot1()));
    connect(timer, SIGNAL(timeout()), this, SLOT(loadPlot2()));

    //Binding signal slot processing received data + sending execution query statement
    connect(DbData::DbLocal, SIGNAL(receiveData(QString, QStringList, int)),
            this, SLOT(receiveData(QString, QStringList, int)));
    connect(DbData::DbHttp, SIGNAL(receiveData(QString, QStringList, int)),
            this, SLOT(receiveData(QString, QStringList, int)));

    //Binding style change signal reloads data
    connect(AppEvent::Instance(), SIGNAL(changeStyle()), this, SLOT(start()));
}

void frmModule2::receiveData(const QString &tag, const QStringList &data, int mesc)
{
    int count = data.count();
    if (tag == "t_2_1_mold_achie_rate") {
        if (count % 2 == 0) {
            double value1 = data.at(0).toDouble();
            double value2 = data.at(1).toDouble();
            double percent = value2 / value1;
            percent = percent * 100;
            loadRing(value1, value2, percent);
        }
    } else if (tag == "t_2_3_wp_achie_number") {
        if (count % 1 == 0) {
            int value = data.at(0).toInt();
            loadGauge(value);
        }
    } else if (tag == "t_2_2_wp_achie_rate") {
        if (count % 3 == 0) {
            rowNames1.clear();
            vdouble value1, value2;
            for (int i = 0; i < count; i = i + 3) {
                rowNames1 << data.at(i);
                value1 << data.at(i + 1).toDouble();
                value2 << data.at(i + 2).toDouble();
            }

            loadPlot1(lvdouble() << value1 << value2);
        }
    } else if (tag == "t_2_4_process_achie_number") {
        if (count % 4 == 0) {
            rowNames2.clear();
            vdouble value1, value2, value3;
            for (int i = 0; i < count; i = i + 4) {
                rowNames2 << data.at(i);
                value1 << data.at(i + 1).toDouble();
                value2 << data.at(i + 2).toDouble();
                value3 << data.at(i + 3).toDouble();
            }

            loadPlot2(lvdouble() << value1 << value2 << value3);
        }
    }
}

void frmModule2::initRing()
{
    ui->progressRing->setRingWidth(20);
    ui->progressRing->setRingPadding(3);
    ui->progressRing->setClockWise(false);
    ui->progressRing->setShowPercent(true);
}

void frmModule2::loadRing()
{
    QString tableName = "t_2_1_mold_achie_rate";
    QString columnName = "plan,achieved";

    if (AppConfig::WorkMode == "timer") {
        int value = QUIHelper::getRandValue(20, 100);
        loadRing(100, value, value);
    } else if (AppConfig::WorkMode == "db") {
        DbData::DbLocal->select(tableName, columnName, true);
    } else if (AppConfig::WorkMode == "http") {
        DbData::DbHttp->select(tableName, columnName, true);
    }
}

void frmModule2::loadRing(int max, int value, int percent)
{
    if (percent > 100) {
        ui->progressRing->setValue(percent);
        ui->progressRing->setText(QString("%1%").arg(percent));
    } else {
        ui->progressRing->setValue(percent);
        ui->progressRing->setText("");
    }

    ui->labMax->setText(QString("plan: %1").arg(max));
    ui->labValue->setText(QString("reach: %1").arg(value));
}

void frmModule2::initGauge()
{
    ui->gaugeSpeed->setUnit("");
    ui->gaugeSpeed->setText("Number of parts");
    ui->gaugeSpeed->setPrecision(0);

    ui->lcdNumber->setFixedHeight(50);
    ui->lcdNumber->setSegmentStyle(QLCDNumber::Flat);
}

void frmModule2::loadGauge()
{
    QString tableName = "t_2_3_wp_achie_number";
    QString columnName = "wp_achie_number";

    if (AppConfig::WorkMode == "timer") {
        loadGauge(QUIHelper::getRandValue(1000, 6000));
    } else if (AppConfig::WorkMode == "db") {
        DbData::DbLocal->select(tableName, columnName, true);
    } else if (AppConfig::WorkMode == "http") {
        DbData::DbHttp->select(tableName, columnName, true);
    }
}

void frmModule2::loadGauge(int value)
{
    //Judge the length according to the value
    int len = QString::number(value).length();
    ui->gaugeSpeed->setDigitCount(len);
    ui->lcdNumber->setDigitCount(len);

    //Maximum value = the value is rounded up to a hundred
    int max = (value / 100 + 1) * 100;
    ui->gaugeSpeed->setRange(0, max);
    ui->gaugeSpeed->setValue(value);
    ui->lcdNumber->display(value);
}

void frmModule2::initPlot1()
{
    rowNames1 << "Mold kernel" << "Insert" << "Accessories" << "electrode";
    columnNames1 << "Series 1" << "Series 2";
}

void frmModule2::loadPlot1()
{
    QString tableName = "t_2_2_wp_achie_rate";
    QString columnName = "name,plan,achieved";

    if (AppConfig::WorkMode == "timer") {
        double min = 100, max = 600;
        vdouble value1, value2;
        for (int i = 0; i < rowNames1.count(); ++i) {
            value1 << QUIHelper::getRandValue(min, max);
            value2 << QUIHelper::getRandValue(min, max);
        }
        loadPlot1(lvdouble() << value1 << value2);
    } else if (AppConfig::WorkMode == "db") {
        DbData::DbLocal->select(tableName, columnName, true);
    } else if (AppConfig::WorkMode == "http") {
        DbData::DbHttp->select(tableName, columnName, true);
    }
}

void frmModule2::loadPlot1(const lvdouble &values)
{
    ui->customPlot1->clear();
    double maxY = CustomPlotHelper::getMaxValue(values) * 1.2;
    ui->customPlot1->setRangeY(0, maxY, AppConfig::StepY);

    //Set column data structure
    BarData data;
    data.rowNames = rowNames1;
    data.columnNames = columnNames1;
    data.values = values;
    data.borderColor = AppConfig::ColorChartText;
    data.valuePosition = 1;
    data.valuePrecision = 0;
    data.valueColor = AppConfig::ColorChartText;
    ui->customPlot1->setDataBarvs(data);
    ui->customPlot1->replot();
}

void frmModule2::initPlot2()
{
    columnNames2 << "Series 1" << "Series 2" << "Series 3";
}

void frmModule2::loadPlot2()
{
    QString tableName = "t_2_4_process_achie_number";
    QString columnName = "day,green,blue,red";

    if (AppConfig::WorkMode == "timer") {
        int dataCount = 31;
        if (QUIHelper::deskWidth() <= 1440) {
            dataCount = 20;
        }

        rowNames2.clear();
        vdouble value1, value2, value3;
        for (int i = 0; i < dataCount; i++) {
            rowNames2 << QString("%1").arg(i + 1);
            value1 << QUIHelper::getRandValue(10, 30);
            value2 << QUIHelper::getRandValue(10, 30);
            value3 << QUIHelper::getRandValue(10, 30);
        }

        loadPlot2(lvdouble() << value1 << value2 << value3);
    } else if (AppConfig::WorkMode == "db") {
        DbData::DbLocal->select(tableName, columnName, true);
    } else if (AppConfig::WorkMode == "http") {
        DbData::DbHttp->select(tableName, columnName, true);
    }
}

void frmModule2::loadPlot2(const lvdouble &values)
{
    ui->customPlot2->clear();
    double maxY = CustomPlotHelper::getMaxValue2(values) * 1.2;
    ui->customPlot2->setRangeY(0, maxY, AppConfig::StepY);

    //Set column data structure
    BarData data;
    data.rowNames = rowNames2;
    data.columnNames = columnNames2;
    data.values = values;
    ui->customPlot2->setDataBars(data);
    ui->customPlot2->replot();
}

void frmModule2::start(int interval)
{
    this->loadGauge();
    this->loadRing();
    this->loadPlot1();
    this->loadPlot2();

    //If the interval is too short, it means that there is no need to refresh, just execute it once
    if (interval > 2000) {
        timer->start(interval);
    }
}

void frmModule2::stop()
{
    if (timer->isActive()) {
        timer->stop();
    }
}