About the author: program ape stone (ID: tangleishu), now Alibaba technical expert, Tsinghua xueslag, former Dajiang back-end Leader. Share high-quality technical articles from different perspectives for the purpose of making people gain from each article. Welcome to pay attention, exchange and guidance!
background
These two days, the ranking results of the index points of the first batch of household new energy passenger cars in Beijing were released.
Of course, as expected, unfortunately, I was not shortlisted and ranked around 8W. It seems that if we want to rank the scores of new energy, we have to pay close attention to increasing the number of generations of families. If we have a baby, my score is close to 60, and I still hope to be ranked as soon as possible.

Integral sorting result
Look at the data
Let's see what these data are like?
The website has downloaded pdf, which is not convenient for analysis. Obviously, as a program ape, I am still used to analyzing in the way of programmers. First of all, I'd better turn it into a plain text file, which can be converted into csv. (download address on official website: https://www.bjhjyd.gov.cn/jggb/2020910/1599732631719_1.htm )
- There are tools on the Internet, which can upload pdf and transfer to csv.
- You can copy it directly and paste plain text. The author adopted this method very quickly.
Based on the previous two articles, the following data can be easily obtained:
- 20 + command line artifact to improve development efficiency N times! (with demo)
- Didn't expect the shell command to play like this| Shell big data analysis
Because the copy comes out in plain text, the name and ID card are connected together. It needs to be split. It's very simple:
cat car2020.csv | awk '{print substr($3, 1, match($3,/[0-9]/)-1) "\t" substr($3, match($3,/[0-9]/)) "\t" $4 "\t" $5 "\t" $6 "\t" $7}' > car-2020.csv

Lottery data set csv
Score analysis
First, the file results are directly in reverse order of scores.
- The highest score is 228, and the family is composed of 7 people.
- The lowest score is 72, with most families with 4 people in 2 generations and 4 people in 3 generations.
cat car-2020.csv | awk '{print $5}' | uniq -c | sort -k 1 -nr

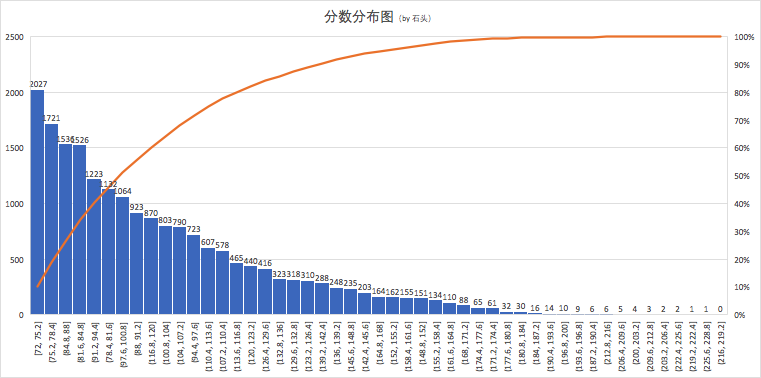
Integral distribution

Look at the distribution of scores. Most of them are around 70-120 points, accounting for 80%.
Family situation
Nearly 70% of family algebra are three generations.
➜ Downloads cat car-2020.csv | awk '{print $4}'  | sort | uniq -c
6621 2
13379 3

- There are 9 people in the family. After looking at it, there are three generations of nine people. Guess that both parents have 4 + two 2 + 3 children? Anyway, I think the main family applicants have applied for lottery since the first phase. It's not easy for such a big family without a license plate.

➜  Downloads cat car-2020.csv | awk '{print $3}'  | sort | uniq -c
4245 3
5124 4
6912 5
2284 6
1240 7
 193 8
   2 9
Principal applicant
Too many people have been involved in lottery since the first year.
➜  Downloads cat car-2020.csv | awk '{print substr($6, 1, 4)}'  | sort | uniq -c
6874 2011
7401 2012
3729 2013
1384 2014
 482 2015
 111 2016
  19 2017

Look, there are 1367 from the first wave.
➜  Downloads cat car-2020.csv | awk '{print substr($6, 1, 7)}'  | sort | uniq -c
1367 2011-01
 797 2011-02
 665 2011-03
 519 2011-04
 473 2011-05
 356 2011-06
 424 2011-07
 448 2011-08
 407 2011-09
 516 2011-10
 434 2011-11
 468 2011-12
Where does the winner come from?
This requires the help of the administrative area corresponding to the ID number. Didn't expect the shell command to play like this| Shell playing big data analysis As in this article, let's draw a conclusion directly.
- Let's first look at the division according to the provincial level.
➜  Downloads join -1 2 -2 1 <(cat car-2020.csv | awk '{print substr($2, 1, 2)}' |sort | uniq -c | sort -k1 -nr | head -n 30 | sort -k2) id-area.code2.sort.txt | sort -k2 -nr
11 14792 Beijing
13 1101 Hebei Province
37 638 Shandong Province
41 360 Henan Province
14 330 Shanxi Province
23 296 Heilongjiang Province
21 291 Liaoning Province
42 239 Hubei province
15 224 Inner Mongolia Autonomous Region
22 217 Jilin Province
43 175 Hunan Province
61 174 Shaanxi Province
34 169 Anhui Province
32 162 Jiangsu Province
51 161 Sichuan Province
36 135 Jiangxi Province
12 107 Tianjin
62 82 Gansu Province
33 64 Zhejiang Province
35 53 Fujian Province
65 46 Xinjiang Uygur Autonomous Region
64 34 Ningxia Hui Autonomous Region
45 33 Guangxi Zhuang Autonomous Region
50 21 Chongqing City
63 19 Qinghai Province
53 19 Yunnan Province
44 19 Guangdong Province
52 17 Guizhou Province
31 12 Shanghai
46 6 Hainan
- The first column: the first two digits of the ID card are basically located in the province;
- Column 2: corresponding number of people
- Column 3: corresponding province

It can be seen that old Beijing still accounts for the largest proportion, accounting for 74%. Stone wanted to find a free thermal map generation tool to show it. I didn't find it for a short time, so I gave up first.
- If you look at the urban level, please refer to the top 6 of your ID card.
Let's take a look at the top 30, which basically revolves around Beijing.
➜  Downloads join -1 2 -2 1 <(cat car-2020.csv | awk '{print substr($2, 1, 6)}' |sort | uniq -c | sort -k1 -nr | head -n 30 | sort -k2) address_code_uniq.csv | sort -k2 -nr
110111 1592 Fangshan District
110223 1531 Tongxian
110224 1439 Daxing County
110108 1109 Haidian District
110105 1108 Chaoyang District
110222 1075 Shunyi County
110229 846 Yanqing County
110106 734 Fengtai District
110221 725 Changping County
110226 610 Pinggu County
110228 599 Miyun County
110102 570 Xicheng District
110227 557 Huairou County
110101 475 Dongcheng District
110104 471 Xuanwu District
110109 415 Mentougou District
110103 382 Chongwen District
110107 332 Shijingshan District
110225 189 Fangshan County
131082 43 Sanhe City
230103 34 Nangang District
140202 28 city proper
110110 25 Yanshan District
220104 24 Chaoyang District
150102 23 New urban area
130102 23 Chang'an District
610103 22 Beilin District
130203 21 Lubei District
420106 19 Wuchang District
130681 18 Zhuozhou
Where, address_code_uniq.csv from https://raw.githubusercontent.com/jxlwqq/address-code-of-china/master/address_code.csv , there is a hole in the administrative region code data downloaded from the official government website http://www.mca.gov.cn//article/sj/xzqh/2020/ It is the latest. Some administrative region codes have been revoked and are no longer used. (thanks to Shitou's verification and data synthesis, it is found that there is a large difference from the total number of 2000)
But the ID card that has been issued before can't be invalidated. For example, the administrative division code 110223 (Tongxian County, Beijing) has been revoked and will no longer be used in the newly issued ID card.
In addition, it was found that one case did not use ID card number as the ID number. Looks like a passport? CH1HFP ********** I don't understand this. Do you have any friends who know?
That's all for now. In addition, if interested friends need the data set analyzed in this article for exchange and learning, they can reply to "score sorting" to obtain and process Excel and CSV files.
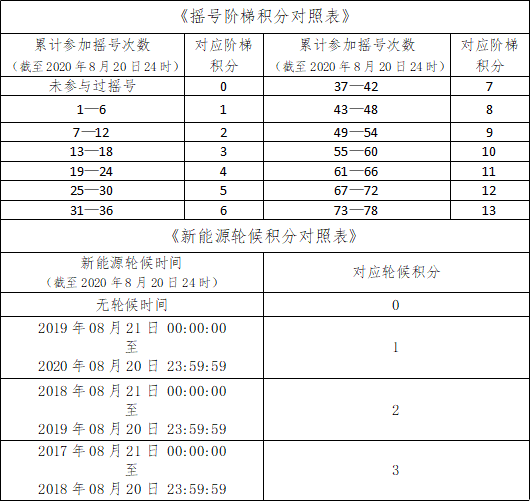
Attached is the comparison table of Yaohao problem solving points

Back to the topic itself, this ㊙️ The secret is: if you want to win the lottery as soon as possible, give birth to a baby. Hahaha, don't hit me.