ant batch execute Jmeter
1, Environmental preparation
1. JDK environment: Java Downloads | Oracle
2. ANT environment: Apache Ant - Binary Distributions
3,Jmeter: Apache JMeter - Download Apache JMeter
4. Add ant-jmeter-1.1.1. To the extras directory of JMeter Copy the jar package to the lib directory under the ant installation directory
5. Modify Jmeter in the bin directory of Jmeter Configuration of properties file: Jmeter save. saveservice. output_ format=xml
After the above three configurations of environment variables, you can start to enter the wonderful world of continuous integration of interface automation
2, Jmeter script preparation
Refer to: http://www.cnblogs.com/hito/p/5050769.html
3, ant's build XML file
<?xml version="1.0" encoding="UTF-8"?>
<project name="ant-jmeter-test" default="run">
    <tstamp>
        <format property="time" pattern="yyyyMMddhhmm" />
    </tstamp>
    <property name="jmeter.home" value="D:\SoftWare\Jmeter\apache-jmeter-2.13" />
    <property name="report.title" value="SoaTestReport"/>
    <property name="jmeter.result.jtl.dir" value="D:\Jmeter\result\jtl" />
    <property name="jmeter.result.html.dir" value="D:\Jmeter\result\html" />
    <property name="ReportName" value="TestReport" />
    <property name="jmeter.result.jtlName" value="${jmeter.result.jtl.dir}/${ReportName}${time}.jtl" />
    <property name="jmeter.result.htmlName" value="${jmeter.result.html.dir}/${ReportName}${time}.html" />

    <target name="run">
        <antcall target="test" />
        <antcall target="report" />
    </target>

    <target name="test">
        <taskdef name="jmeter" classname="org.programmerplanet.ant.taskdefs.jmeter.JMeterTask" />
        <jmeter jmeterhome="${jmeter.home}" resultlog="${jmeter.result.jtlName}">
            <testplans dir="D:\Jmeter\script" includes="*.jmx" />

            <property name="jmeter.save.saveservice.output_format" value="xml"/>
        </jmeter>
    </target>

    <path id="xslt.classpath">
        <fileset dir="${jmeter.home}/lib" includes="xalan*.jar"/>
        <fileset dir="${jmeter.home}/lib" includes="serializer*.jar"/>
    </path>

    <target name="report">
        <tstamp> <format property="report.datestamp" pattern="yyyy/MM/dd HH:mm" /></tstamp>
        <xslt
              classpathref="xslt.classpath"
              force="true"
              in="${jmeter.result.jtlName}"
              out="${jmeter.result.htmlName}"
              style="${jmeter.home}/extras/jmeter-results-detail-report_21.xsl">
              <param name="dateReport" expression="${report.datestamp}"/>
       </xslt>

        <copy todir="${jmeter.result.html.dir}">
            <fileset dir="${jmeter.home}/extras">
                <include name="collapse.png" />
                <include name="expand.png" />
            </fileset>
        </copy>
    </target>
</project>
4, Execute
Enter build XML file path, Shift + right-click, select here to open the command line, enter the command: ant, and then enter
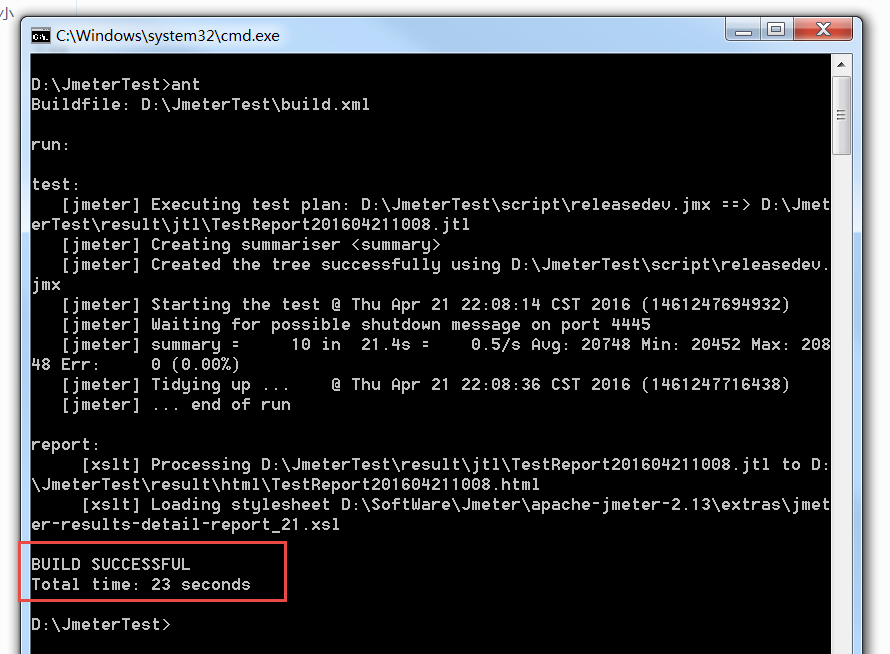
5, Result view
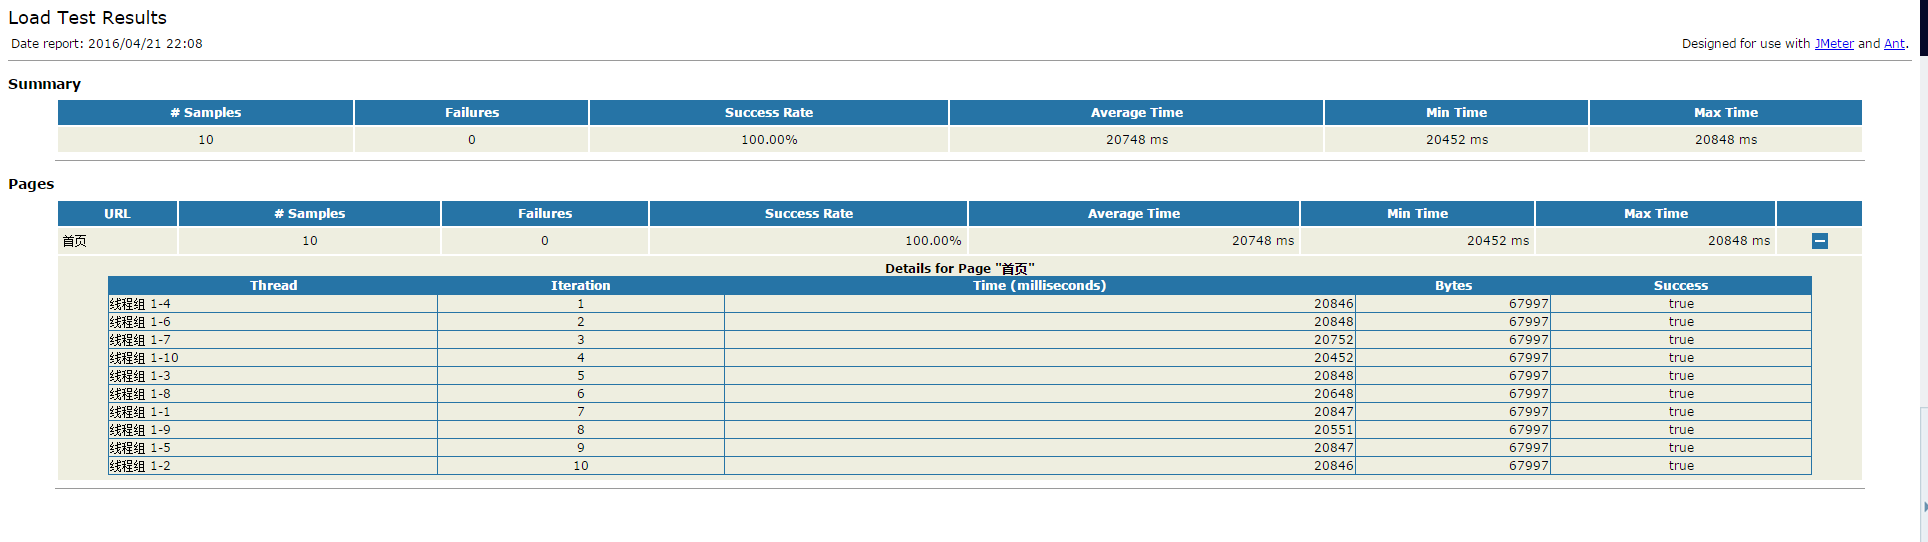
6, html report extension of Jmeter
Caption: when using loadrunner, you can generate an HTML report, which contains various charts and detailed data. After using Jmeter to test, the HTML report cannot be generated directly (whether it is started with GUI or command line).
After searching the data, it is found that there is an xsl style sheet for generating HTML under the extras directory of Jmeter. In fact Jenkins +The HTML report generated by ant+Jmeter is also generated by calling the style sheet here, so
Through xsltproc report jtl > test. HTML, or ant. This command converts the Jmeter result file into an HTML report. The results are as follows:
Although the HTML report can be generated here, the report is too weak to use and contains too few parameters. Therefore, this report needs to be extended. Because the aggregation report of Jmeter itself is relatively complete,
Therefore, we intend to expand according to the value of that report.
Introduction to xsltproc and xlst
XSL refers to the EXtensible Stylesheet Language. The stylesheet written in xls is used to convert XML into HTML. Therefore, if you want to extend this report, you must first update xls
You can change and expand style sheets only after you are familiar with them. Can be in http://www.w3school.com.cn/xsl/index.asp Learn this language here.
xsltproc is a fast XSLT engine, which can transform XML into corresponding format files through XSL cascading style sheets, such as HTML, XHTML and PDF
For example, to convert XML to HTML, the format is as follows:
xsltproc xsl-html.xsl hoto.xml -o html.html (here you can also directly write the style sheet file into the href attribute of the jtl file to intuitively tell the XML which style sheet to use)
xls to find the XPath used by XML, so you need to be familiar with XPath. The engine xsltproc uses xpath1 0 version, so you can't use xpath2 when using XPath in style sheets Function for 0
And some properties. I'm familiar with xpath, but I'm not familiar with xls at all. I can't learn xls and xpath directly in order to expand the report. (about xls, I will write a blog introduction again and summarize the problems and experiences in the process of use)
If ant and Jmeter are directly used, they can also be generated directly after integration, but the engine for ant to convert HTML only supports xpath1 0. Later, it was learned that most engines do not support xpath2 0, so XPath 2.0 cannot be used in the interim Function for 0.
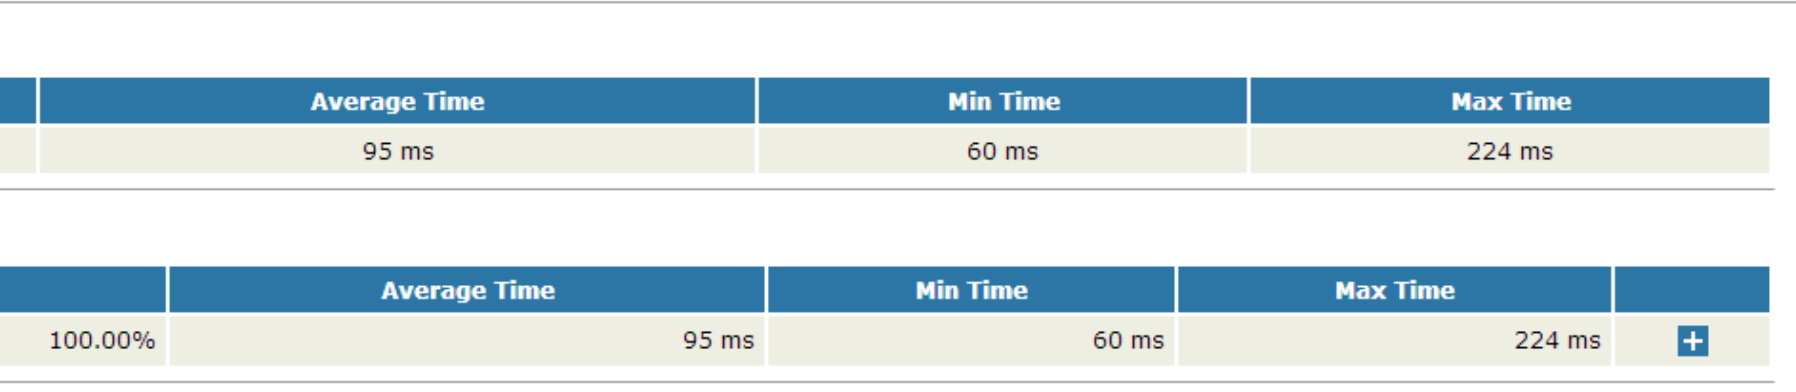
90%Line time
In order to display the time of 90%Line, we must first be familiar with this indicator. This indicator is worth a group of data, and the time of data at 90% position. Therefore, when we expand, we can obtain this value as long as we know the index at 90% position. Here are some key codes
<xsl:variable name="allMedianTime">
<xsl:call-template name="LineTime">
<xsl:with-param name="nodes" select="/testResults/*/@t" />
<xsl:with-param name="position" select="ceiling($allCount * 0.9)" />
</xsl:call-template>
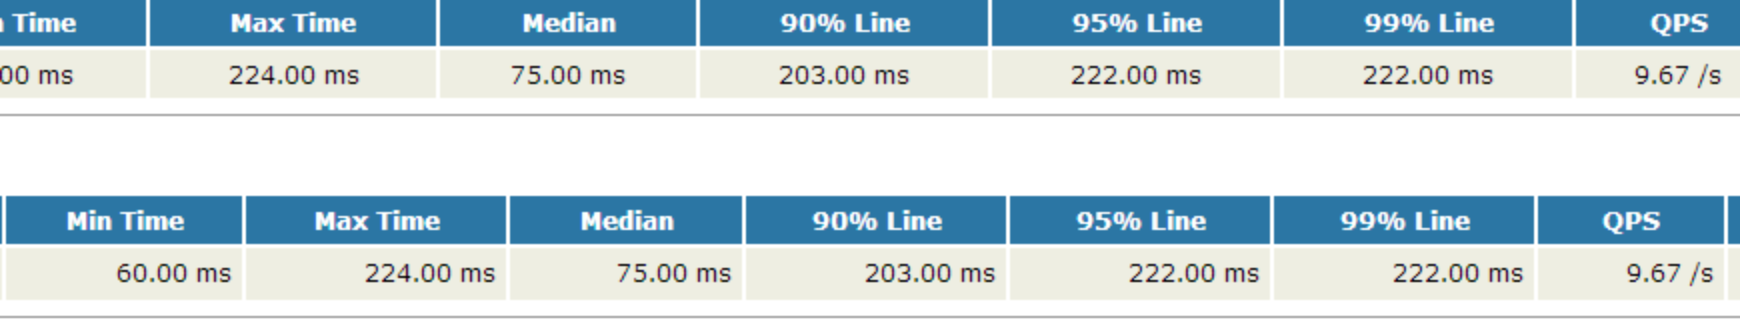
</xsl:variable>Here, we mainly obtain the set of time elements and the position of 90%line. With these two parameters, we can carry out subsequent expansion. The effect diagram after expansion is as follows:
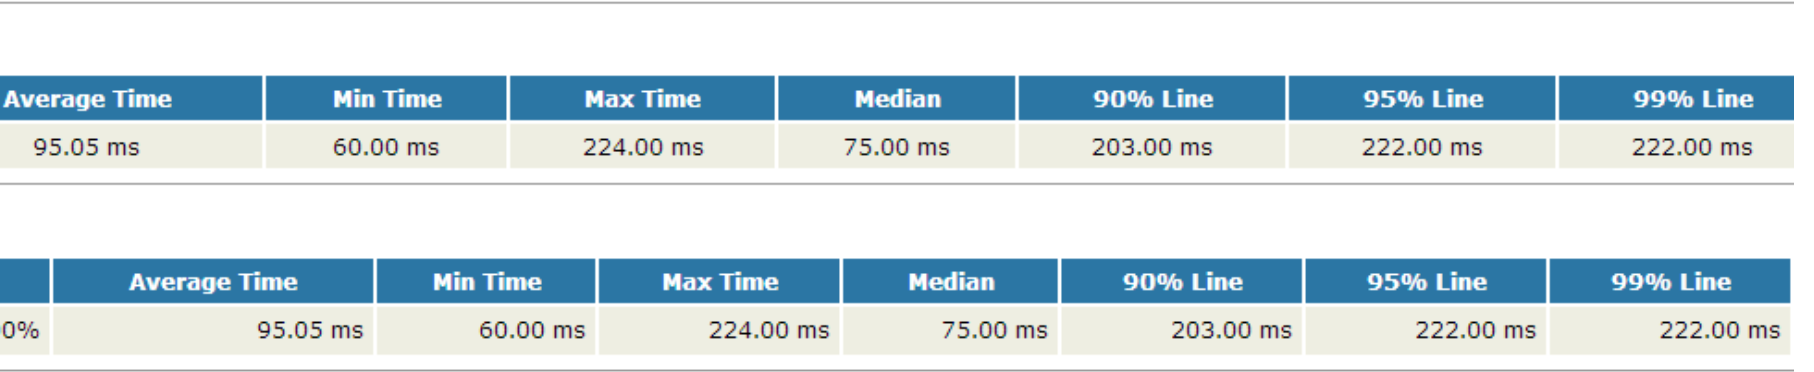
Because the calculation principles of 90%Line, 95% line and 99% line are the same, as long as one value is calculated, other values are also easy to calculate
QPS extension
The specific report of Jmeter has the value of Throughput, which is expressed as Throughput in loadrunner. Here it can represent QPS or TPS (when transactions are used). Individuals call this QPS because it is more intuitive.
For the same reason as% 90Line, you must first know how to calculate this value. After searching the data and comparing it with the official website, it is found that this value is calculated through the following formula:
Screenshot of official website:

Throughput = (number of requests) / (total time)
total time = test end time - test start time
Test end time = max (request start time + Elapsed Time) test start time = min (request start time)
If you know the formula, the calculation is easy. The following is the key code:
<xsl:variable name="nodeThroughput">
<xsl:call-template name="throughput">
<xsl:with-param name="nodes" select="/testResults/*/@ts" />
<xsl:with-param name="count" select="$allCount" />
</xsl:call-template>
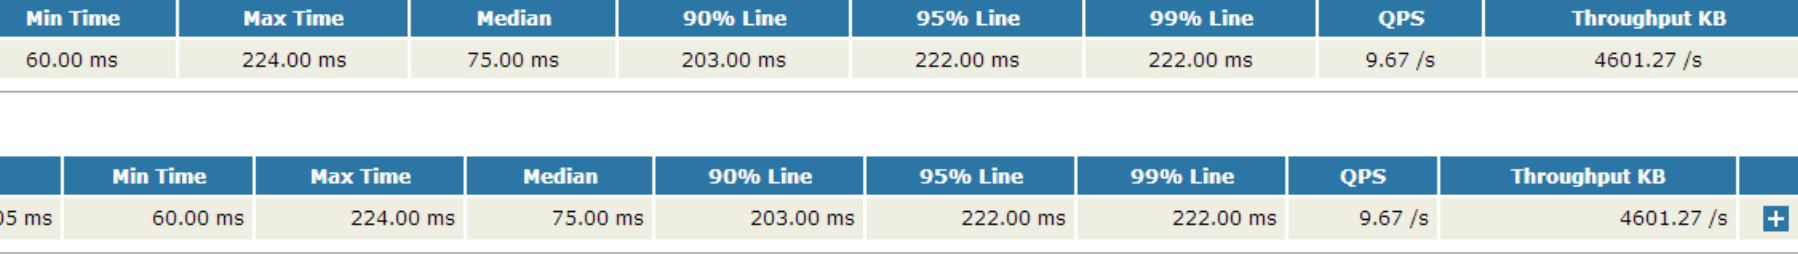
</xsl:variable>The expanded results are as follows:
Throughput expansion
In loadrunner, Throughput is Throughput. In Jmeter's aggregation report, the value in the last column is Throughput in loadrunner. In order to distinguish, I call the value here Throughput,
That is, throughput.
After searching the data, it is found that the calculation formula of throughput is the same as that of QPS, because it is the following formula:
Throughput = (total bytes requested) / (total time)
The total time calculation here is the same as QPS, and the total bytes can be directly added up to all requests. The key codes are as follows:
<xsl:variable name="nodeKB">
                <xsl:call-template name="throughput">
                    <xsl:with-param name="nodes" select="/testResults/*/@ts" />
                    <xsl:with-param name="count" select="sum(/testResults/*/@by) div 1024" />
                </xsl:call-template>
            </xsl:variable>
Because of the bytes displayed here, I intend to display the final result in KB, so I need to divide it by 1024. The expanded result is as follows
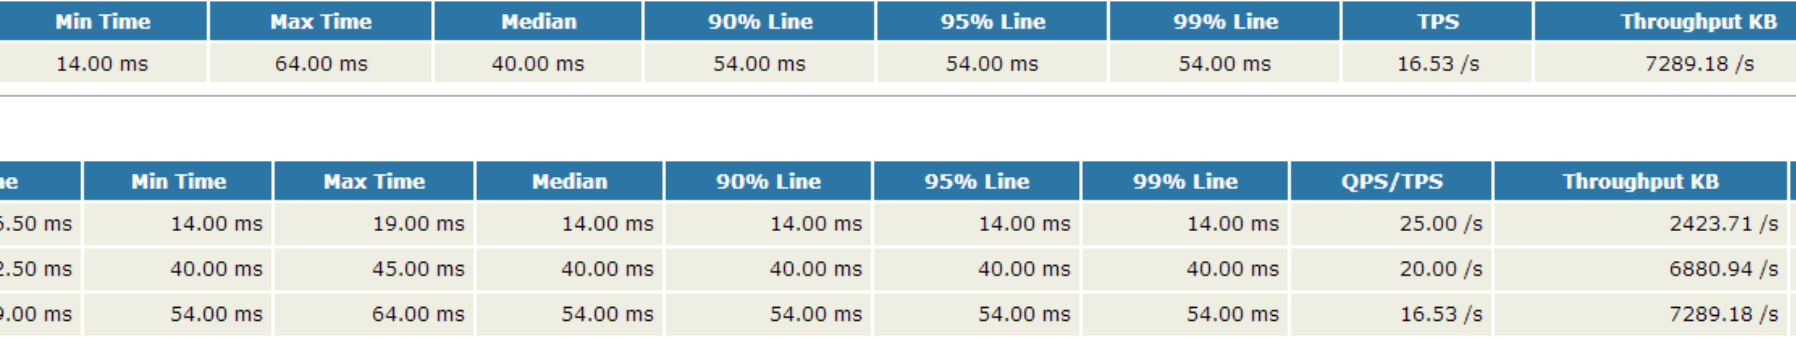
TPS extension
TPS in Jmeter is consistent with QPS in some cases, but there are still inconsistencies. Therefore, it also needs to be expanded here. This result looks clearer.
First, like other parameter extensions, you need to know the calculation formula. The calculation formula here is the same as QPS, but the data set is different. The following is the effect of the extension.
In the process of extension, it is further found that the calculated value of the last "overall" line in the aggregation result of Jmeter is inaccurate in some cases. If the script does not contain transactions, the result here is accurate. If all transactions are included and
When Generate parent sample is selected, the result here is also accurate. When there are transactions in the script and Generate parent sample is not selected, or there are some transactions and some are not, the result is not accurate because the calculation is viewed
I found that it counted all the requests.
For example, when a jtl request is sent, the total throughput of the request is not included in the HTTP request itself, so it is not included in the total request.
Therefore, the extension process is divided into two style sheets. One style sheet deals with the case that there are transactions or no transactions. At this time, the results are measured by QPS; When a style sheet deals with all transactions, the result is measured by TPS
It's accurate.
test
Several indicators have been expanded. How correct are these indicators? It needs to be tested in many cases, and all indicators are correct after testing. However, it has not been tested at the level of large amount of data. If any problems are found after the test, it will be tested in time
Change.
Remember: because the style sheet is distinguished by lb, the label here cannot be repeated, nor should it be repeated. The aggregation reports of Jmeter are distinguished by label
PS: one of the difficulties in the extension process is how to calculate the formula. The other is that xls is not very familiar with the extended style sheet language. It also has many limitations, which will be explained in the next blog. But it feels good after using it. I'm familiar with both xpath and xls.

Thanks to everyone who reads my article carefully. It's always necessary to have reciprocity when watching the rise and attention of fans all the way. If you can use the following materials, you can take them directly: Group No. 798478386 (note CSDN555)