Just last week, there was a hot search on the total GDP of all regions in China. I wanted to write a big data panel display for a while. Since I decided to write it, I should consider the use of charts and icons. Here I use the two frameworks I am most familiar with ECharts and element-ui
1, My idea steps
1. Determine the theme color
First we pass ECharts theme Customize to determine our overall chart color 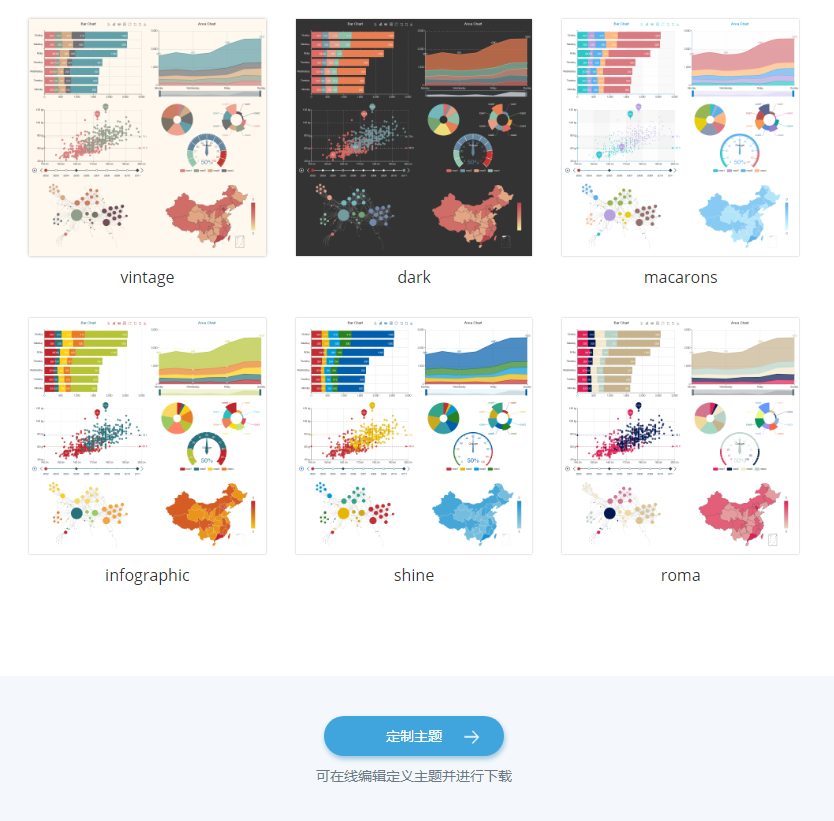
You can also customize it by yourself and replace the macarons in me JSON file is OK
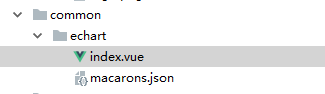
import macarons from './macarons.json' // Introduce default theme

    export default {
        data () {
            return {
                chart: null
            }
        },
        mounted () {
            this.$echarts.registerTheme('macarons', macarons); // Override default theme
            this.initChart();
        },
        methods: {
            initChart () {
                // Initialize echart
                this.chart = this.$echarts.init(this.$el, 'macarons')
                this.chart.setOption(this.options, true)
            }
        }
    }
2. Select the appropriate chart
I use it here Line chart,Histogram,Pie chart,Map,Scroll list , let's focus on maps and rolling list maps. We need to find json or js map data files in the region to import or use other map plug-ins (such as Baidu map), but I personally think this contour map should be better. 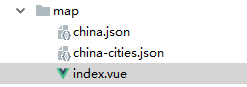
I downloaded a map of China's provinces and regions and a map of prefecture level cities from my file. You can get it yourself if you need it. I use the map of prefecture level cities
import chinaCityJson from './china-cities.json'
	export default {
		methods: {
            initChart() {
            	//... Key statement
                this.$echarts.registerMap("china", chinaCityJson);
            }
        }
	}
Scrolling lists I use vue-seamless-scroll , because I use a table of element UI here. In order to control the header from scrolling, I actually wrote two tables, one to hide the main content and the other to hide the header. If you don't want to use this plug-in, please refer to my previous articles Vue enables simple list infinite loop scrolling (mouse over) Modify a suitable rolling list Vue seamless scroll component reference code:
import vueSeamlessScroll from 'vue-seamless-scroll'
export default {
    data() {},
    components: {    //assembly
        vueSeamlessScroll
    },
    computed: {
     optionSingleHeight() {
       return {
        step: 0.2, // The higher the value, the faster the scrolling speed
        limitMoveNum: 2, // The amount of data that starts to scroll seamlessly this List. length
        hoverStop: true, // Turn on mouse over stop
        direction: 1, // 0 down 1 up 2 left 3 right
        openWatch: true, // Enable data real-time monitoring and refresh dom
        singleHeight: 0, // Stop height of single step motion (the default value is 0, which is seamless rolling without stopping) direction = > 0 / 1
        singleWidth: 0, // Width of single step motion stop (the default value is 0, which is seamless rolling without stop) direction = > 2 / 3
        waitTime: 1000 // Stop time of single step motion (default value: 1000ms)
      }
    }
  },
}
3. Style beautification
We can insert some pictures and make some dynamic borders and transparent backgrounds to beautify the interface. Here, I only use two background images for beautification, that is, the background image of large screen and the background image of first tier cities. Considering that the background image will not be found when packaged in the server, we write the style in data
export default {
     data() {
         return {
             note: {
                 backgroundImage: "url(" + require("../assets/img/bg.jpg") + ")",
                 backgroundSize: "100% 100%",
             },
             box: {
                 margin:"10px 10px 10px 10px",
                 height: "2rem",
                 border: "0.25rem solid transparent",
                 borderImage: "url("+require("../assets/img/border.png")+") 51 32 18 66",
             },
         };
     },
}
4. Large screen ratio and anti shake
The pixel I use is rem, which is a pixel unit of CSS3. It mainly changes relative to the HTML root element, while px changes relative to the screen width. Here, it can be changed according to your own needs. The width is a response made by using the Layout layout of element UI. Here, my most suitable screen size is 1920 * 944, but this is the width and height of the browser, which is not suitable for large screen display, So I wrote another full screen js. Of course, if necessary, I need to adjust the Layout height, otherwise the white edge will appear because the content is not filled
export default {
    data() {
        return {
            fullscreen: false,
        };
    },
    methods:{
        // Full screen event
        handleFullScreen() {
            let element = document.documentElement;
            if (this.fullscreen) {
                if (document.exitFullscreen) {
                    document.exitFullscreen();
                } else if (document.webkitCancelFullScreen) {
                    document.webkitCancelFullScreen();
                } else if (document.mozCancelFullScreen) {
                    document.mozCancelFullScreen();
                } else if (document.msExitFullscreen) {
                    document.msExitFullscreen();
                }
            } else {
                if (element.requestFullscreen) {
                    element.requestFullscreen();
                } else if (element.webkitRequestFullScreen) {
                    element.webkitRequestFullScreen();
                } else if (element.mozRequestFullScreen) {
                    element.mozRequestFullScreen();
                } else if (element.msRequestFullscreen) {
                    // IE11
                    element.msRequestFullscreen();
                }
            }
            this.fullscreen = !this.fullscreen;
        },
    },
}
The full screen is mainly used for large screen display in the exhibition hall and the company
The anti shake function uses the time difference to destroy the reconstructed chart to prevent the jitter caused by too fast change
/**
 * @param {Function} fn Anti shake function
 * @param {Number} delay delay time
 */
export function debounce(fn, delay) {
  var timer;
  return function () {
    var context = this;
    var args = arguments;
    clearTimeout(timer);
    timer = setTimeout(function () {
      fn.apply(context, args);
    }, delay);
  };
}
5. Dynamic data
Because I only use one year's data here, there is no dynamic effect. If there are data of multiple years, it can be done in different regions Urban climbing and dynamic data , so we just randomly display the data content on the map
export default {
    methods:{
        // Start timer
        startInterval() {
            if (this.intervalId !== null) {
                clearInterval(this.intervalId);
            }
            this.intervalId = setInterval(() => {
                this.reSelectMapRandomArea();
            }, 2000);
        },
        // Re randomly select the map area
        reSelectMapRandomArea() {
            this.$nextTick(() => {
                let index = Math.floor(Math.random() * this.data.length);
                this.chart.dispatchAction({
                    type: 'showTip',
                    seriesIndex: 0,
                    dataIndex: index,
                });
                this.chart.dispatchAction({
                    type: 'select',
                    seriesIndex: 0,
                    dataIndex: index,
                });
            });
        },
        handleMapRandomSelect() {
            this.$nextTick(() => {
                setTimeout(() => {
                    this.reSelectMapRandomArea();
                }, 0);
                // Move into the area, clear the timer, cancel the previous check and select the current one
                this.chart.on('mouseover', (params)=> {
                    clearInterval(this.intervalId);
                });
                // Move out of the area, re select the map area randomly, and start the timer
                this.chart.on('globalout', ()=> {
                    this.reSelectMapRandomArea();
                    this.startInterval();
                });
                this.startInterval();
            });
        },
    },
}
2, Final effect display
Demo address: http://zspt_sf.gitee.io/data-visualization-view design sketch: 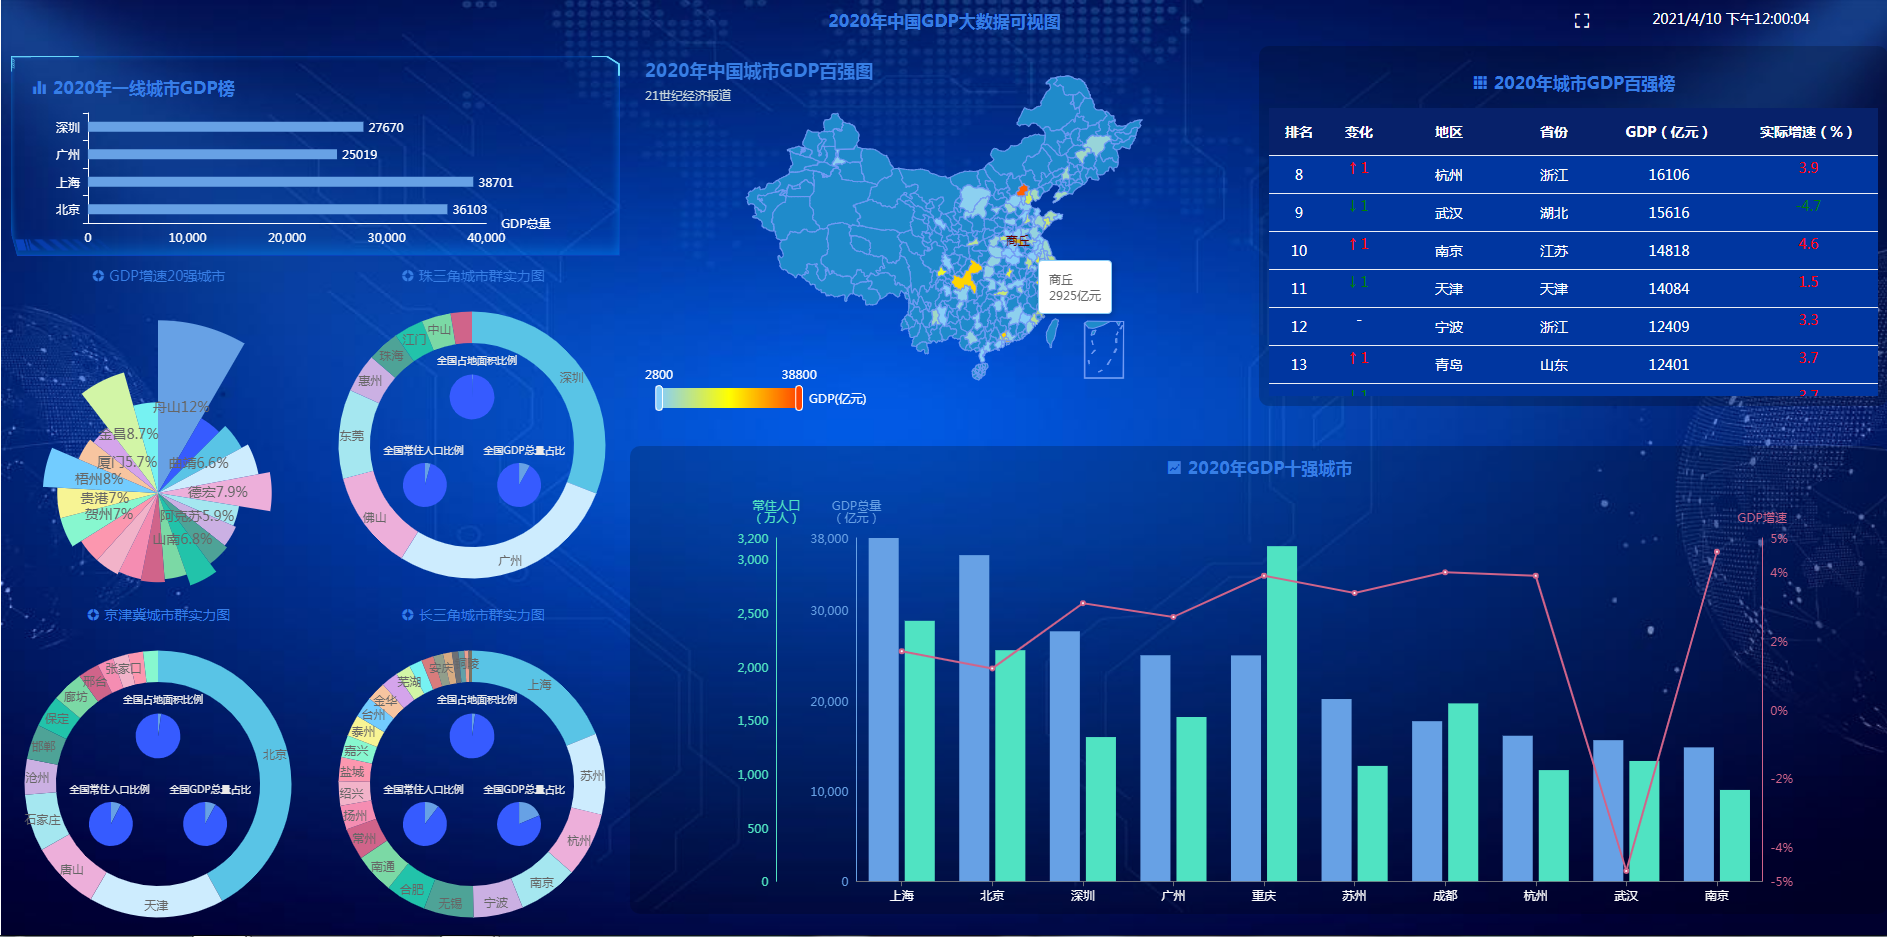 Dynamic rendering:
3, Source address
github address: https://github.com/zsptsf/data-visualization
gitee address: https://gitee.com/zspt_sf/data-visualization