1, Performance optimization analysis
The execution of a computing task mainly depends on CPU, memory and bandwidth.
Spark is a memory based computing engine, so for it, the biggest impact may be memory. Generally, our tasks encounter performance bottlenecks, and most of them are memory problems. Of course, CPU and bandwidth may also affect the performance of programs. This situation is not absent, but it is relatively rare.
Spark performance optimization is mainly about optimizing the use of memory. Usually, if the amount of data calculated by your spark program is relatively small and your memory is enough, there will generally be no major performance problems as long as the network does not get stuck.
However, the performance problems of Spark programs often occur in the calculation of large amounts of data (such as hundreds of millions of data or T-scale data). At this time, if the memory allocation is unreasonable, it will be relatively slow. Therefore, Spark performance optimization is mainly to optimize the memory.
2, Where's the memory
1. Each Java object has an object header, which takes up 16 bytes, mainly including the meta information of some objects, such as the pointer to its class. If an object itself is small, such as including an int type field, its object header is actually larger than the object itself.
2. The object header of Java's String object will be 40 bytes more than its internal original data. Because it uses char array to save the internal character sequence, and also saves information such as the length of the array.
3. Collection types in Java, such as HashMap and LinkedList, internally use the linked list data structure, so each data in the linked list is wrapped with an Entry object. The Entry object not only has an object header, but also a pointer to the next Entry, which usually takes up 8 bytes.
The data in the original file will occupy more memory than the data in the original file
How do I estimate how much memory the program will consume?
Through the cache method, you can see how much memory is used after the data in RDD is cached in memory
The code is as follows: this test code only writes a scala version
package com.imooc.scala

import org.apache.spark.{SparkConf, SparkContext}

/**
 * Requirements: test memory usage
 *
 */
object TestMemoryScala {

  def main(args: Array[String]): Unit = {
    val conf = new SparkConf()
    conf.setAppName("TestMemoryScala")
      .setMaster("local")
    val sc = new SparkContext(conf)

    val dataRDD = sc.textFile("hdfs://bigdata01:9000/hello_10000000.dat").cache()

    val count = dataRDD.count()
    println(count)
    //The while loop is to ensure that the program does not end and facilitate the local viewing of the storage information in the 4040 page
    while(true){
      ;
    }
  }

}
Execute the code and access the 4040 port interface of localhost
This interface is actually the task interface of spark. If you run a task locally, you can directly access the 4040 interface to view it
Click stages to see how big the original input data of the task is

Click storage to see the size after loading data into memory and generating RDD

In this way, we can know how much memory this data will occupy in RDD. In this way, when using it, if you want to load all the data into memory, you need to allocate so much memory to this task. Of course, you can allocate less, but the calculation efficiency will be lower, because some data memory in RDD will be put on disk if it can't be put into memory.
3, Performance optimization scheme
Next, we use these methods to optimize the performance of Spark Program
High performance serialization class library
 Persistence or persistence checkpoint
JVM Garbage collection tuning
 Improve parallelism
 Data localization
 Operator optimization
1. High performance serialization class library
Serialization plays an important role in any distributed system.
If the serialization technology used is slow in performing serialization operations, or the serialized data is still large, the performance of distributed applications will be greatly reduced. Therefore, the first step of Spark performance optimization is to optimize the performance of serialization.
Spark will serialize data in some places by default. If our operator function uses external data (such as custom types in Java), it also needs to be serializable. Otherwise, the program will report an error when executing and prompt that sequencing is not realized. We must pay attention to this.
(1) Cause
Because the initialization of Spark is carried out in the Driver process, but the actual execution is carried out in the Executor process of the Worker node; When the Executor side needs to use the object encapsulated by the Driver side, the Driver side object needs to be transmitted to the Executor side through serialization, and this object needs to be serialized.
Otherwise, an error will be reported, indicating that the object does not realize serialization
Note that there are two solutions to this kind of object that does not realize serialization
1. If this object can support serialization, implement the Serializable interface so that it supports serialization
2. If this object does not support serialization, for some objects such as database connections, this object does not support serialization, so you can put this code inside the operator, so it will not be passed through the driver end, but will be executed directly in the executor.
Spark makes a trade-off between the convenience and performance of serialization. By default, spark prefers the convenience of serialization and uses the serialization mechanism provided by Java itself - the serialization mechanism based on ObjectInputStream and ObjectOutputStream, because this method is provided by Java natively and is more convenient to use,
However, the performance of Java serialization mechanism is not high. The speed of serialization is relatively slow, and the data after serialization is relatively large and takes up more space. Therefore, if your Spark application is memory sensitive, the default Java serialization mechanism is not the best choice.
(2) Spark actually provides two serialization mechanisms
Java serialization mechanism and Kryo serialization mechanism
Spark only uses java serialization mechanism by default
1,Java Serialization mechanism: by default, Spark use Java Own ObjectInputStream and ObjectOutputStream Mechanism to serialize objects. As long as your class implements Serializable Interfaces can be serialized. Java The serialization mechanism is slow, and the serialized data occupies a large memory space, which is its disadvantage

2,Kryo Serialization mechanism: Spark It also supports the use of Kryo Serialization. Kryo Serialization mechanism ratio Java The serialization mechanism is faster, and the serialized data takes up less space, usually than Java Serialized data takes up about 10 times less space.
(3) The reason why Kryo serialization mechanism is not the default serialization mechanism
First point: because some types are implemented Seriralizable Interface, but it may not be able to be Kryo Serialization;
Second point: if you want to get the best performance, Kryo And ask you to Spark In the application, all types you need to serialize are registered manually, which is more troublesome
If you want to use Kryo serialization mechanism
First, use SparkConf to set Spark The value of serializer is org apache. spark.serializer. KryoSerializer is to set the serializer of Spark as KryoSerializer. In this way, when Spark serializes, Kryo will be used for serialization.
When using Kryo, you need to register the classes to be serialized in advance to get the best performance - if you don't register, Kryo can work normally, but Kryo must always save the full class name of the type, which takes up a lot of memory.
Spark registers commonly used types in Scala in Kryo by default. However, if an external custom type object is used in its own operator, it still needs to be registered.
Register custom data type format:
conf.registerKryoClasses(...)
Note: if there are too many custom types to serialize, you need to optimize Kryo itself, because the internal cache of Kryo may not be enough to store such a large class object
Need to call sparkconf Set () method, set spark kryoserializer. buffer. The value of the MB parameter. Increase it. The default value is 2. The unit is MB, which means that the object can be cached up to 2M and then serialized. You can turn it up if necessary.
(4) What scenarios are suitable for Kryo serialization?
It is generally for some custom objects. For example, we define an object ourselves, which contains tens of M or hundreds of M data, and then use the external large object inside the operator function
If Spark uses java serialization mechanism to serialize such external large objects by default, the serialization speed will be slow and the data after serialization will still be large.
Therefore, in this case, it is more suitable to use Kryo serialization class library to serialize external large objects, improve serialization speed and reduce memory space after serialization.
(5) scala code is as follows:
package com.imooc.scala

import com.esotericsoftware.kryo.Kryo
import org.apache.spark.serializer.KryoRegistrator
import org.apache.spark.storage.StorageLevel
import org.apache.spark.{SparkConf, SparkContext}

/**
 * Requirements: use of Kryo serialization
 *
 */
object KryoSerScala {

  def main(args: Array[String]): Unit = {
    val conf = new SparkConf()
    conf.setAppName("KryoSerScala")
      .setMaster("local")
      //Specify the use of kryo serialization mechanism. Note: if registerKryoClasses is used, this line of settings can be omitted
      .set("spark.serializer","org.apache.spark.serializer.KryoSerializer")
      .registerKryoClasses(Array(classOf[Person]))//Register custom data types
    val sc = new SparkContext(conf)

    val dataRDD = sc.parallelize(Array("hello you","hello me"))
    val wordsRDD = dataRDD.flatMap(_.split(" "))
    val personRDD = wordsRDD.map(word=>Person(word,18)).persist(StorageLevel.MEMORY_ONLY_SER)
    personRDD.foreach(println(_))

      //The while loop is to ensure that the program does not end and facilitate the local viewing of the storage information in the 4040 page
    while (true) {
      ;
    }
  }

}
case class Person(name: String,age: Int) extends Serializable
Execute the task, and then access the 4040 interface of localhost
In the interface, you can see that the data size of the cache is 31 bytes.

Let's get rid of the default serialization setting of java, and see the effect of kryo
Modify the code and comment out these two lines of code.
//.set("spark.serializer","org.apache.spark.serializer.KryoSerializer")
//.registerKryoClasses(Array(classOf[Person]))
Run the task, and then visit the 4040 interface
It is found that the memory space occupied at this time is 138 bytes, which is nearly 5 times more than that of kryo.
Therefore, it can be seen from this that using kryo serialization will greatly reduce the memory consumption.

Note: if we just spark The serialization mechanism of is changed to kryo Serialization, but the user-defined types used are not registered manually, so the memory consumption will be between the first two cases.
Modify the code and only comment out the line of registerKryoClasses
.set("spark.serializer","org.apache.spark.serializer.KryoSerializer")
//. registerKryoClasses(Array(classOf[Person]) / / register custom data types
Run the task, and then visit the 4040 interface
It is found that the memory occupation at this time is 123 bytes, between the previous 31 bytes and 138 bytes.
Therefore, it can be seen from this that when using kryo serialization, it is best to register the user-defined types manually. Otherwise, even if kryo serialization is enabled, the performance improvement is limited.

(6) The java code is as follows:
package com.imooc.java;

import com.esotericsoftware.kryo.Kryo;
import org.apache.spark.SparkConf;
import org.apache.spark.api.java.JavaRDD;
import org.apache.spark.api.java.JavaSparkContext;
import org.apache.spark.api.java.function.FlatMapFunction;
import org.apache.spark.api.java.function.Function;
import org.apache.spark.api.java.function.VoidFunction;
import org.apache.spark.serializer.KryoRegistrator;
import org.apache.spark.storage.StorageLevel;

import java.io.Serializable;
import java.util.Arrays;
import java.util.Iterator;

/**
 * Requirements: use of Kryo serialization
 *
 */
public class KryoSerjava {
    public static void main(String[] args) {
        //To create a SparkContext:
        SparkConf conf = new SparkConf();
        conf.setAppName("KryoSerjava")
                .setMaster("local")
                .set("spark.serializer", "org.apache.spark.serializer.KryoSerializer")
                .set("spark.kryo.classesToRegister", "com.imooc.java.Person");
        JavaSparkContext sc = new JavaSparkContext(conf);

        JavaRDD<String> dataRDD = sc.parallelize(Arrays.asList("hello you", "hello me"));
        JavaRDD<String> wordsRDD = dataRDD.flatMap(new FlatMapFunction<String, String>() {
            @Override
            public Iterator<String> call(String line) throws Exception {
                return Arrays.asList(line.split(" ")).iterator();
            }
        });
        JavaRDD<Person> personRDD = wordsRDD.map(new Function<String, Person>() {
            @Override
            public Person call(String word) throws Exception {
                return new Person(word, 18);
            }
        }).persist(StorageLevel.MEMORY_ONLY_SER());

        personRDD.foreach(new VoidFunction<Person>() {
            @Override
            public void call(Person person) throws Exception {
                System.out.println(person);
            }
        });

        while (true){
            ;
        }

    }
}
class Person implements Serializable{
    private String name;
    private int age;
    Person(String name,int age){
        this.name = name;
        this.age = age;
    }

    @Override
    public String toString() {
        return "Person{" +
                "name='" + name + '\'' +
                ", age=" + age +
                '}';
    }
}
2. Persistence or checkpoint
The persistence operation is carried out for the RDD that has been operated by transformation or action for many times in the program to avoid repeated calculation of an RDD, and then further optimized. The persistence level of Kryo serialization is used to reduce the memory occupation
In order to ensure high reliability of RDD persistent data in case of possible loss, you need to perform Checkpoint operation on RDD
We talked about these two operations before, so we won't demonstrate them here
3. JVM garbage collection tuning
Because Spark is a memory based computing engine, the data cached by RDD and the objects created during the execution of operators are placed in memory. Therefore, for Spark tasks, if the memory setting is unreasonable, most of the time will be consumed in garbage collection
For garbage collection, the most important thing is to adjust the memory space occupied by RDD cache and the proportion of memory space occupied by objects created during operator execution.
By default, Spark uses 60% of the memory space of each executor to cache RDD, so only 40% of the memory space is used to store the objects created during the execution of the operator
In this case, it may be due to insufficient memory space and the object created by the task task task corresponding to the operator is too large. Once 40% of the memory space is found to be insufficient, the garbage collection operation of the Java virtual machine will be triggered. Therefore, in extreme cases, garbage collection operations may be triggered frequently.
In this case, if garbage collection is found to occur frequently. Then you need to tune this ratio, spark storage. The value of the memoryfraction parameter is 0.6 by default.
Use sparkconf() Set ("spark.storage.memoryFraction", "0.5") can be modified to reduce the proportion of memory space occupied by RDD cache to 50%, so as to provide more memory space to save the objects created by task runtime.
Therefore, for RDD persistence, Kryo serialization can be used to reduce the memory consumption by reducing the proportion of executor memory. Provide more memory for tasks to avoid frequently triggering garbage collection during task execution.
We can monitor the garbage collection of tasks. In the task execution interface of spark, we can view the time consumed by each task and task gc.
Resubmit the checkpoint code to the cluster and view the task indicator information of the spark task
Ensure that the Hadoop cluster, the historian server process of yarn and the historian server process of spark are running normally
Delete the output directory of the checkpoint task
[root@bigdata04 sparkjars]# hdfs dfs -rm -r /out-chk001
Submit task
[root@bigdata04 sparkjars]# sh -x checkPointJob.sh
Click the first job generated, and then click in to view the stage of the job. Enter the first stage to check the execution of the task and see if the value of gc time is relatively large. The most intuitive thing is that if gc time is marked red here, it indicates that gc time is too long.
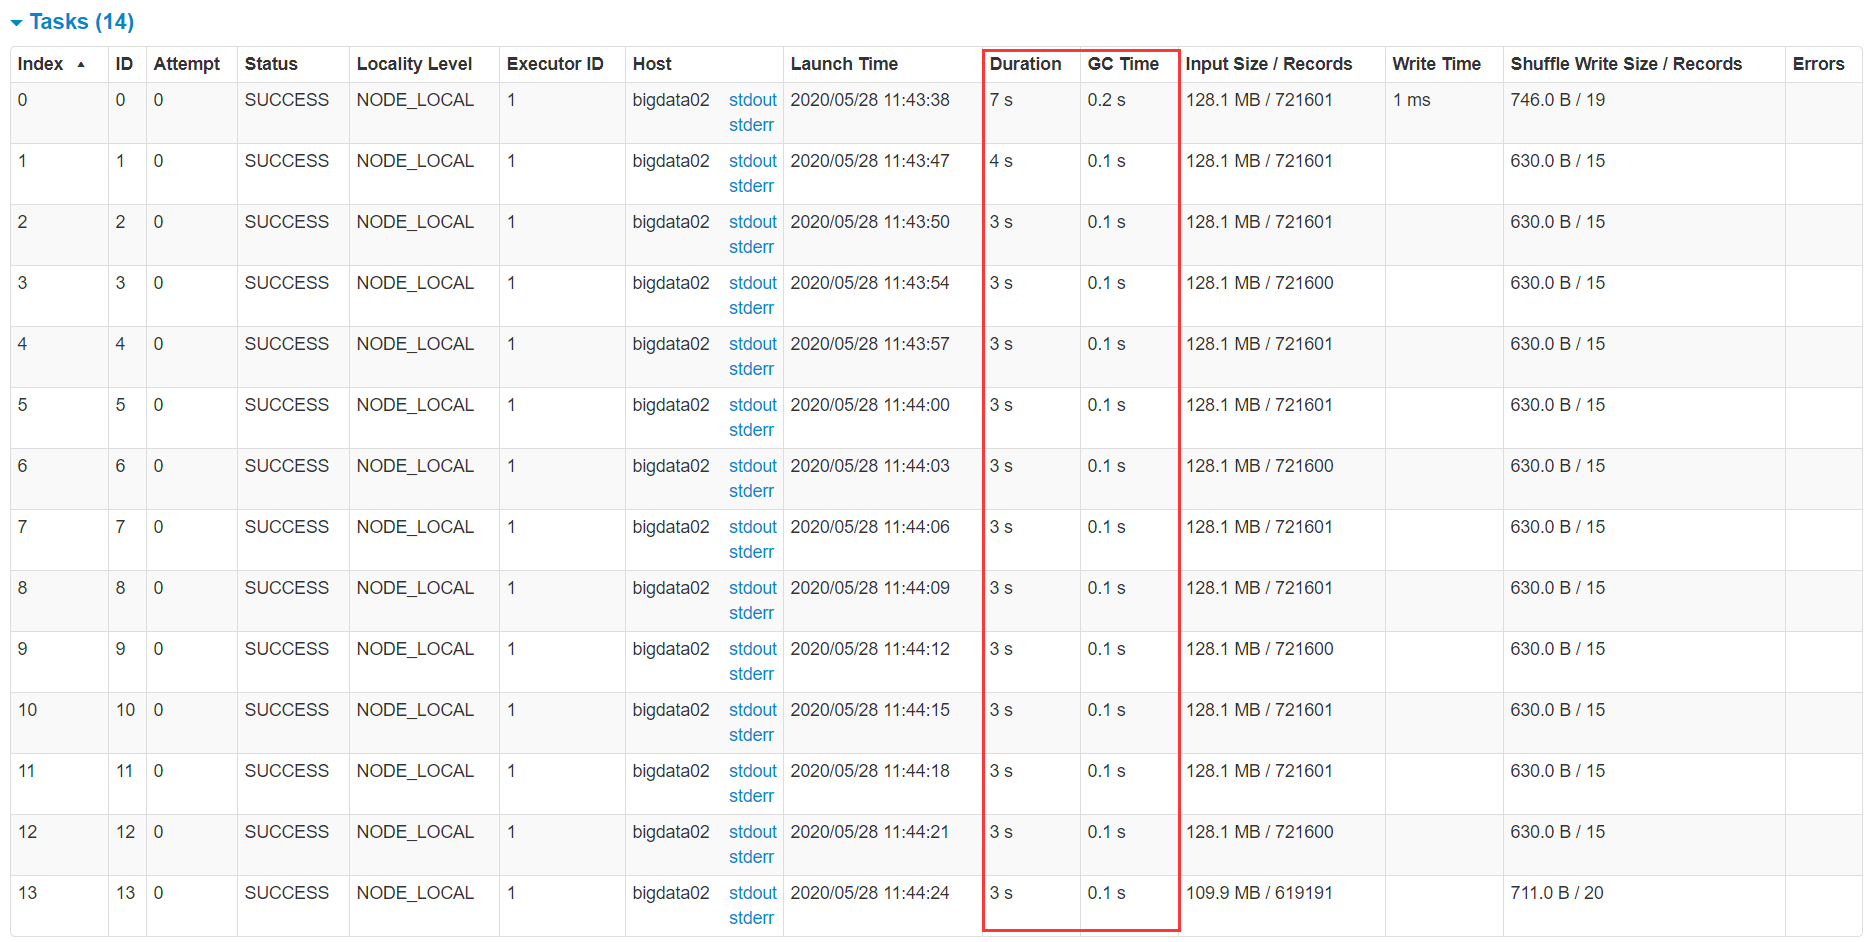
The above is a sub task view. In fact, you can also view the global view to see the total execution time and gc consumption time of the whole task in the Executor process.
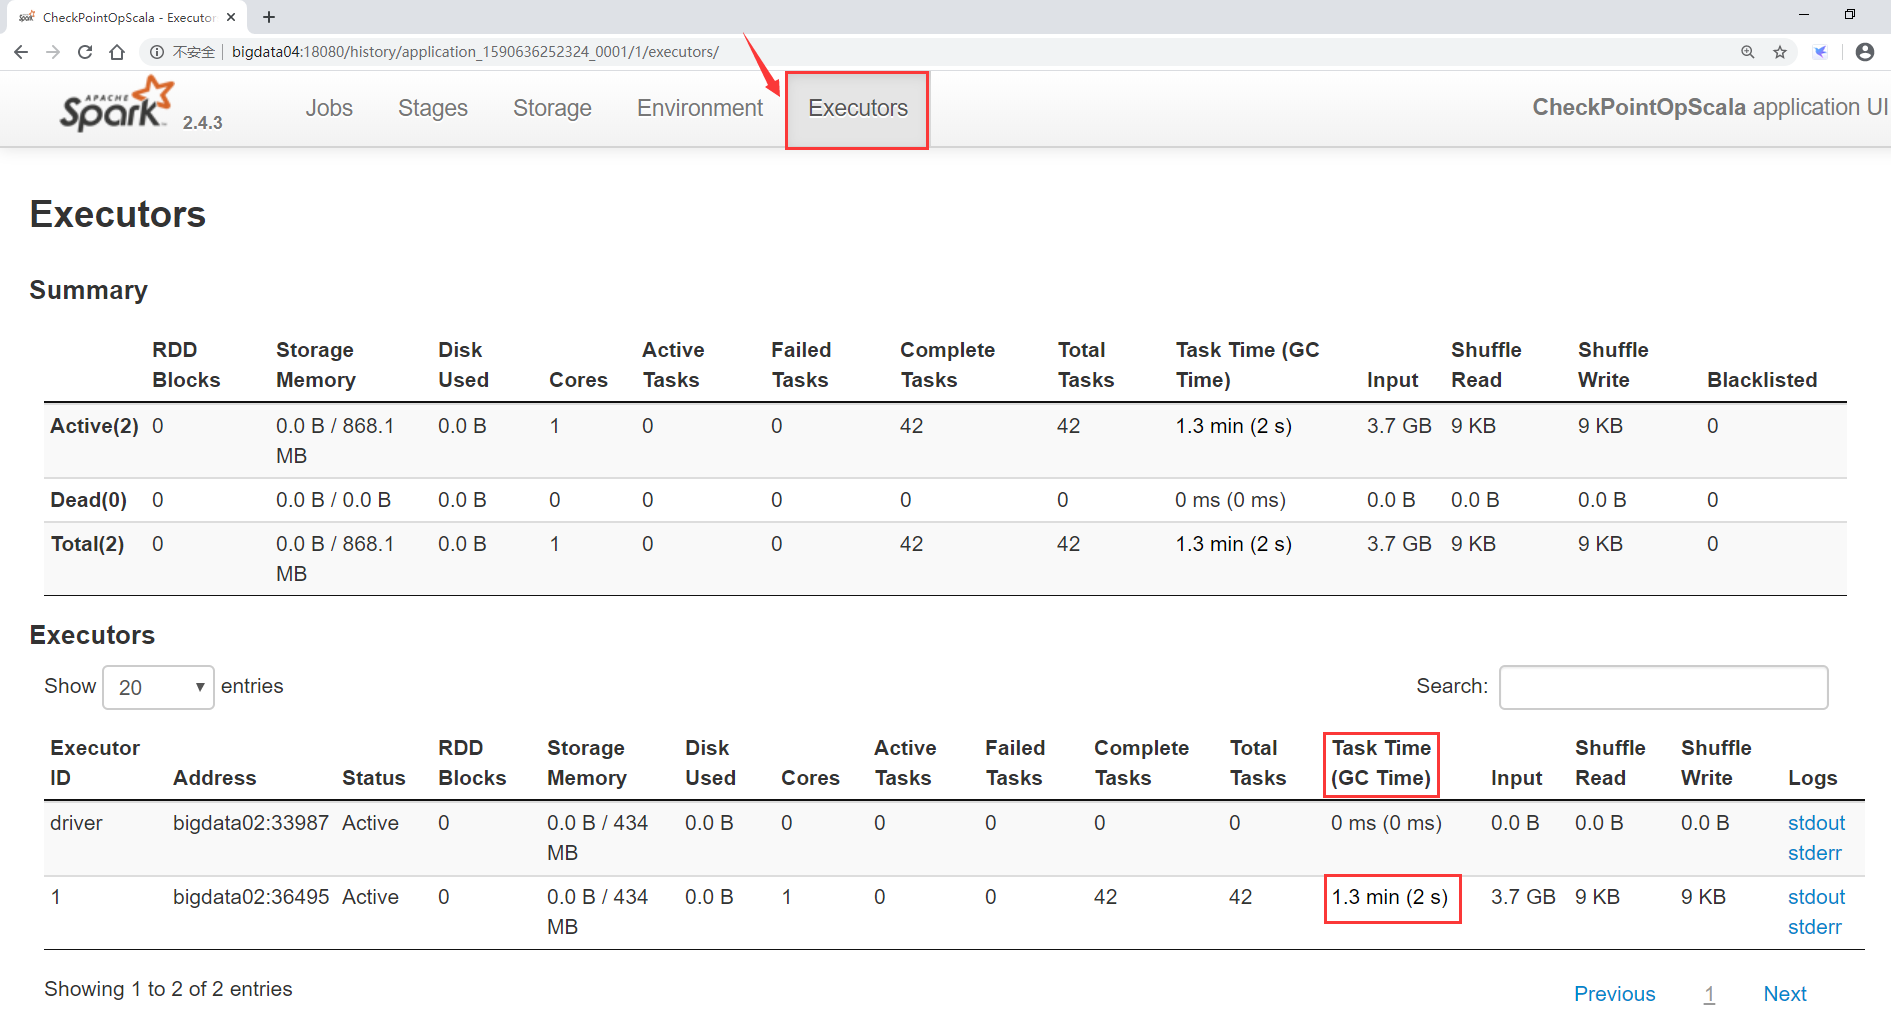
Now that we have talked about GC in Java, we need to talk about it.
The Java heap space is divided into two spaces: one is the young generation and the other is the old age.
The younger generation is the object of short-term survival
The elderly generation is the object of long-term survival.
The younger generation is divided into three spaces, Eden, Survivor1 and Survivor2
Take a look at this memory partition scale chart

The younger generation occupies 1% of heap memory/3,2% of heap memory in old age/3
Among them, the young generation is divided into three parts. The proportion of Eden, Survivor1 and Survivor2 is 8:1:1
Eden area and Survivor1 area are used to store objects, and Survivor2 area is used for standby.
The objects we create will first be placed in the Eden area. If the Eden area is full, a Minor GC will be triggered to recycle the garbage of the younger generation (in fact, the objects that are not used in the Eden area), then the surviving objects will be stored in the Survivor1 area, and then continue to be placed in the Eden area when creating objects. The second time the Eden area is full, the surviving objects in Eden and Survivor1 area will be moved to Survivor2 area together. Then the roles of Survivor1 and Survivor2 are changed, and Survivor1 becomes a standby.
When the Eden area is full again for the third time, the surviving objects in Eden and Survivor2 area will be moved to Survivor1 area together and cycle according to this law.
If an object in the younger generation has survived multiple garbage collection (the default is 15 times) and has not been recycled, it will be considered to have survived for a long time and will be transferred to the older generation. In addition, if the surviving objects in Eden and Survivor1 are found to be full when trying to put them into Survivor2, they will be directly put into the elderly generation. At this time, there is a problem that the objects that survive for a short time will also enter the old age.
If the space of the old age is full, the Full GC will be triggered to perform the garbage collection operation of the old age. If the memory space cannot be released by executing the Full GC, a memory overflow error will be reported.
Attention, Full GC Is a heavyweight garbage collection, Full GC When executing, the program is in a suspended state, which will greatly affect the performance.
In Spark, the goal of garbage collection tuning is that only objects that survive for a long time can enter the older generation, and objects that survive for a short time can only stay in the younger generation. A Survivor area cannot enter the old age because of insufficient space. As a result, the objects that survive for a short time occupy space in the elderly generation for a long time. In this way, a large number of objects that survive for a short time should be recovered during Full GC, resulting in the slow speed of Full GC.
If it is found that a large number of full GCS occur during task execution, it indicates that the young generation Eden area does not have enough space.
At this point, you can do something to optimize garbage collection behavior
1: The most direct is to increase the memory of the Executor
Specify the memory of the executor through parameters in spark submit
--executor-memory 1G
2: Adjust the ratio of Eden to s1 and s2 [generally, it is not recommended to adjust the ratio of this part]
-XX:NewRatio=4: Set younger generation(include Eden And two Survivor area)Ratio to older generation(Remove persistent generation).Set to 4,The ratio of young generation to old generation is 1:4,The younger generation accounts for 1% of the whole stack/5
-XX:SurvivorRatio=4: Set up young generation Eden District and Survivor Area size ratio.Set to 4,Then two Survivor Area and one Eden The ratio of area is 2:4,One Survivor The district accounts for 1% of the whole young generation/6
For specific use, you can set the – conf parameter in the spark submit script
--conf "spark.executor.extraJavaOptions= -XX:SurvivorRatio=4 -XX:NewRatio=4"
In fact, the most direct way is to increase the memory of the Executor. If this memory does not go up, other modifications are futile.
For example, a 20-year-old adult and a 3-year-old child
It's no use for a 3-year-old child to master more fighting skills. In front of absolute strength, everything is ostentatious.
Therefore, we rarely need to adjust the ratio of Eden, s1 and s2. Generally, it is more reliable to directly increase the memory of the Executor.
4. Improve parallelism
In fact, the resources of spark cluster may not be fully utilized, so we should try to set a reasonable degree of parallelism to make full use of the resources of the cluster, so as to improve the performance of Spark Program.
Spark will automatically set the parallelism of RDD with file as input source. According to its size, such as HDFS, it will create a partition for each block and set the parallelism according to this. For operators with shuffle operations such as reduceByKey, the parallelism of the parent RDD with the largest parallelism will be used
You can manually use the second parameter of textFile(), parallelize() and other methods to set the parallelism; You can also use spark default. Parallelism parameter to set the uniform parallelism. Spark's official recommendation is to set 2 ~ 3 task s for each cpu core in the cluster.
Let's take an example
In the spark submit script, I set five Executors for the task, and each executor sets two CPU cores
spark-submit \
--master yarn \
--deploy-mode cluster \
--executor-memory 1G \
--num-executors 5 \
--executor-cores 2 \
.....
At this point, if I set the default parallelism to 5 in the code
conf.set("spark.default.parallelism","5")
After this parameter is set, it means that the partitions of all RDDS are set to 5. For each partition of RDD, spark will start a task for calculation. Therefore, for all operator operations, only 5 tasks will be created to process the data in the corresponding RDD.
But notice, we're ahead spark-submit Five of the scripts were set executor,each executor 2 individual cpu core,So this time spark In fact, I will yarn 10 cluster applications cpu core,However, we set the default parallelism to 5 in the code, which will only produce 5 task,One task Use one cpu core,That means there are five cpu core It is idle, so half of the resources applied for are wasted.
In fact, the best situation is that each cpu core is not idle and is running all the time, which can achieve the maximum utilization of resources. In fact, it is a bit wasteful to let one cpu core run one task. The official also suggests that each cpu core run 2 ~ 3 tasks, which can fully squeeze the performance of the CPU
But why do you say that?
It's like this, because the execution sequence and execution end time of each task are very different. If there are exactly 10 CPUs running 10 tasks, a task may be completed soon, and the CPU will be idle, so resources will be wasted.
Therefore, according to the official recommendation, it is reasonable to allocate 2 ~ 3 task s to each CPU, which can make full use of CPU resources and give full play to its maximum value.
Let's actually write a case to see the effect
(1) Scala code is as follows:
package com.imooc.scala

import org.apache.spark.{SparkConf, SparkContext}

/**
 * Requirement: setting parallelism
 * 1: You can set the parallelism in the second parameter of methods such as textFile or parallelize
 * 2: Or through spark default. The parallelism parameter uniformly sets the parallelism
 *
 */
object MoreParallelismScala {

  def main(args: Array[String]): Unit = {
    val conf = new SparkConf()
    conf.setAppName("MoreParallelismScala")

    //Set global parallelism
    conf.set("spark.default.parallelism","5")

    val sc = new SparkContext(conf)

    val dataRDD = sc.parallelize(Array("hello","you","hello","me","hehe","hello","you","hello","me","hehe"))
    dataRDD.map((_,1))
      .reduceByKey(_ + _)
      .foreach(println(_))

    sc.stop()
  }

}
(2) The java code is as follows:
package com.imooc.java;

import org.apache.spark.SparkConf;
import org.apache.spark.api.java.JavaRDD;
import org.apache.spark.api.java.JavaSparkContext;
import org.apache.spark.api.java.function.Function2;
import org.apache.spark.api.java.function.PairFunction;
import org.apache.spark.api.java.function.VoidFunction;
import scala.Tuple2;

import java.util.Arrays;

/**
 * Requirement: setting parallelism
 *
 */
public class MoreParallelismJava {
    public static void main(String[] args) {
        SparkConf conf = new SparkConf();
        conf.setAppName("MoreParallelismJava");

        //Set global parallelism
        conf.set("spark.default.parallelism","5");
        JavaSparkContext sc = new JavaSparkContext(conf);

        JavaRDD<String> dataRDD = sc.parallelize(Arrays.asList("hello", "you", "hello", "me", "hehe", "hello", "you", "hello", "me", "hehe"));
        dataRDD.mapToPair(new PairFunction<String, String, Integer>() {
            @Override
            public Tuple2<String, Integer> call(String word) throws Exception {
                return new Tuple2<String, Integer>(word,1);
            }
        }).reduceByKey(new Function2<Integer, Integer, Integer>() {
            @Override
            public Integer call(Integer i1, Integer i2) throws Exception {
                return i1 + i2;
            }
        }).foreach(new VoidFunction<Tuple2<String, Integer>>() {
            @Override
            public void call(Tuple2<String, Integer> tup) throws Exception {
                System.out.println(tup);
            }
        });

        sc.stop();
    }
}
Compile and package code
The spark submit script is as follows:
[root@bigdata04 sparkjars]# vi moreParallelismJob.sh
spark-submit \
--class com.imooc.scala.MoreParallelismScala \
--master yarn \
--deploy-mode cluster \
--executor-memory 1G \
--num-executors 5 \
--executor-cores 2 \
db_spark-1.0-SNAPSHOT-jar-with-dependencies.jar
After the task is submitted to the cluster for operation, view the task interface of spark
Let's look at executors first. Here are five executor processes and one driver process
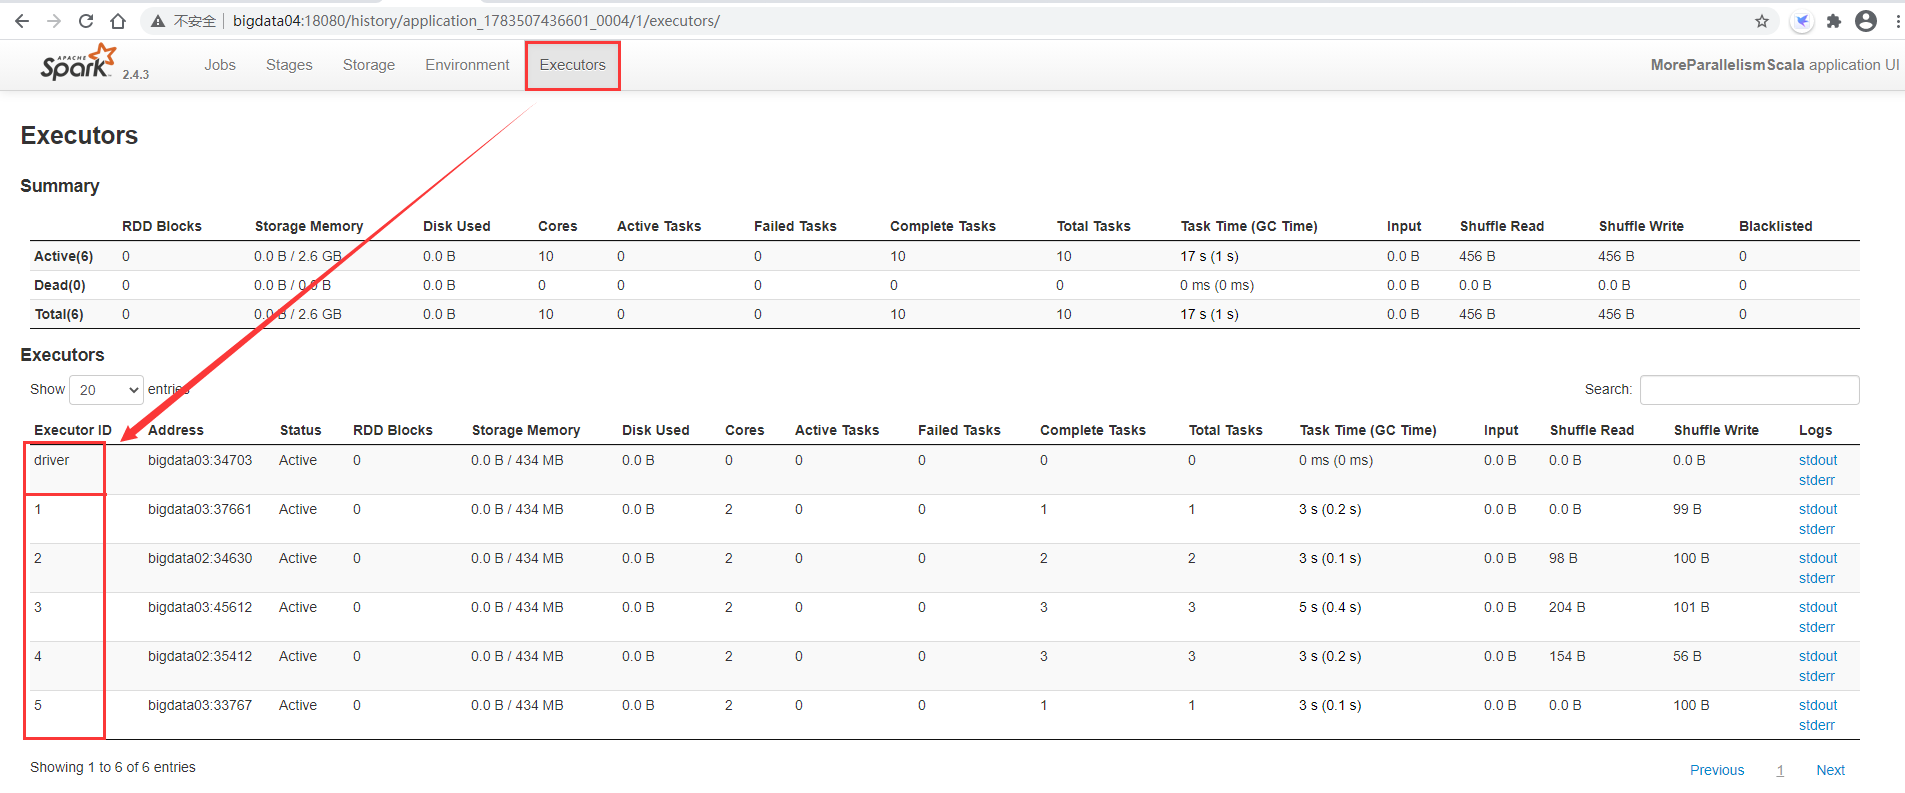
Then go to the satges interface. The two stages are executed in parallel with five tasks. These five tasks will use five CPUs, but we have applied for 10 CPUs for this task, so five are idle.

Click a Stage to view the detailed task information

You can see that there are really only five task s
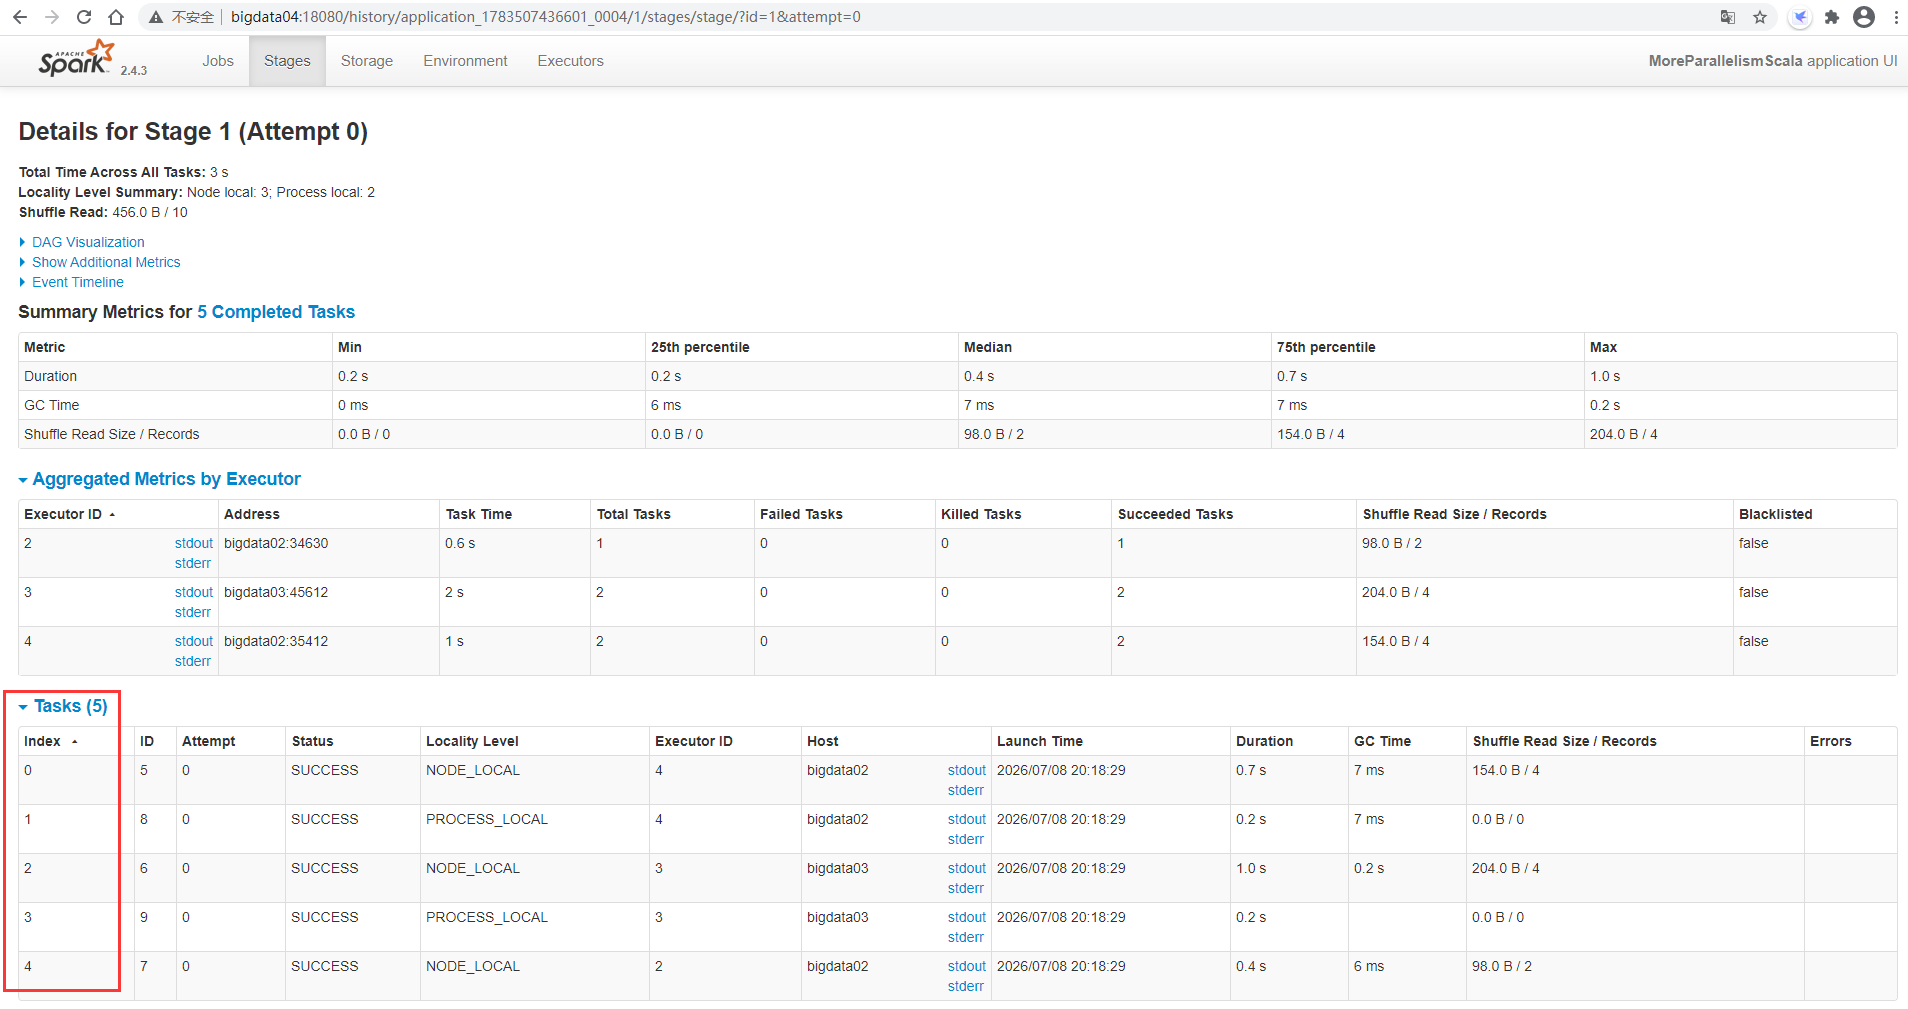
If you want to maximize CPU performance, at least use spark default. The value of parallelism is set to 10, which enables a CPU to run a task. In fact, the official recommendation is to set it to 20 or 30.
In fact, this parameter can also be set dynamically in the spark submit script through the – conf parameter, which is more flexible.
Note: at this time, you need to set spark. In the code default. Comment out the configuration of parallelism
//conf.set("spark.default.parallelism","5")
Encapsulate another script
[root@bigdata04 sparkjars]# vi moreParallelismJob2.sh
spark-submit \
--class com.imooc.scala.MoreParallelismScala \
--master yarn \
--deploy-mode client \
--executor-memory 1G \
--num-executors 5 \
--executor-cores 2 \
--conf "spark.default.parallelism=10" \
db_spark-1.0-SNAPSHOT-jar-with-dependencies.jar
Because the code has been modified, it needs to be recompiled, packaged and executed
After execution, check the task interface of spark. You can see that 10 tasks are executed in parallel

Then click the specific Stage to view the screenshot task information

After entering, you can see 10 task s
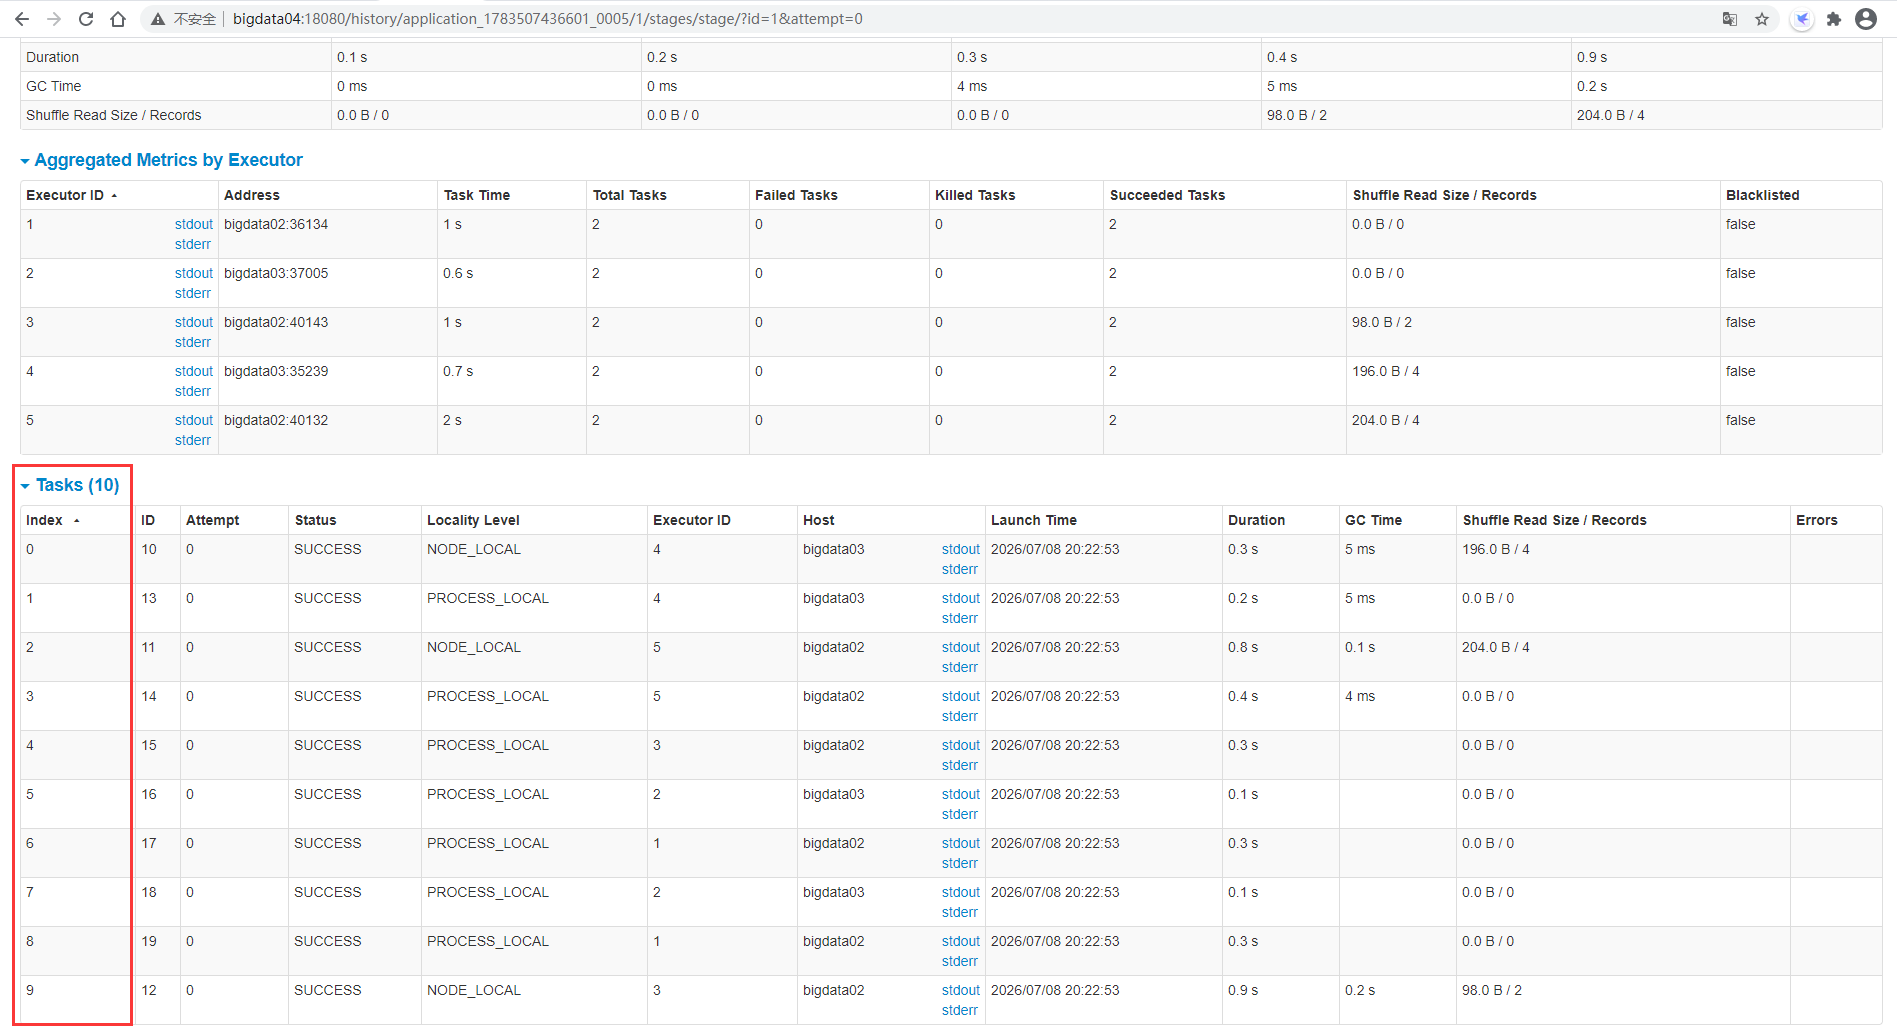
This is the setting related to parallelism
Next, let's take a look at a diagram to deepen our understanding
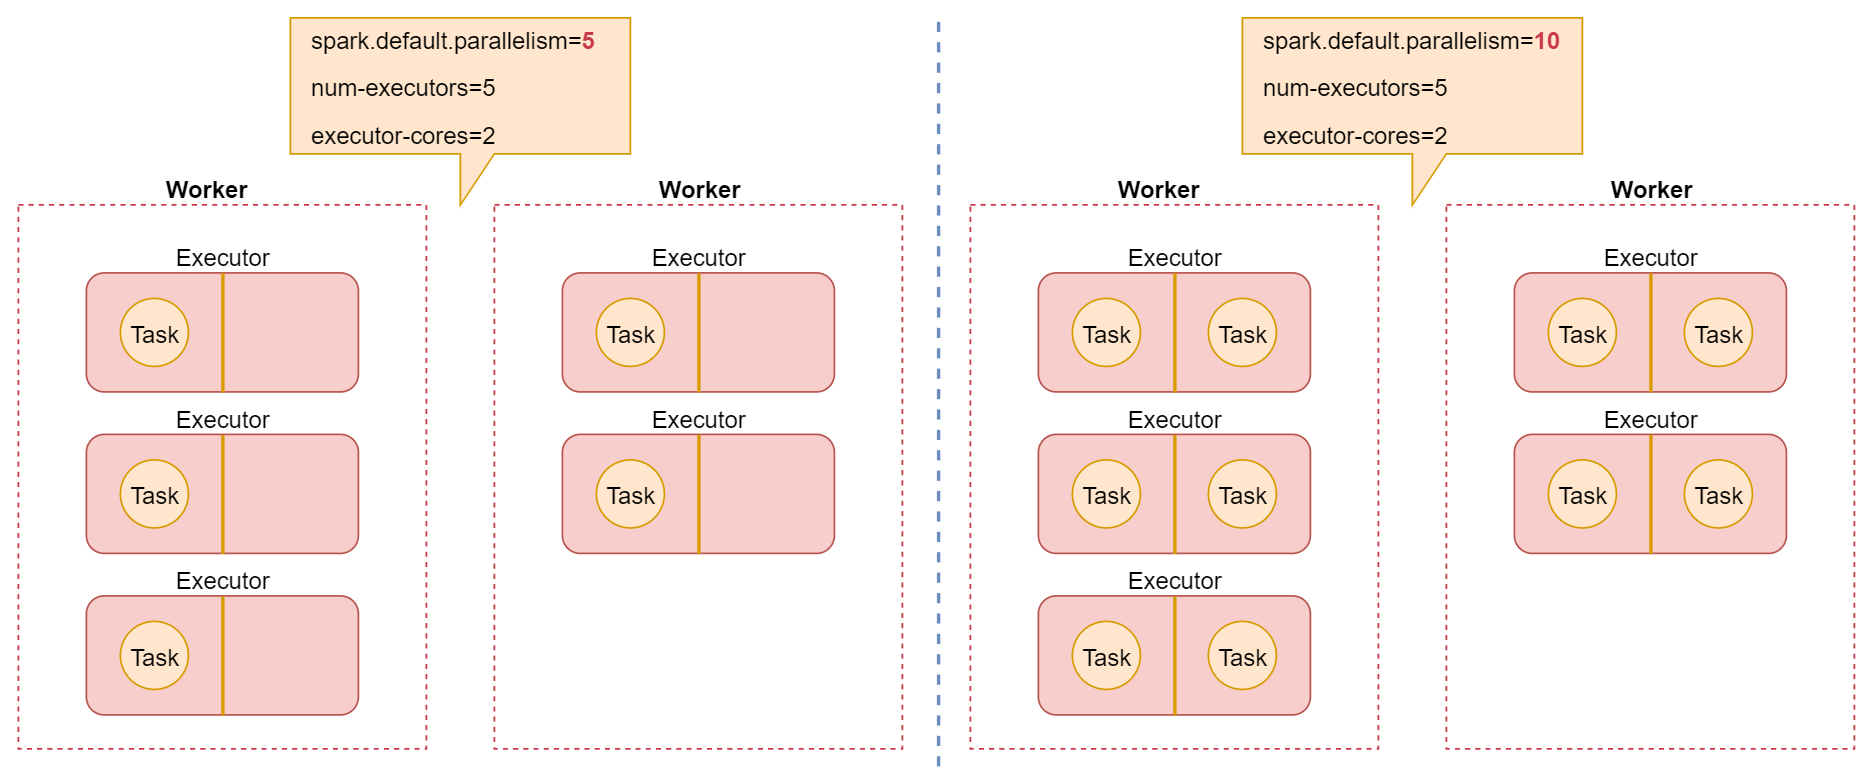
This figure describes the relationship between Executor and Task in the two cases we just demonstrated
Finally, let's analyze and summarize some parameters often configured in spark submit script
--name mySparkJobName: Specify task name
--class com.imooc.scala.xxxxx : Specify entry class
--master yarn : Specify the cluster address, on yarn Mode assignment yarn
--deploy-mode cluster : client representative yarn-client,cluster representative yarn-cluster
--executor-memory 1G : executor The memory size of the process, which is set to 2 in actual work~4G that will do
--num-executors 2 : How many are allocated executor process
--executor-cores 2 : One executor How many processes are allocated cpu core
--driver-cores 1 : driver How much is the process allocated cpu core,The default is 1
--driver-memory 1G: driver Process memory, if needed, similar to collect Something like that action Operator direction driver If the end pulls data, you can set it larger here
--jars fastjson.jar,abc.jar It can be set here job Dependent third party jar Package [it is not recommended to rely on a third party jar Package as a whole saprk of job In, that will lead to the task jar The package is too large, and it is not convenient to manage dependencies uniformly jar Package version, here jar Package path can specify local disk path or hdfs Path, recommended hdfs Path, because spark When submitting a task, the local disk dependency will be jar Packages are also uploaded to hdfs In a temporary directory, if it is specified here hdfs Path, then spark When submitting a task, you will not submit the dependent task repeatedly jar Package, which can actually improve the efficiency of task submission and facilitate the unified management of third-party dependencies jar Package, which is used by everyone hdfs Shared by these third parties in jar Package, so the version is unified, so we can hdfs Create one similar to commonLib A directory that uniformly stores third-party dependencies jar Package, if one Spark job Need to rely on multiple jar Packages. You can specify multiple packages at one time jar Packages can be separated by commas]
--conf "spark.default.parallelism=10": Some can be specified dynamically spark The parameter of the task. Multiple parameters can be specified through multiple parameters--conf To specify, or in a--conf Multiple parameters can be specified in the following double quotation marks, and multiple parameters can be separated by spaces
One last note: settings for – num executors and – executor cores
Let's see the difference between the two settings:
The first way:
--num-executors 2
--executor-cores 1
Second way:
--num-executors 1
--executor-cores 2
These two settings will eventually apply to the cluster for two CPU cores, which can run two task s in parallel, but what is the difference between the two settings?
The first method: multi executor mode
Since each executor is allocated only one cpu core, we will not be able to take advantage of running multiple tasks in the same JVM. Let's assume that the two executors are started in two nodes. For the operation of broadcast variables, one copy will be copied in the of both nodes, and finally two copies will be copied
The second method: multi-core mode
At this time, there will be two CPU cores in an executor, which can take advantage of the advantages of running multiple tasks in the same JVM. For this operation of broadcast variables, only one copy will be copied in the node corresponding to the executor.
Can I allocate a lot of CPU cores to an executor? No, because the memory size of an executor is fixed. If too many task s are run in it, it may lead to insufficient memory. Therefore, in general, we will allocate 24G memory to an executor and allocate 24 CPU cores accordingly.
5. Data localization
Data localization has a huge impact on Spark Job performance.
If the data and the code to calculate it are together, the performance will certainly be very high. However, if the data and the code that calculates it are separate, one of them must be on the other party's machine.
Generally speaking, moving code to other nodes is much faster than moving data to the node where the code is located, because the code is relatively small.
Spark also builds the task scheduling algorithm based on this principle of data localization.
Data localization refers to how close the data is to the code that calculates it. Based on the distance between data and code, there are several levels of data localization:
Data localization level			explain
PROCESS_LOCAL		Process localization has the best performance: the data and the code that calculates it are in the same place JVM In process
NODE_LOCAL			Node localization: the data and the code that calculates it are on the same node, but not on the same node JVM In the process, data needs to be transmitted across processes
NO_PREF				Where the data comes from, the performance is the same. For example, getting data from the database is very important for task There is no difference in terms of
RACK_LOCAL			The data and the code to calculate it are in a rack, and the data needs to be transmitted between nodes through the network
ANY					The data may be anywhere, such as in other network environments or on other racks, with the worst performance
Spark tends to schedule task s at the best localization level, but this is unrealistic.
If there is no idle CPU on the executor where the data we want to process currently, Spark will lower the localization level. There are two options:
First, wait until the cpu on the executor is released, and then allocate the task;
Second, immediately start a task on any other executor.
Spark will wait for the specified time by default. It expects the executor on the node where the data to be processed by the task is located to spare a cpu, so as to allocate the task in the past. As long as the time is exceeded, spark will allocate the task to any other idle executor
You can set parameters, Spark The locality series parameters are used to adjust the time when Spark waits for the task to localize the data
spark.locality.wait(3000 MS): default wait 3 seconds
spark.locality.wait.process: Wait for the specified time to see if the data can be reached and the code that calculates it is in the same place JVM In process
spark.locality.wait.node: Wait for the specified time to see if the data can be reached and the code to calculate it is executed on a node
spark.locality.wait.rack: Wait for the specified time to see if the data can be reached and calculate its code on a rack
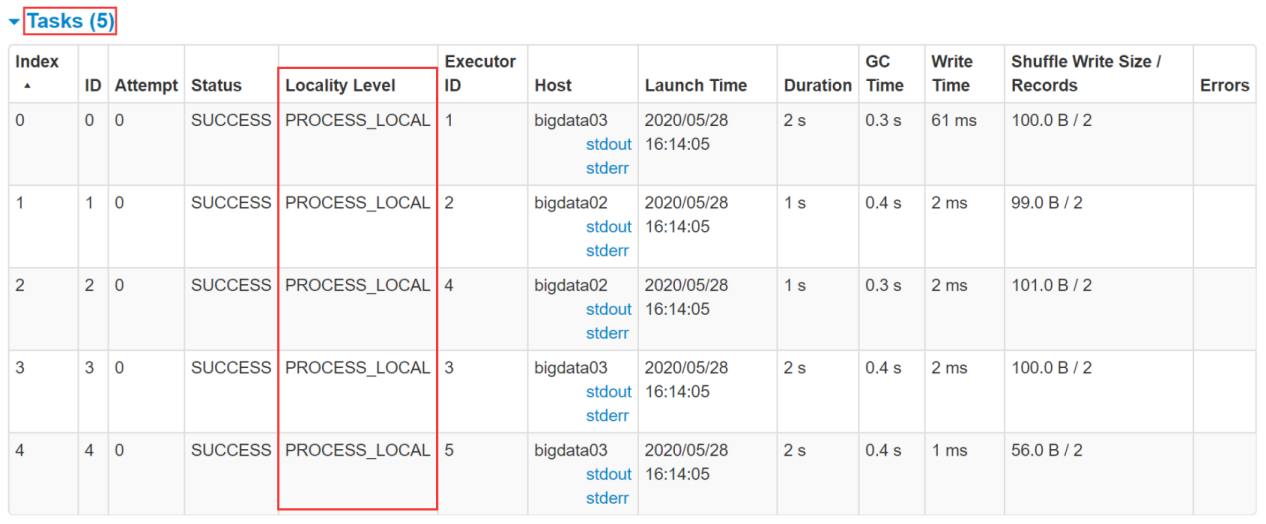
Look at the task in this figure. At this time, the data localization level is the best PROCESS_LOCAL
