If you use Python as the language for data processing, pandas is probably one of the most used libraries in your code. The key data structure of pandas is dataframe, which is a spreadsheet like data table composed of rows and columns. When dealing with dataframes, we often need to deal with indexes, which can be tricky. In this article, let's review some tips on using pandas to handle indexes.
Specifies the index column when reading
In many cases, our data source is a CSV file. Suppose we have a file named data CSV file, which has the following data.
date,temperature,humidity
07/01/21,95,50
07/02/21,94,55
07/03/21,94,56
By default, pandas will create a 0-based index for us, as shown below.
>>> pd.read_csv("data.csv", parse_dates=["date"])
        date  temperature  humidity
0 2021-07-01           95        50
1 2021-07-02           94        55
2 2021-07-03           94        56
We can use index during the import process_ Set the col parameter to the applicable column to specify the index column directly.
>>> pd.read_csv("data.csv", parse_dates=["date"], index_col="date")
            temperature  humidity
date
2021-07-01           95        50
2021-07-02           94        55
2021-07-03           94        56
Set index in DataFrame
After reading data or some other data processing steps, you may want to set the index manually. We can use set_index method.
>>> df = pd.read_csv("data.csv", parse_dates=["date"])
>>> df.set_index("date")
            temperature  humidity
date
2021-07-01           95        50
2021-07-02           94        55
2021-07-03           94        56
In this method, you specify which columns are the new indexes. Here are two things worth noting.
By default, this method creates a new DataFrame. If you want to change the position of the index, you run DF set_ index(“date”, inplace=True).
If you want the column to exist after you set the index, you can run DF set_ index(“date”, drop=False).
>>> df.set_index("date", drop=False)
                 date  temperature  humidity
date
2021-07-01 2021-07-01           95        50
2021-07-02 2021-07-02           94        55
2021-07-03 2021-07-03           94        56
Reset index after some operations
When processing DataFrame, some operations (such as deleting rows, index selection) will generate a subset of the original index. To rebuild a continuous index, you can use reset_index method.
>>> df0 = pd.DataFrame(np.random.rand(5, 3), columns=list("ABC"))
>>> df0
          A         B         C
0  0.548012  0.288583  0.734276
1  0.342895  0.207917  0.995485
2  0.378794  0.160913  0.971951
3  0.039738  0.008414  0.226510
4  0.581093  0.750331  0.133022
>>> df1 = df0[df0.index % 2 == 0]
>>> df1
          A         B         C
0  0.548012  0.288583  0.734276
2  0.378794  0.160913  0.971951
4  0.581093  0.750331  0.133022
>>> df1.reset_index(drop=True)
          A         B         C
0  0.548012  0.288583  0.734276
1  0.378794  0.160913  0.971951
2  0.581093  0.750331  0.133022
Usually, we don't need to keep the old index, so we want to set the drop parameter to True, which means that the operation will delete the old index. Similarly, if you want to reset the index, don't forget to set the inplace parameter to True, otherwise a new DataFrame will be created.
Converting an index from a group by operation to a column
Grouping is the most common method. Let's continue using df0 created in the previous step by adding grouping columns.
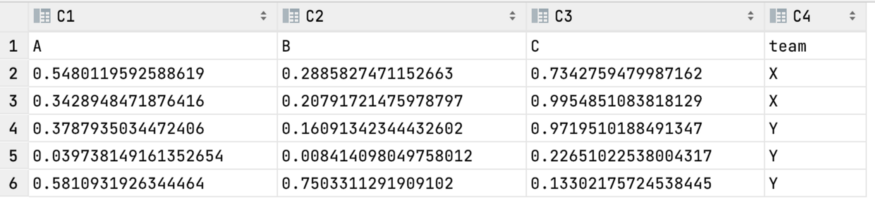
>>> df0["team"] = ["X", "X", "Y", "Y", "Y"]
>>> df0
          A         B         C team
0  0.548012  0.288583  0.734276    X
1  0.342895  0.207917  0.995485    X
2  0.378794  0.160913  0.971951    Y
3  0.039738  0.008414  0.226510    Y
4  0.581093  0.750331  0.133022    Y
>>> df0.groupby("team").mean()
             A         B         C
team
X     0.445453  0.248250  0.864881
Y     0.333208  0.306553  0.443828
Using grouping variables and columns as indexes, the DataFrame created after grouping operation is not the DataFrame you need. But you might want these indexes to be columns. There are two ways to do what you need, as shown below. Personally, I prefer the second method, which involves only two steps.
>>> df0.groupby("team").mean().reset_index()
  team         A         B         C
0    X  0.445453  0.248250  0.864881
1    Y  0.333208  0.306553  0.443828
>>> df0.groupby("team", as_index=False).mean()
  team         A         B         C
0    X  0.445453  0.248250  0.864881
1    Y  0.333208  0.306553  0.443828
Reset index after sorting
Sorting is a very common operation in data processing. When we sort rows, by default, these rows retain their respective indexes. However, this may not be the desired behavior. If you want to reset the index after sorting, just click Sort_ Set ignore in the values method_ The index parameter is OK.
>>> df0.sort_values("A")
          A         B         C team
3  0.039738  0.008414  0.226510    Y
1  0.342895  0.207917  0.995485    X
2  0.378794  0.160913  0.971951    Y
0  0.548012  0.288583  0.734276    X
4  0.581093  0.750331  0.133022    Y
>>> df0.sort_values("A", ignore_index=True)
          A         B         C team
0  0.039738  0.008414  0.226510    Y
1  0.342895  0.207917  0.995485    X
2  0.378794  0.160913  0.971951    Y
3  0.548012  0.288583  0.734276    X
4  0.581093  0.750331  0.133022    Y
Reset index after deleting duplicates
When we deal with real-life data sets, duplicate records often occur. Therefore, we need to delete these copies. After deletion, we also want the indexes to be arranged in the desired order. Using a similar approach, we can use drop_ Ignore in duplicates method_ Index parameter.
For simplicity, let's assume that each team has only one df0 record.
>>> df0
          A         B         C team
0  0.548012  0.288583  0.734276    X
1  0.342895  0.207917  0.995485    X
2  0.378794  0.160913  0.971951    Y
3  0.039738  0.008414  0.226510    Y
4  0.581093  0.750331  0.133022    Y
>>> df0.drop_duplicates("team", ignore_index=True)
          A         B         C team
0  0.548012  0.288583  0.734276    X
1  0.378794  0.160913  0.971951    Y
As shown above, after the duplicate items are deleted in the "team" column, only the first record of each team is saved in the generated DataFrame. It is important because we will ignore_index is set to True, so the new DataFrame uses a new set of indexes in a 0-based manner.
Direct assignment of index
When you have an existing DataFrame, you may need to allocate indexes using different data sources or from separate operations. In this case, you can assign the index directly to the existing DataFrame.
>>> better_index = ["X1", "X2", "Y1", "Y2", "Y3"]
>>> df0.index = better_index
>>> df0
           A         B         C team
X1  0.548012  0.288583  0.734276    X
X2  0.342895  0.207917  0.995485    X
Y1  0.378794  0.160913  0.971951    Y
Y2  0.039738  0.008414  0.226510    Y
Y3  0.581093  0.750331  0.133022    Y
Ignore indexes when writing CSV files
Not everyone uses Python or pandas, so we often need to export data to CSV files. In many cases, the DataFrame has a 0-based index. However, we do not want to include it in the exported CSV file. In this case, we can go to_ Set the index parameter in the CSV method.
>>> df0.to_csv("exported_file.csv", index=False)
The exported CSV file is shown below. The file does not contain index columns.
summary
In this article, we reviewed the most common indexing operations in pandas. Being familiar with them is very helpful for you to deal with pandas data. Of course, I didn't discuss MultiIndex, which can be discussed in a future article.
Author: Yong Cui