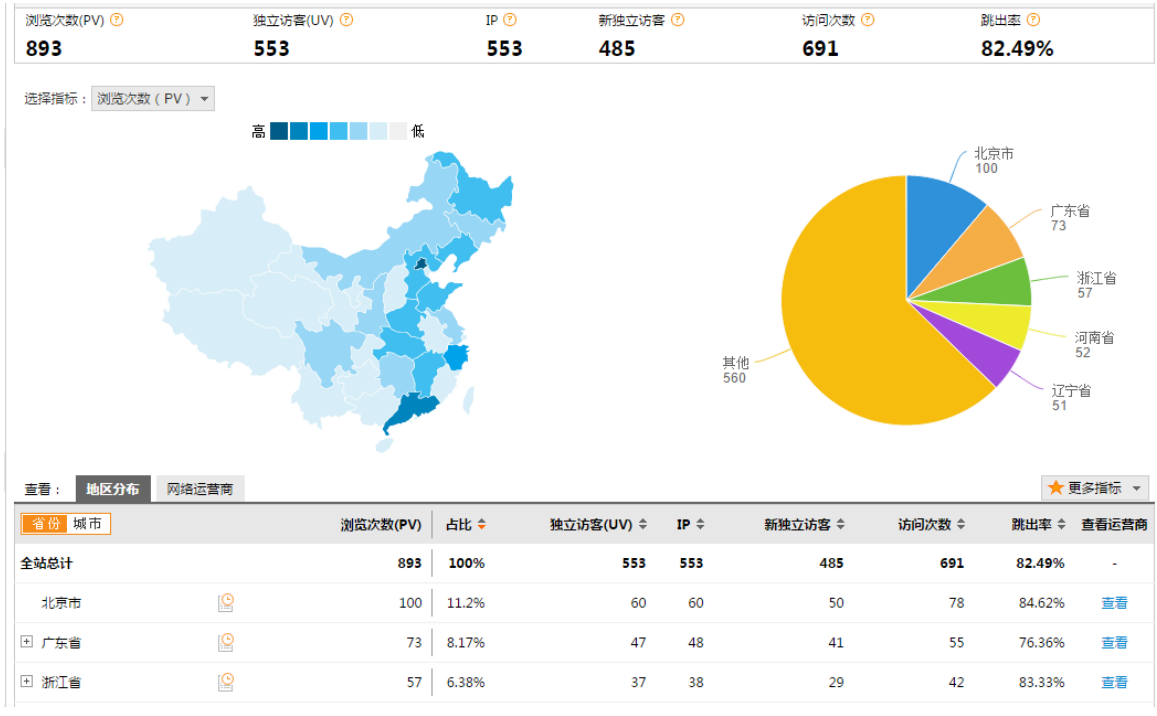
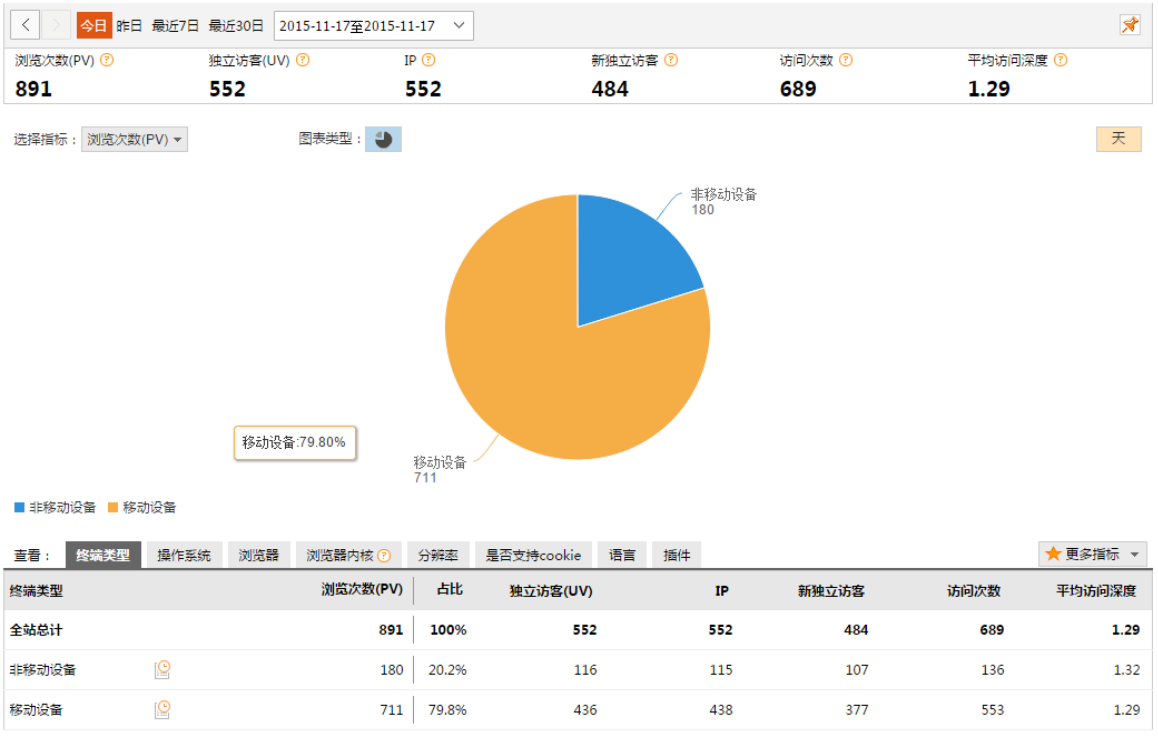
In the enterprise data analysis system, there are many front-end display tools.
-
Independent deployment of specialized systems: represented by foreign products such as Business Objects(BO,Crystal Report),Heperion(Brio),Cognos, etc., their servers are deployed separately and communicate information with applications through some protocol.
-
There are WEB program presentation methods: through independent or embedded java web system to read the report statistics results, in the form of web pages to show the results, such as, 100% pure Java wet report.
This log analysis project adopts the way of developing web program presentation by itself.
- The technical framework adopted by the Web presentation program is as follows:
Jquery + Echarts + springmvc + spring + mybatis + mysql - Presentation process:
1. Use ssh to read the data to be displayed from mysql
2. Use json format to return the read data to the page
3. Apply echarts on the page to parse json and form icons
Web Program Engineering Architecture
Using maven management project, introducing SSH framework dependency and jquery+echarts js Library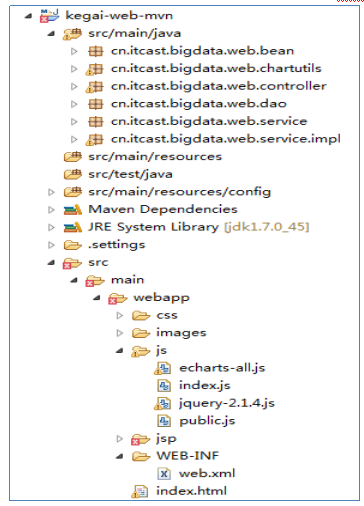
Implementation Code of Web Program
Implement with typical MVC architecture
| page | HTML + JQUERY + ECHARTS |
|---|---|
| Controller | SpringMVC |
| Service | Service |
| DAO | Mybatis |
| data base | Mysql |
Code example: ChartService Impl
@Service("chartService")
public class ChartServiceImpl implements IChartService {
	@Autowired
	IEchartsDao iEchartsDao;

	public EchartsData getChartsData() {
		List<Integer> xAxiesList = iEchartsDao.getXAxiesList("");
		List<Integer> pointsDataList = iEchartsDao.getPointsDataList("");


		EchartsData data = new EchartsData();
		ToolBox toolBox = EchartsOptionUtil.getToolBox();
		Serie serie = EchartsOptionUtil.getSerie(pointsDataList);
		ArrayList<Serie> series = new ArrayList<Serie>();
		series.add(serie);


		List<XAxi> xAxis = EchartsOptionUtil.getXAxis(xAxiesList);
		List<YAxi> yAxis = EchartsOptionUtil.getYAxis();

		HashMap<String, String> title = new HashMap<String, String>();
		title.put("text", "pvs");
		title.put("subtext", "super pvs");
		HashMap<String, String> tooltip = new HashMap<String, String>();
		tooltip.put("trigger", "axis");

		HashMap<String, String[]> legend = new HashMap<String, String[]>();
		legend.put("data", new String[]{"pv Statistics"});


		data.setTitle(title);
		data.setTooltip(tooltip);
		data.setLegend(legend);
		data.setToolbox(toolBox);
		data.setCalculable(true);
		data.setxAxis(xAxis);
		data.setyAxis(yAxis);
		data.setSeries(series);
		return data;
	}

	public List<HashMap<String, Integer>> getGaiKuangList(String date) throws ParseException{

		HashMap<String, Integer> gaiKuangToday = iEchartsDao.getGaiKuang(date);
		SimpleDateFormat sf = new SimpleDateFormat("MMdd");
		Date parse = sf.parse(date);
		Calendar calendar = Calendar.getInstance();
		calendar.setTime(parse);
		calendar.add(Calendar.DAY_OF_MONTH, -1);
		Date before = calendar.getTime();
		String beforeString = sf.format(before);
		System.out.println(beforeString);

		HashMap<String, Integer> gaiKuangBefore = iEchartsDao.getGaiKuang(beforeString);

		ArrayList<HashMap<String, Integer>> gaiKuangList = new ArrayList<HashMap<String, Integer>>();
		gaiKuangList.add(gaiKuangToday);
		gaiKuangList.add(gaiKuangBefore);

		return gaiKuangList;

	}

	public static void main(String[] args) {
		ChartServiceImpl chartServiceImpl = new ChartServiceImpl();
		EchartsData chartsData = chartServiceImpl.getChartsData();
		Gson gson = new Gson();
		String json = gson.toJson(chartsData);
		System.out.println(json);

	}
}
Presentation Effect of Web Programs
1. Site Profile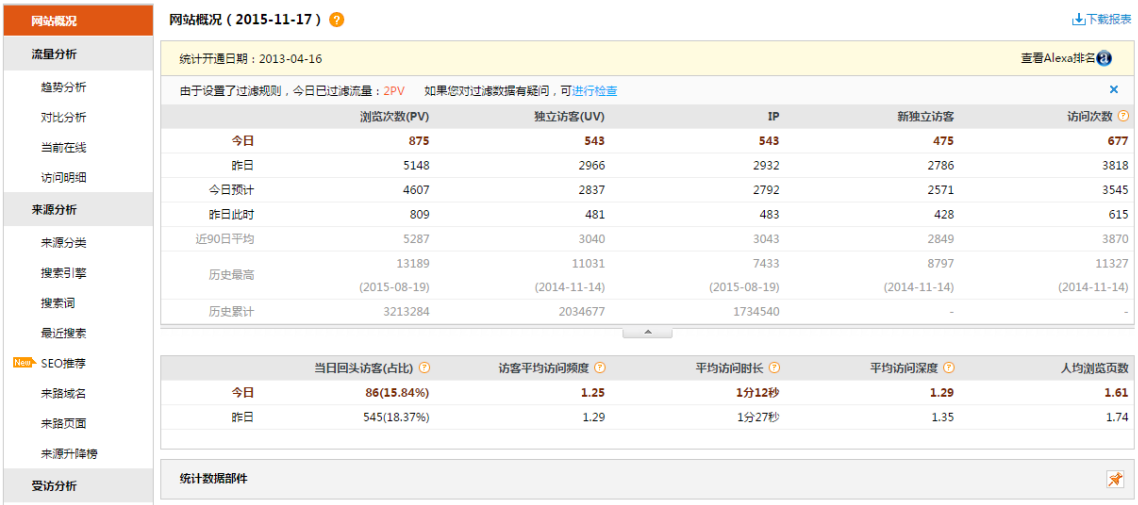
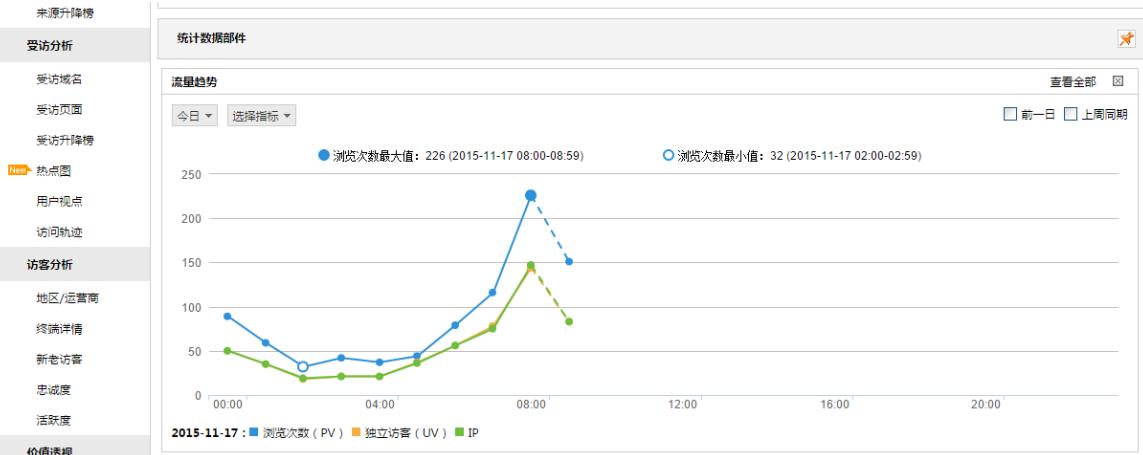
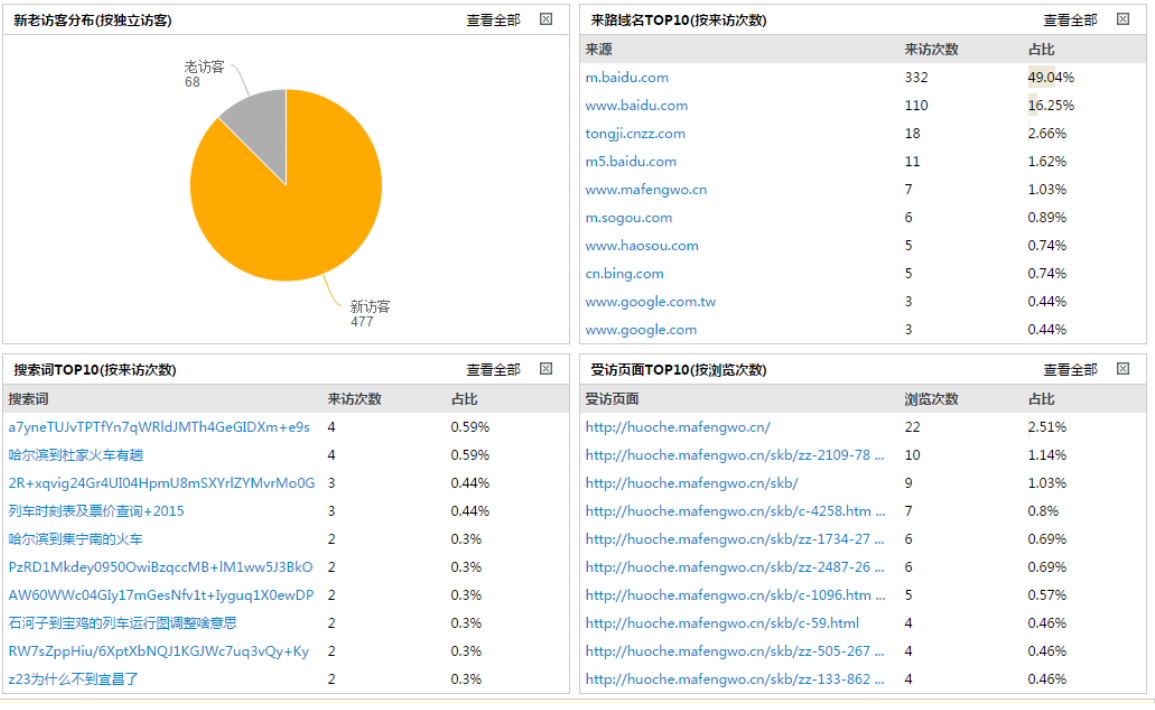
2. Flow analysis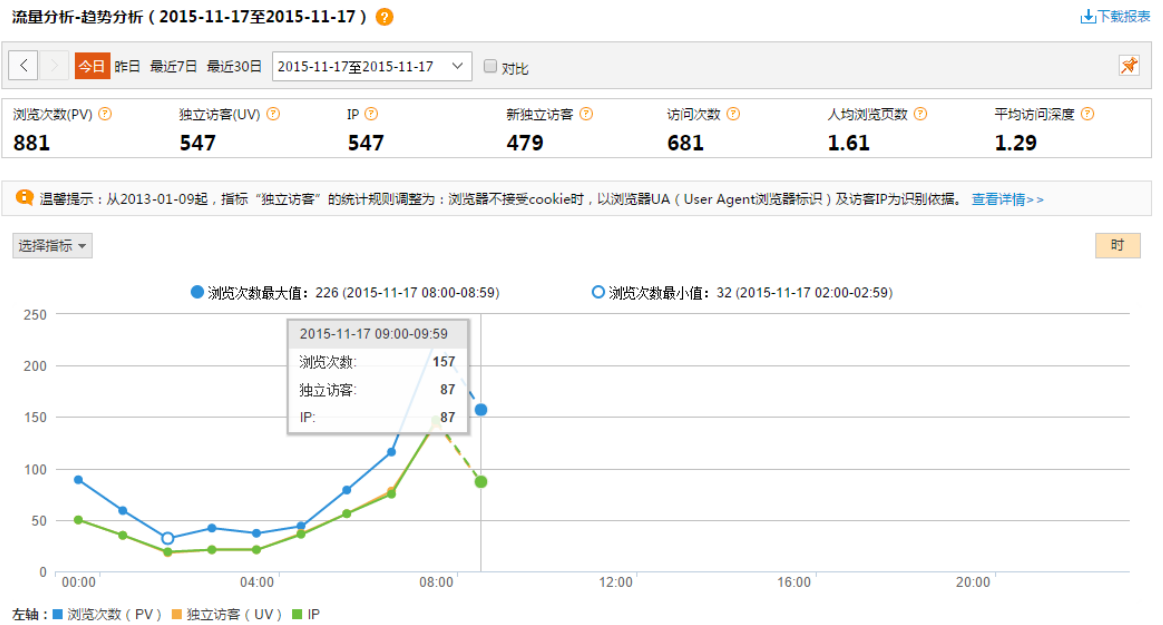
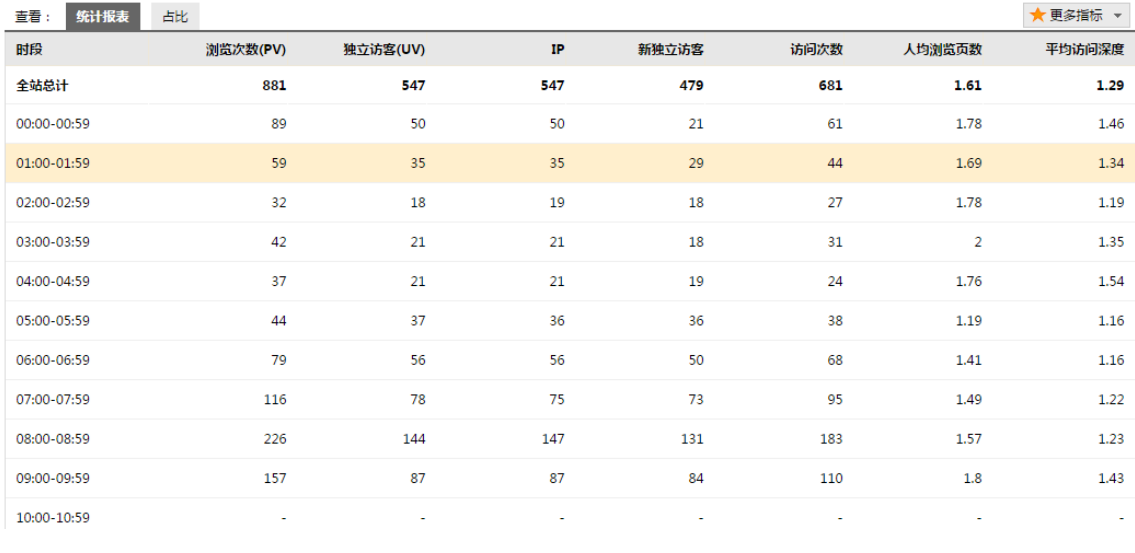
3. Source analysis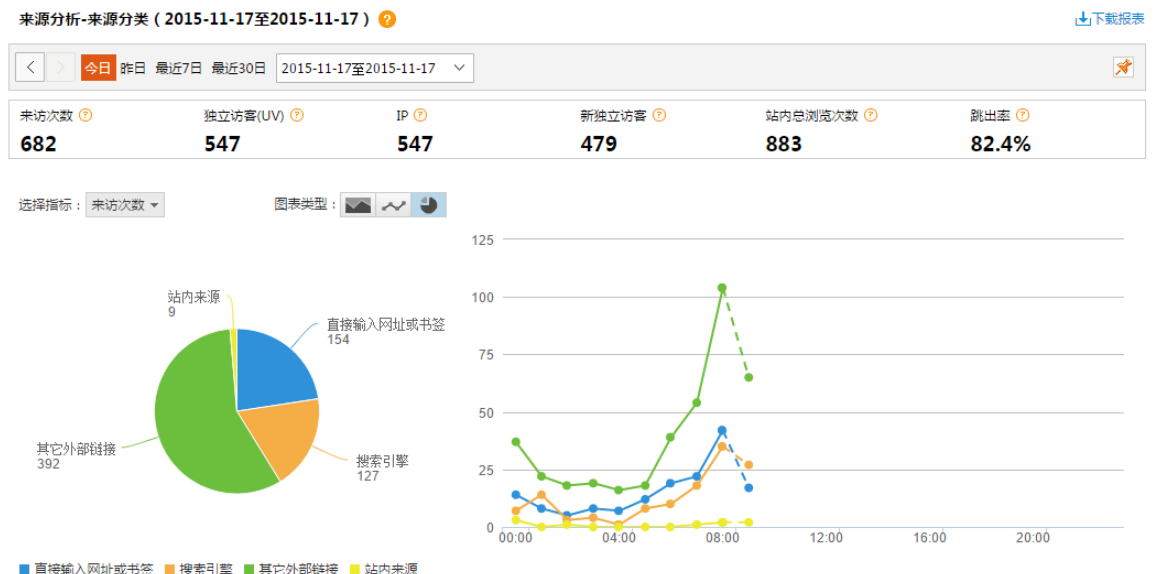
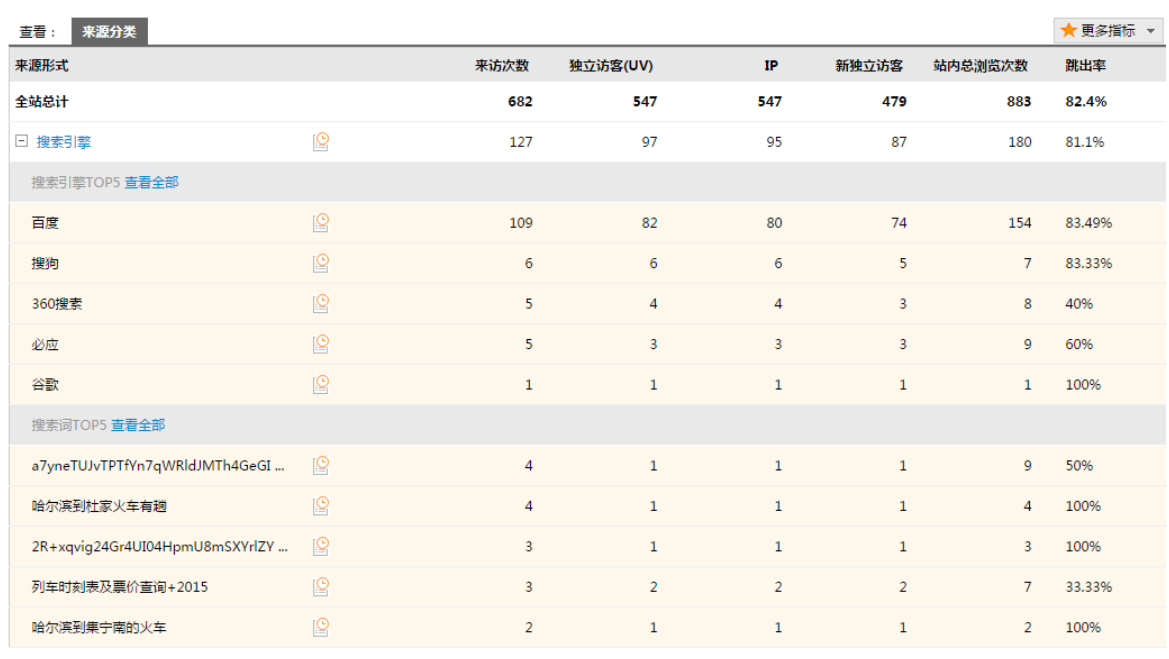
4. Visitor Analysis