Pyplot is a sub Library of Matplotlib, which provides a drawing API similar to MATLAB. Pyplot is a commonly used drawing module, which can easily allow users to draw 2D charts. Pyplot contains a series of related functions of drawing functions. Each function will make some modifications to the current image, such as marking the image, generating a new image, generating a new drawing area in the image, etc.
When using, we can use import to import the pyplot library and set an alias plt. Often need to numpy Also import in.
import matplotlib.pyplot as plt
import numpy as np
1.plt.figure()
Create a diagram. Relevant parameters include:
plt.figure(num=None, figsize=None, dpi=None, facecolor=None, edgecolor=None, frameon=True)
num: image number or name, number is number and string is name.
figsize: Specifies the width and height of figure, in inches;
dpi: the parameter specifies the resolution of the drawing object, that is, how many pixels per inch. The default value is 80. One inch equals 2.5cm, and A4 paper is 21*30cm paper
facecolor: background color
edgecolor: border color
frameon: Show border
2.plt.subplot()
Subplot can be used to create a single subgraph, and each subplot command will create only one subgraph.
For example, plot. Subplot (2,3,1) can also be abbreviated as plot. Subplot (231) indicates that the display interface is divided into 2 * 3 grids. The first parameter is the number of rows, the second parameter is the number of columns, and the third parameter represents the label of the graph.
[example]
t=np.arange(0.0,2.0,0.1)
s=np.sin(t*np.pi)
plt.subplot(2,2,1) #To generate two rows and two columns, this is the first graph, plot. Subplot ('row ',' column ',' number ')
plt.plot(t,s,'b--')
plt.ylabel('y1')
plt.subplot(2,2,2) #Two rows and two columns, this is the second figure
plt.plot(2*t,s,'r--')
plt.ylabel('y2')
plt.subplot(2,2,3)#Two rows and two columns, this is the third figure
plt.plot(3*t,s,'m--')
plt.subplot(2,2,4)#Two rows and two columns, this is the fourth figure
plt.plot(4*t,s,'k--')
plt.show()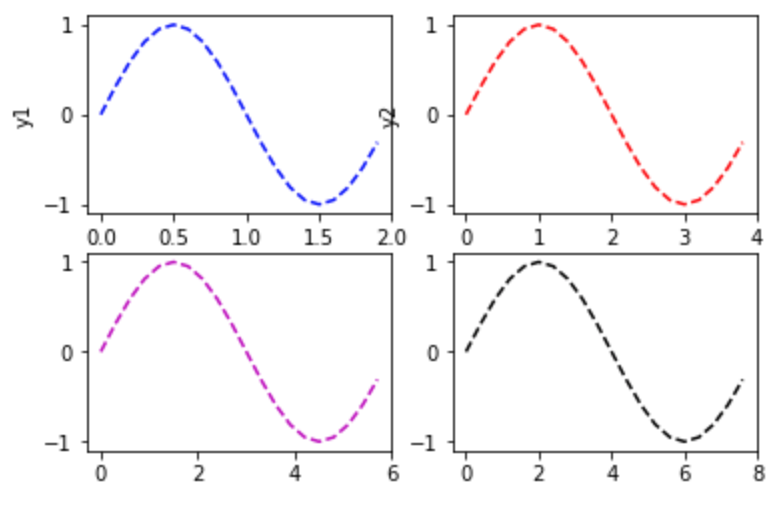
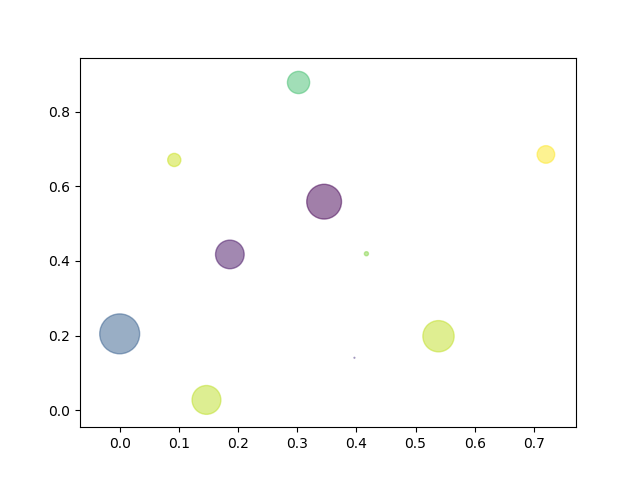
3.plt.scatter()
Draw scatter gram. Relevant parameters include:
matplotlib.pyplot.scatter(x, y, s=None, c=None, marker=None, cmap=None, norm=None, vmin=None, vmax=None, alpha=None, linewidths=None, verts=None, edgecolors=None, *, data=None, **kwargs)
x. y: represents an array of size (n,), that is, the data points we are about to draw the scatter diagram
s: Point size, real number, this is an optional parameter.
c: It represents color and is also an option. The default is blue 'b', which indicates the color of the mark, or can be a character representing the color, or a sequence of colors with a length of n, etc. it seems that it has not been used. It is not explained now. However, C cannot be a single RGB number or an RGBA sequence. Can be their 2-dimensional array (only one row).
Marker: indicates the style of the marker. The default is' o '.
cmap: Colormap entity or the name of a colormap. CMAP is only used when c is a floating-point array. If there is no declaration, it is image.cmap
norm: Normalize entity to convert data brightness to 0-1. It is only used when c is an array of floating-point numbers. If there is no declaration, it defaults to colors.Normalize.
vmin,vmax: real number, ignored when norm exists. Used to normalize brightness data.
alpha: real number, adjust line opacity, value range 0-1.
linewidths: that is, the length of the marked point.
[example]
import numpy as np
import matplotlib.pyplot as plt

np.random.seed(1)
x=np.random.rand(10)
y=np.random.rand(10)

colors=np.random.rand(10)
area=(30*np.random.rand(10))**2

plt.scatter(x,y,s=area,c=colors,alpha=0.5)
plt.show()
[example] draw a scatter diagram of data items in the figure:
plt.figure()
plt.scatter(data['age'], data['charges'])
plt.title('Charges vs Age (Origin Dataset)')
plt.show()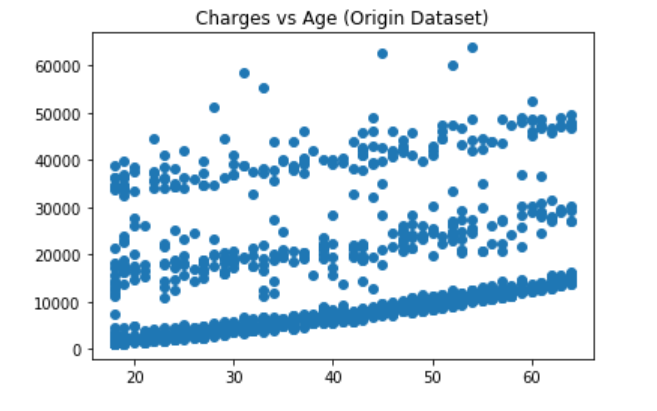
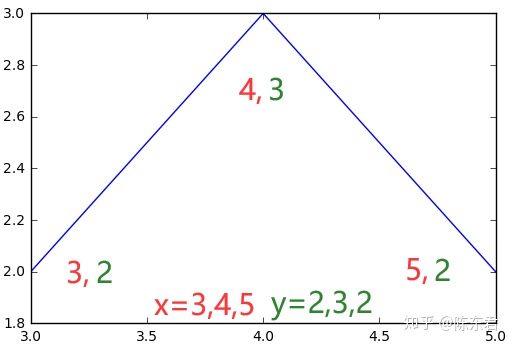
4.plt.plot()
The plot. Plot () function is a function under the matplotlib.pyplot module, Used for drawing. It can draw points and lines, and control their styles
[example]
import matplotlib.pyplot as plt
x=[3,4,5] # [list]
y=[2,3,2] # x. The number of Y elements N should be the same
plt.plot(x,y)
plt.show()
Relevant parameters of plot:
import matplotlib.pyplot as plt
y=[2,3,2]
# Blue, line width 20, dot, dot size 50, dot fill red, dot edge width 6, dot edge gray
plt.plot(y,color="blue",linewidth=20,marker="o",markersize=50,
         markerfacecolor="red",markeredgewidth=6,markeredgecolor="grey")
plt.show()
4.plt.title(),plt.xlabel(),plt.ylabel()
Add the title, abscissa description and ordinate description of the figure respectively.
[example]
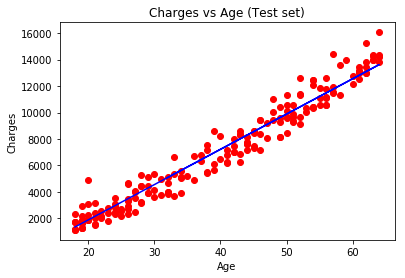
plt.scatter(x_test, y_test, color = 'red')
plt.plot(x_test, y_pred, color = 'blue')
plt.title('Charges vs Age (Test set)')
plt.xlabel('Age')
plt.ylabel('Charges')
plt.show()