In intelligent risk control or other data science competitions, we can often find such features from the user's basic information table:
Field English name | Field meaning |
|---|---|
last_3m_avg_aum | Average aum in recent 3 months |
last_6m_avg_aum | Average aum in recent 6 months |
last_12m_avg_aum | Average aum in recent 12 months |
last_3m_avg_times | Average withdrawal value in recent 3 months |
last_3m_avg_times | Average withdrawal value in recent 6 months |
last_3m_avg_times | Average withdrawal value in recent 12 months |
These original features have their own "contribution" in modeling. Obviously, we can generate many features based on these fields. One characteristic is the incremental variable about these variables. What does it mean?
This is the relationship between 3-month average aum: if it is incremental, record the newly generated feature as 1, otherwise record it as 0
Data preparation
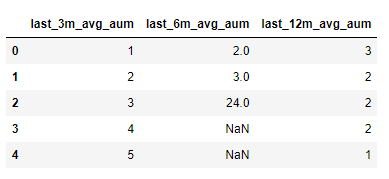
Before the experiment, we prepare the data. The experimental data we set are as follows:
import pandas as pd
data = [
        [1,2,3,],
        [2,3,2],
        [3,24,2],
        [4,np.nan,2],
        [5,np.nan,1]
    ]
columns = ['last_3m_avg_aum','last_6m_avg_aum','last_12m_avg_aum']
data_df = pd.DataFrame(data,columns=columns)
data_df
Column increment
Assuming that our current requirement is to judge whether a column of data is increasing, how to achieve this? We can traverse a column of data to compare the next value with the current value.
Obviously, this method is stupid. Fortunately, pandas implements a method that we can call directly, such as the following examples (the code uses Jupiter notebook):
data_df['last_3m_avg_aum'].is_monotonic
data_df['last_3m_avg_aum'].is_monotonic_increasing
data_df['last_12m_avg_aum'].is_monotonic
data_df['last_12m_avg_aum'].is_monotonic_decreasing

# Output in sequence:
True
True
False
True
It can be seen that:
is_monotonic: used to judge strictly monotonic (whether monotonic increasing or monotonic decreasing)
is_monotonic_increasing: used to determine whether to increase (not strictly)
is_monotonic_decreasing: used to judge whether to decrease (not strictly)
Then, for the implementation details of these methods, you can turn to the official documents for viewing.
This is about the method of column increment, which can be completed by using the method provided by Pandas.
Row increment
The above judgment is column increment, so how to realize the increment judgment of row data? Next, we offer several ideas and methods for your consideration. We also welcome small partners to propose new methods:
(1) The first method is to simply use the for loop to obtain data for judgment. Because it is too simple, it will not be demonstrated.
(2) The second method is to transpose the target dataframe, and then use the built-in method to judge. Next, I will write a function to judge whether each row of data is increasing, and add a new column to store the judgment results:
import gc
import pandas as pd
def progressive_increasing(df,columns,newcolname):
    df_T = df[columns].T
    df[newcolname] = df_T.apply(lambda x:x.is_monotonic)
    df[newcolname] = df[newcolname].astype(int)
    del df_T
    gc.collect()
    return df
columns = ['last_3m_avg_aum','last_6m_avg_aum','last_12m_avg_aum']
new_df = progressive_increasing(data_df,columns,'is_increasing')
Print new_ The output of DF is:
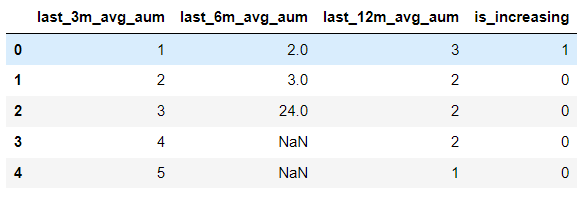
is_ The increasing column stores the features we need. The above functions are easy to use. We can achieve our requirements by passing in three parameters.
Do you think you are a special show? However, there will be a problem in actual use. When we have a large amount of data, for example, when I was processing 100W samples, this function will not run. So what's the problem? Let's find out for ourselves.
When looking for the answer, we will find a new problem: the transposition problem of large matrix / large sparse matrix.
I feel there is another topic to discuss, but we won't discuss it this time.
In addition, a trick in the above method is to use GC Collect() can help us save some memory in the case of a large amount of data.
In order to solve the problem that this function can't run, I wrote another method. This method is ultimately my solution for building features.
(3) Method 3 is also very simple. Talk is cheat, show you the code:
import pandas as pd
def progressive_increasing_use(df,columns,newcolname):
    df[newcolname] = (df[columns[1]] > df[columns[0]]) & (df[columns[2]] > df[columns[0]])
    df[newcolname] = df[newcolname].astype(int)
    return df
columns = ['last_3m_avg_aum','last_6m_avg_aum','last_12m_avg_aum']
new_df = progressive_increasing_use(data_df,columns,'is_increasing')
new_df
The output is as follows:
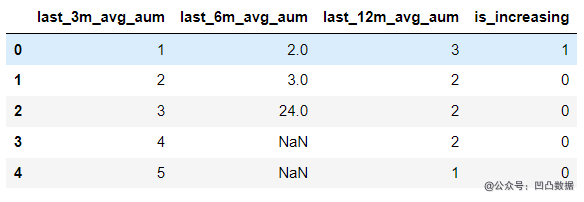
As like as two peas of the above second methods, what is the difference between the method and the second methods? Let's use%% time to see:
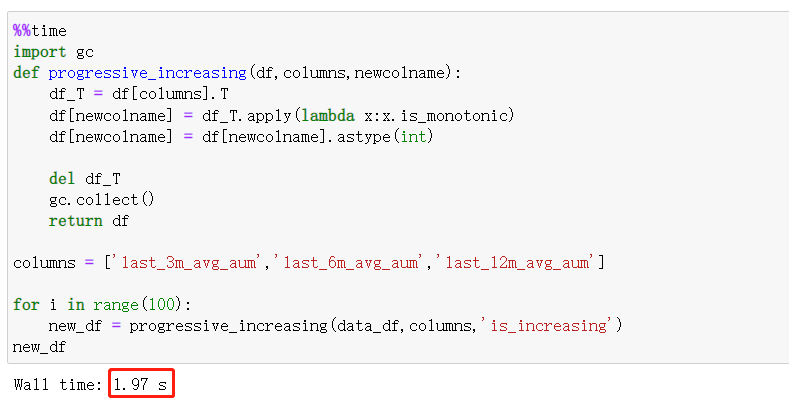
The time consumed by 100 runs is 1.97s. If we take out the code of memory recycling, let's take a look at the time:
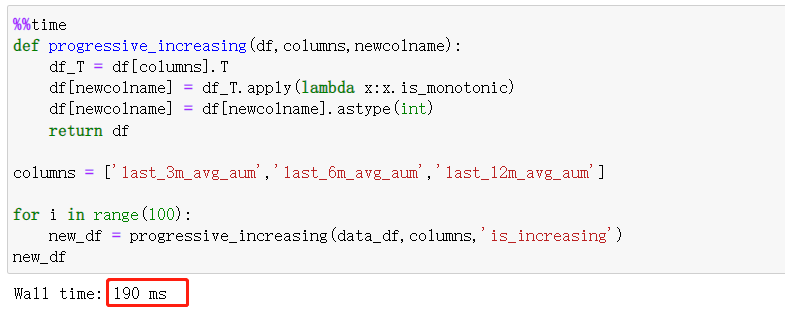
It will save a lot of time, about 190ms. Because the dataframe is relatively small, the time to reclaim memory is relatively large. Take another look at the time of the third method:

Obviously, the third method consumes the shortest time. When we deal with a large dataframe, the time gap between different methods will widen more. You can create a large dataframe to experiment.
summary
In this article, we start from a problem encountered in the construction of Feature Engineering, explain how to calculate an increasing trend feature, and lead to a problem worthy of thinking: transpose (storage) of large matrix. If you are free, we will study the related problems of large matrices in our next tweet. In addition, we can also construct other features, such as the number of each line greater than the average value of this line, and so on.
The above is the whole content of this article. Dear friends, see you next time.