1-Metrics introduction
Because it is difficult to find the actual internal situation after the cluster is running, whether it runs slowly or fast, whether it is abnormal, etc., developers cannot view all Task logs in real time. For example, how to deal with large jobs or many jobs? At this point, Metrics can help developers understand the current situation of the job.
Metrics provided by Flink can collect some indicators within Flink, which can help developers better understand the status of jobs or clusters.
2- Metric Types
The types of Metrics are as follows:
1. Common counters, such as Counter, should be familiar to developers who have written mapreduce jobs. In fact, the meaning is the same, that is, the accumulation of a Counter, that is, the process of adding up multiple pieces of data and multi megabytes of data.
2. Gauge. Gauge is the simplest metric, which reflects a value. For example, depending on how much Java heap memory is used, you can expose a gauge in real time each time. The current value of gauge is the amount used by heap.
3. Meter refers to the statistical throughput and the number of "events" in a unit time. It is equivalent to finding a rate, that is, the number of events divided by the time used.
4. Histogram. Histogram is complex and not commonly used. Histogram is used to count the distribution of some data, such as Quantile, Mean, StdDev, Max, Min, etc.
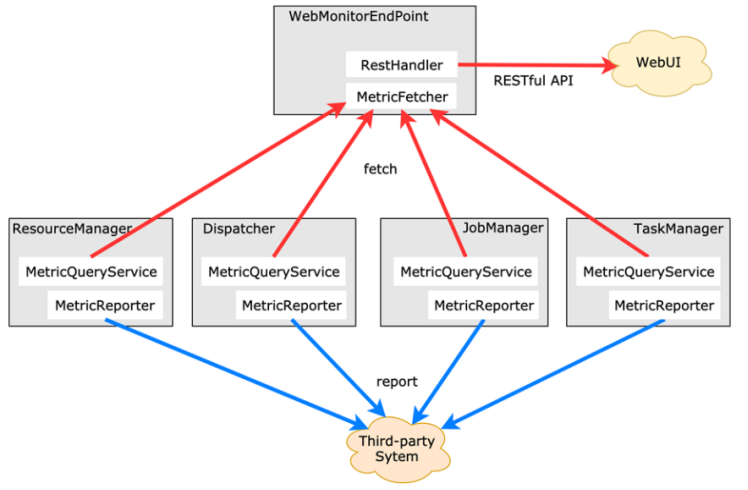
Metric has a multi-layer structure inside Flink, which is organized in the form of a Group. It is not a flat structure. Metric Group + Metric Name is the only identification of Metrics.
Code demonstration:
import org.apache.flink.api.common.RuntimeExecutionMode;
import org.apache.flink.api.common.functions.FlatMapFunction;
import org.apache.flink.api.common.functions.RichMapFunction;
import org.apache.flink.api.java.tuple.Tuple2;
import org.apache.flink.configuration.Configuration;
import org.apache.flink.metrics.Counter;
import org.apache.flink.streaming.api.datastream.DataStream;
import org.apache.flink.streaming.api.datastream.SingleOutputStreamOperator;
import org.apache.flink.streaming.api.environment.StreamExecutionEnvironment;
import org.apache.flink.util.Collector;
/**
* Author itcast
* Desc Demonstrate Flink metrics monitoring
* Provide a Counter in the map operator to count the number of data processed by the map, and then monitor it on the Web UI after running
*/
public class MetricsDemo {
public static void main(String[] args) throws Exception {
//TODO 0.env
StreamExecutionEnvironment env = StreamExecutionEnvironment.getExecutionEnvironment();
env.setRuntimeMode(RuntimeExecutionMode.AUTOMATIC);
//TODO 1.source
DataStream<String> lines = env.socketTextStream("node1", 9999);
//TODO 2.transformation
SingleOutputStreamOperator<String> words = lines.flatMap(new FlatMapFunction<String, String>() {
@Override
public void flatMap(String value, Collector<String> out) throws Exception {
String[] arr = value.split(" ");
for (String word : arr) {
out.collect(word);
}
}
});
SingleOutputStreamOperator<Tuple2<String, Integer>> wordAndOne = words
.map(new RichMapFunction<String, Tuple2<String, Integer>>() {
Counter myCounter;//Used to record how many words the map processed
//Initialize Counter
@Override
public void open(Configuration parameters) throws Exception {
myCounter = getRuntimeContext().getMetricGroup().addGroup("myGroup").counter("myCounter");
}
//Process words and record them as (word, 1)
@Override
public Tuple2<String, Integer> map(String value) throws Exception {
myCounter.inc();//Counter + 1
return Tuple2.of(value, 1);
}
});
SingleOutputStreamOperator<Tuple2<String, Integer>> result = wordAndOne.keyBy(t -> t.f0).sum(1);
//TODO 3.sink
result.print();
//TODO 4.execute
env.execute();
}
}
// Submit Jar package
/export/server/flink/bin/yarn-session.sh -n 2 -tm 800 -s 1 -d
//
/export/server/flink/bin/flink run --class cn.itcast.metrics.MetricsDemo /root/metrics.jar
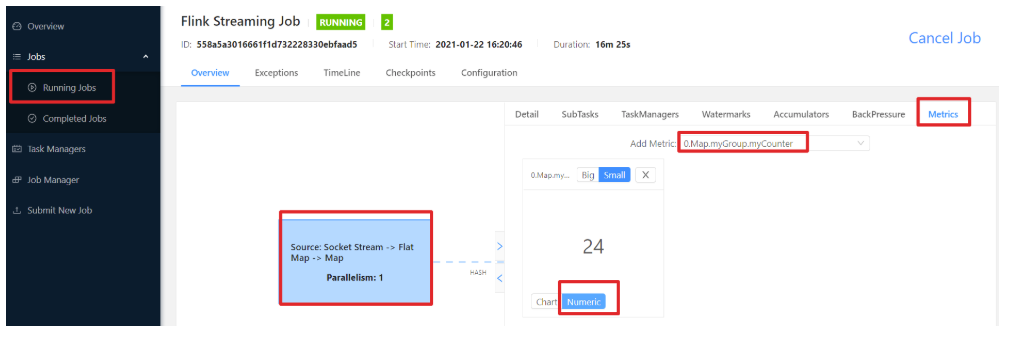
// View WebUI
Operation:
-
pack
-
Submit to run on Yan
-
View monitoring indicators
-
You can also send a request to obtain monitoring information through the find url of browser f12
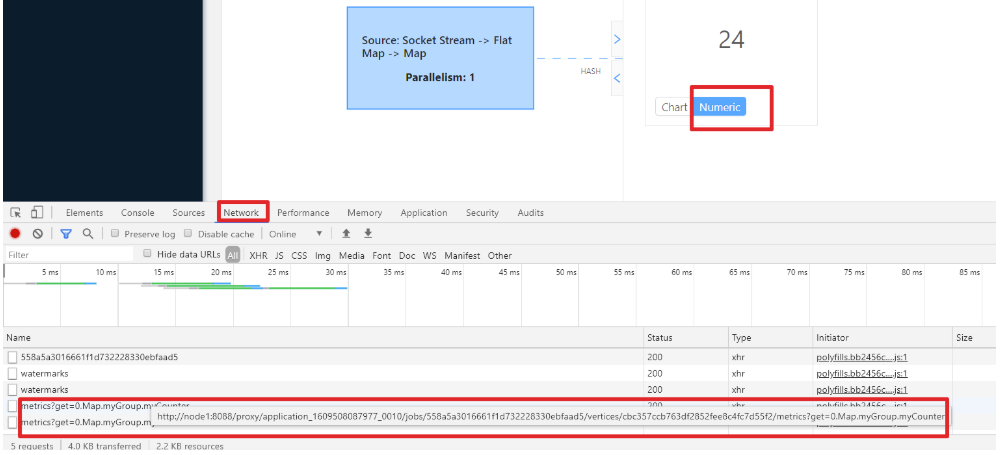
-
You can also send a request to obtain monitoring information through code
import java.io.BufferedReader;
import java.io.InputStreamReader;
import java.net.URL;
import java.net.URLConnection;

public class MetricsTest {
    public static void main(String[] args) {
        //TODO: Address
        //String result = sendGet("http://node1:8088/proxy/application_1609508087977_0010/jobs/558a5a3016661f1d732228330ebfaad5/vertices/cbc357ccb763df2852fee8c4fc7d55f2/metrics?get=0.Map.myGroup.myCounter");
        String result = sendGet("http://node1:8088/proxy/application_1609508087977_0010/jobs/558a5a3016661f1d732228330ebfaad5");

        System.out.println(result);
    }

    public static String sendGet(String url) {
        String result = "";
        BufferedReader in = null;
        try {
            String urlNameString = url;
            URL realUrl = new URL(urlNameString);
            URLConnection connection = realUrl.openConnection();
            // Set common request properties
            connection.setRequestProperty("accept", "*/*");
            connection.setRequestProperty("connection", "Keep-Alive");
            connection.setRequestProperty("user-agent", "Mozilla/4.0 (compatible; MSIE 6.0; Windows NT 5.1;SV1)");
            // Establish actual connection
            connection.connect();
            in = new BufferedReader(new InputStreamReader(connection.getInputStream()));
            String line;
            while ((line = in.readLine()) != null) {
                result += line;
            }
        } catch (Exception e) {
            System.out.println("send out GET Exception in request!" + e);
            e.printStackTrace();
        }
        // Use the finally block to close the input stream
        finally {
            try {
                if (in != null) {
                    in.close();
                }
            } catch (Exception e2) {
                e2.printStackTrace();
            }
        }
        return result;
    }

}
- 6. You can also integrate third-party tools to monitor flynk
https://blog.lovedata.net/8156c1e1.html
Note: but most companies have their own set of monitoring