ABP usage ElasticSearch,Kibana,Docker Log collection
In the follow-up, we will sort out and share the technology according to the technology used by the company. It's all dry goods. Don't forget to pay attention to me!!!
Recently, the leader wants me to collect the project Logs in a unified way, because the log data in the Logs folder is used for any error messages in the environment. It doesn't matter if there is only one project, but our current service has split modules, so it's inconvenient to find the Logs one by one. I've been in contact with Seq ElasticSearch collects Logs for unified viewing.
Technical point
- ElasticSearch
ElasticSearch is an open source database that is very suitable for indexing logs and analyzing data.
- Kibana
Kibana is ElasticSearch's open source data visualization user interface. Treat ElasticSearch as a database and kibana as a Web user interface, which you can use to build graphics and query data in ElasticSearch.
- Serilog
Serilog is a for ASP Net core, which makes logging easy. Serilog has a variety of receivers available - for example, you can get plain text, SQL, elastic search receivers, and so on.
Why use ElasticSearch (of course, Seq will be introduced later)
- It is free and open source
The basic functions are free, and most of them are free. If you need the security and alert features in Kibana, you can buy Kibana's commercial X-pack subscription or install some open source alternatives.
- RESTful API
The query results are returned in JSON format, which means that the results are easy to use. Querying and inserting data through the RESTful API means that ElasticSearch can be easily handled in any programming language.
- Easy to query
ElasticSearch has a built-in full-text search engine based on Apache Lucene. Compared with other databases, Lucene is easy to query. Even non-technical people can write common queries.
- Very fast - very fast
Querying a large SQL database may take 10 or 20 seconds. Similar queries on large ElasticSearch databases typically return results within 10 milliseconds.
- It is scalable
It's easy to expand. Plus it's open source, which means it's easy to put in a wallet.
- Easy to set
Just start a docker compose file containing ElasticSearch and Kibana containers, and you can start recording and searching.
Docker builds Elasticsearch and Kibana environments
Here we use docker compose, so we need to install it docker-compose Then create a docker - compose YML file.
mkdir -p home/docker/docker-compose
cd home/docker/docker-compose
Create a file named docker compose New file for YML
vi docker-compose.yml
docker-compose.yml file content
- Set es memory. Java programs generally eat memory. Tune according to the server configuration - "ES_JAVA_OPTS=-Xms512m -Xmx512m"
- kibana Chinese (version 7.0 or above), according to personal situation - output i18n. locale="zh-CN"
version: '3.1'
services:
  elasticsearch:
   container_name: elasticsearch
   hostname: elasticsearch
   image: docker.elastic.co/elasticsearch/elasticsearch:7.9.2
   restart: always
   ports:
    - 9200:9200
    - 9300:9300
   volumes:
    - elasticsearch-data:/usr/share/elasticsearch/data
   environment:
    - xpack.monitoring.enabled=true
    - xpack.watcher.enabled=false
    - "ES_JAVA_OPTS=-Xms512m -Xmx512m"
    - discovery.type=single-node
  kibana:
   container_name: kibana
   hostname: kibana
   image: docker.elastic.co/kibana/kibana:7.9.2
   restart: always
   ports:
    - 5601:5601
   depends_on:
    - elasticsearch
   environment:
    - ELASTICSEARCH_URL=http://localhost:9200
volumes:
  elasticsearch-data:
Run docker compose YML file
After the container starts, it needs to wait for a while because initialization takes a while
# Build start container -d background run
docker-compose up -d

# Stop the container started by the up command and remove the network
docker-compose down
Verification environment
- Elastscearch is running and we can verify that elastscearch is running http://localhost:9200 (that's the 9200 port of Elasticsearch we just opened)
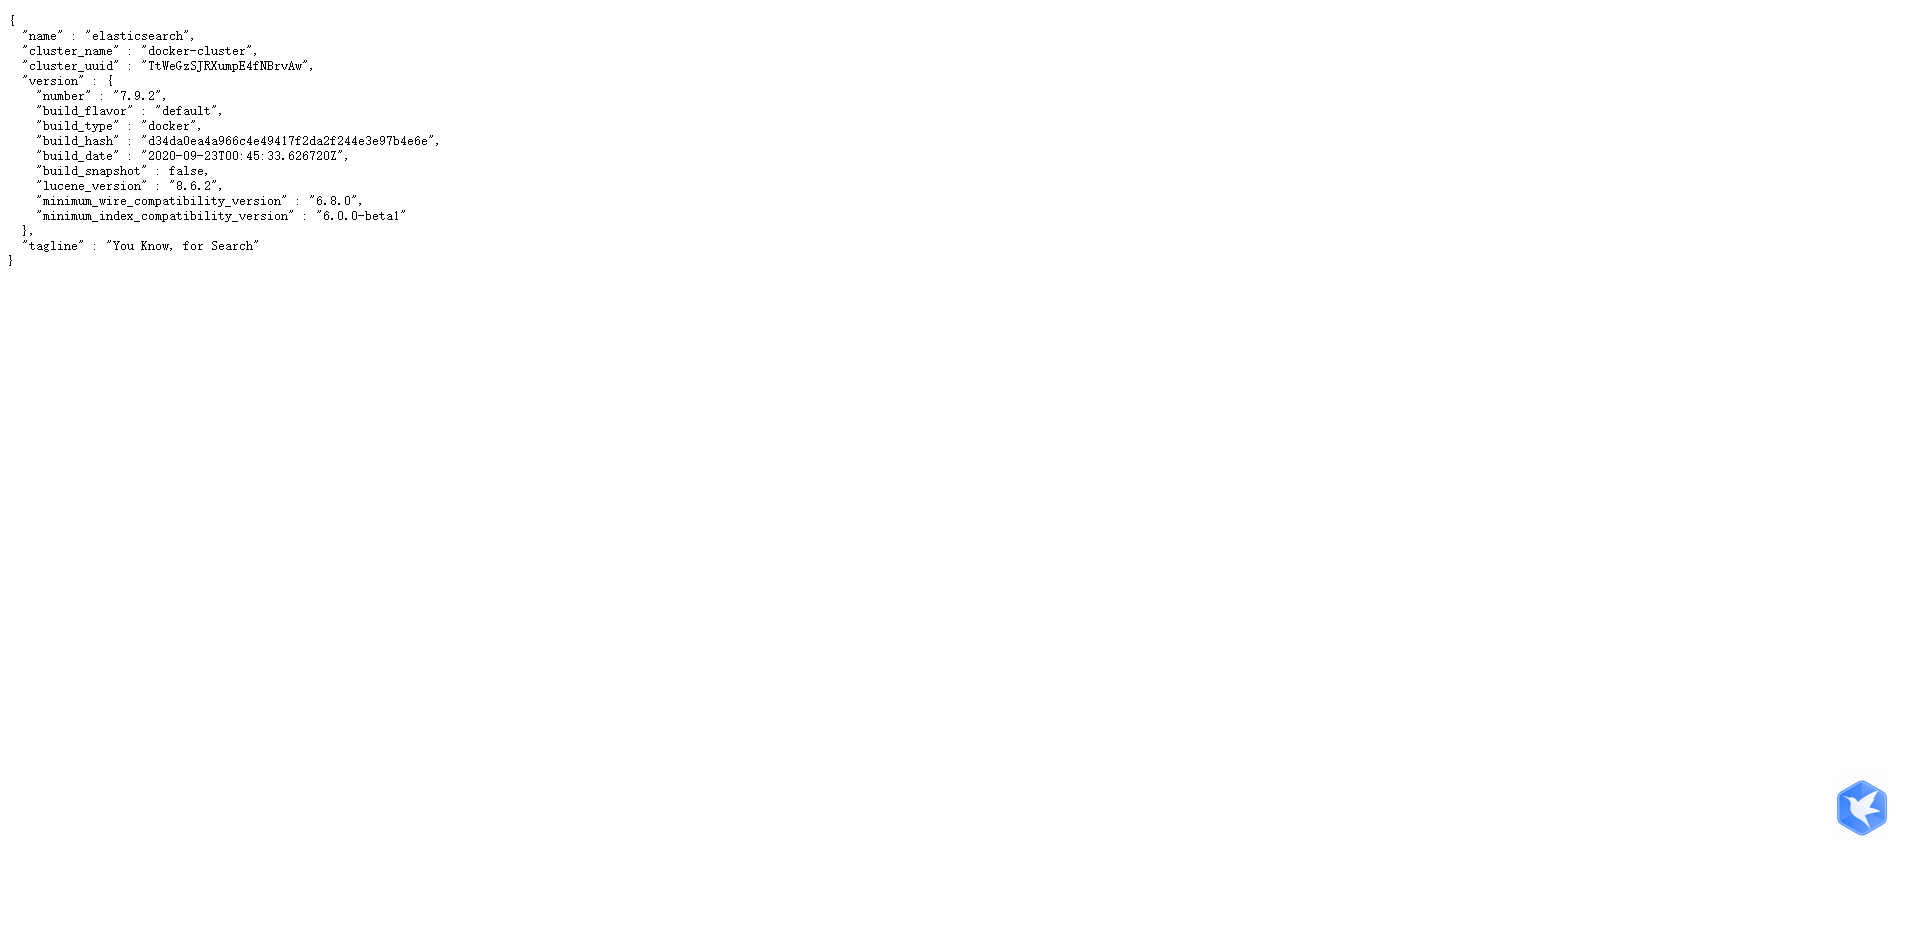
- Verify that Kibana is up and running and we can access it http://localhost:5601 (we just opened the 5601 port of Kibana)
Use Abp and Serilog to record logs to Elasticsearch
-
Add the Serilog package to the project
- Serilog.AspNetCore
- Serilog.Enrichers.Environment
- Serilog.Sinks.Debug
- Serilog.Sinks.ElasticSearch
- Serilog.Exceptions
-
appsettings. Add the Serilog log and Elasticsearch address in JSON
{
  // Serilog log configuration
  "Serilog": {
    "MinimumLevel": {
      "Default": "Information",
      "Override": {
        "Microsoft": "Information",
        "System": "Warning"
      }
    }
  },
  // Elasticsearch address
  "ElasticConfiguration": {
    "Uri": "http://localhost:9200"
  },
  "AllowedHosts": "*"
}
In program Configure logging in CS
Next, add the following using statement in program Configure logging in CS:
using Microsoft.AspNetCore.Hosting;
using Microsoft.Extensions.Configuration;
using Microsoft.Extensions.Hosting;
using Serilog;
using Serilog.Sinks.Elasticsearch;
using System;
using System.Reflection;
using Serilog.Exceptions;
Next, set the main method. What we need to do is set up logging before creating the host. In this way, if the host fails to start, we can log any errors.
public static void Main(string[] args)
{
	// Configure log information
	ConfigureLogging();

	// If the host fails, we can create a host record, and then if there is an error
	CreateHost(args);
}
Then, in program CS add ConfigureLogging and ElasticsearchSinkOptions methods
private static void ConfigureLogging()
{
	var environment = Environment.GetEnvironmentVariable("ASPNETCORE_ENVIRONMENT");
	var configuration = new ConfigurationBuilder()
		.AddJsonFile("appsettings.json", optional: false, reloadOnChange: true)
		.AddJsonFile(
			$"appsettings.{Environment.GetEnvironmentVariable("ASPNETCORE_ENVIRONMENT")}.json",
			optional: true)
		.Build();

	Log.Logger = new LoggerConfiguration()
		.Enrich.FromLogContext()
                .Enrich.WithExceptionDetails()
		.Enrich.WithMachineName()
		.WriteTo.Debug()
		.WriteTo.Console()
		.WriteTo.Elasticsearch(ConfigureElasticSink(configuration, environment))
		.Enrich.WithProperty("Environment", environment)
		.ReadFrom.Configuration(configuration)
		.CreateLogger();
}

private static ElasticsearchSinkOptions ConfigureElasticSink(IConfigurationRoot configuration, string environment)
{
	return new ElasticsearchSinkOptions(new Uri(configuration["ElasticConfiguration:Uri"]))
	{
                // Auto create module
		AutoRegisterTemplate = true,
                // Create an index (if it is not set, the default time format is logstash-2022.03.06)
		IndexFormat = $"{Assembly.GetExecutingAssembly().GetName().Name.ToLower().Replace(".", "-")}-{environment?.ToLower().Replace(".", "-")}"
	};
}
Finally, add CreateHost and CreateHostBuilder methods. Notice the try/catch block around CreateHostBuilder.
private static void CreateHost(string[] args)
{
	try
	{
		CreateHostBuilder(args).Build().Run();
	}
	catch (System.Exception ex)
	{
		Log.Fatal($"Failed to start {Assembly.GetExecutingAssembly().GetName().Name}", ex);
		throw;
	}
}

public static IHostBuilder CreateHostBuilder(string[] args) =>
	Host.CreateDefaultBuilder(args)
		.ConfigureWebHostDefaults(webBuilder =>
		{
			webBuilder.UseStartup<Startup>();
		})
		.ConfigureAppConfiguration(configuration =>
		{
			configuration.AddJsonFile("appsettings.json", optional: false, reloadOnChange: true);
			configuration.AddJsonFile(
				$"appsettings.{Environment.GetEnvironmentVariable("ASPNETCORE_ENVIRONMENT")}.json",
				optional: true);
		})
		.UseSerilog();
Then run your program once and let it automatically create the index information. Later, we just need to configure it
kibana configuration information
- Click to enter the default management space
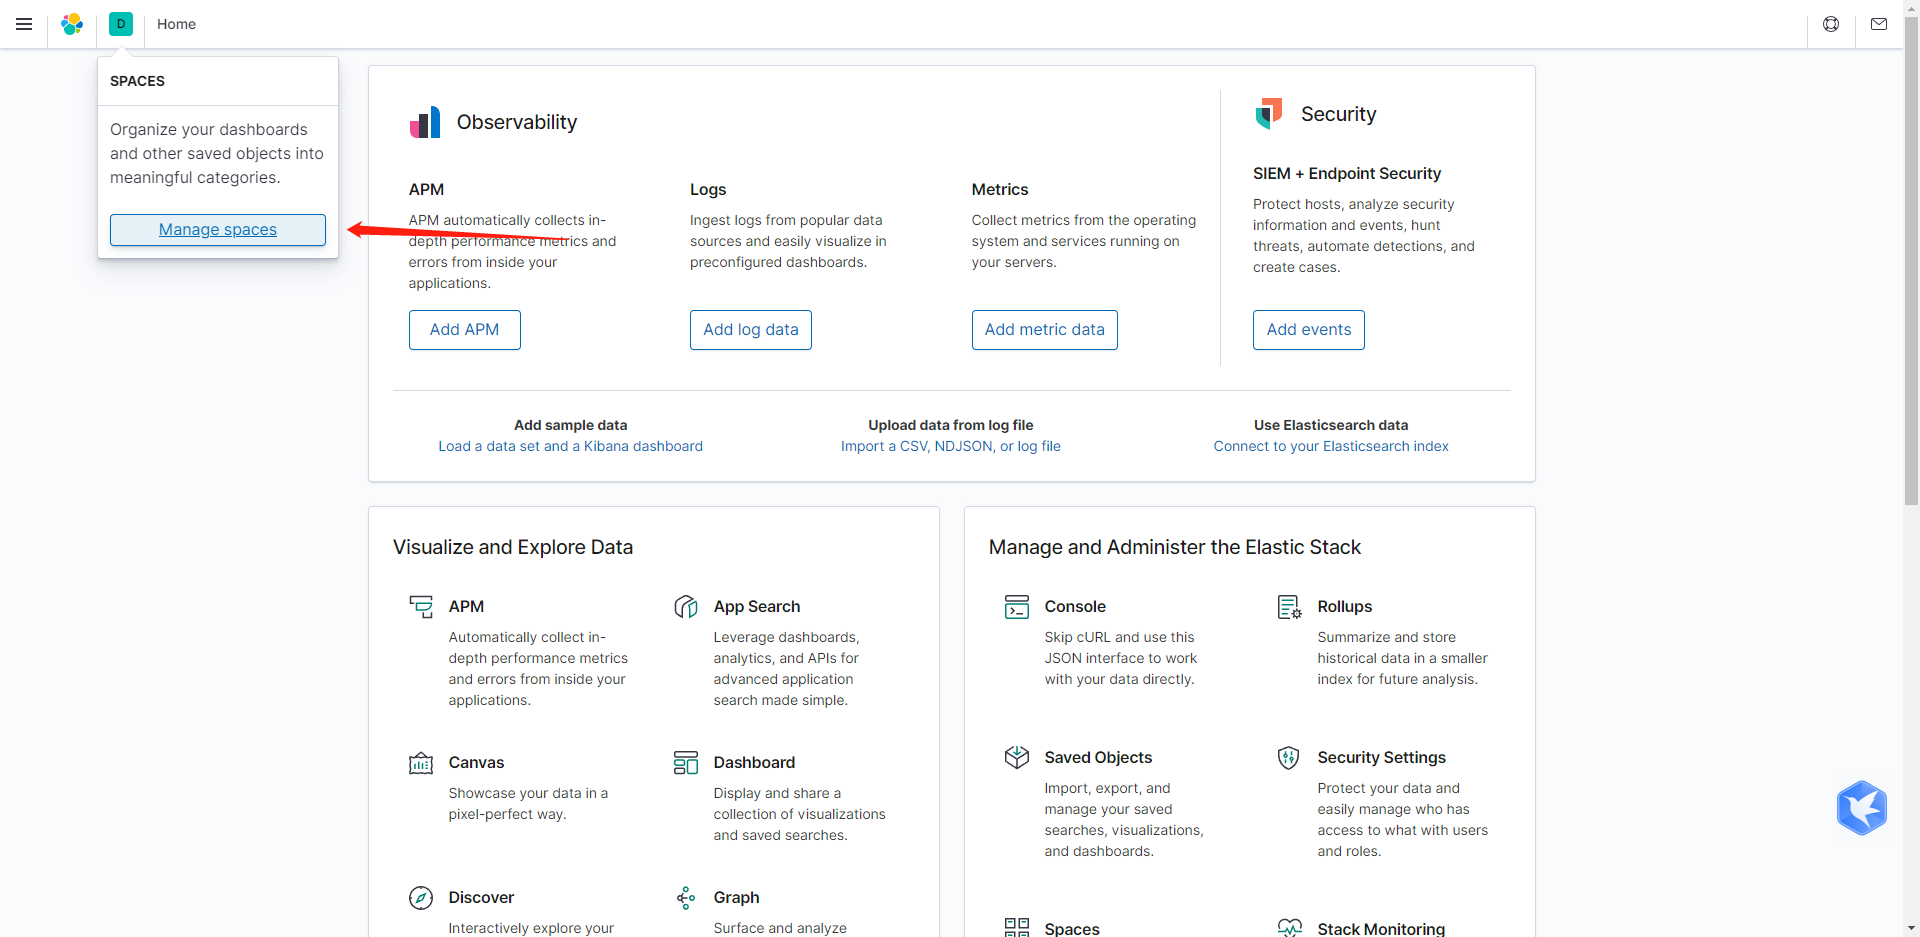
- Manage space configuration
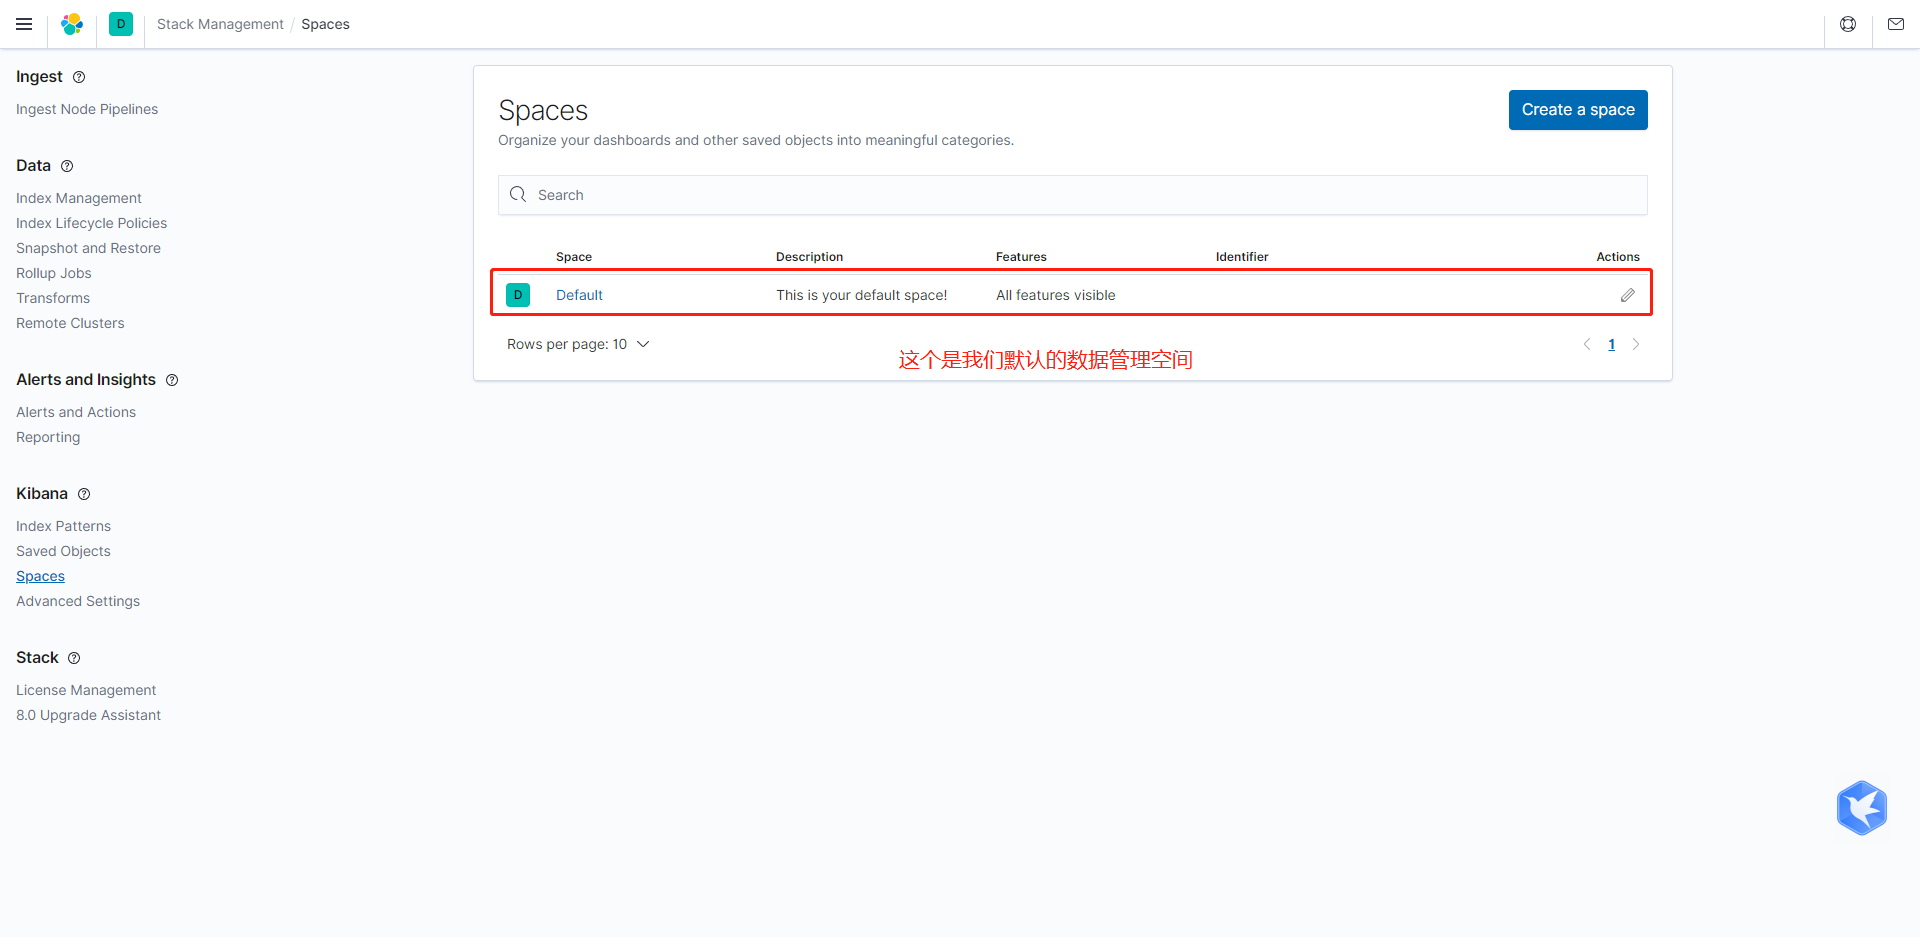
Kibana will not display any logs yet. You must specify an index before you can view the recorded data.
Here you can see that logstash is the index we created (I didn't set the index before, so it defaults to logstash-2022.03.06)
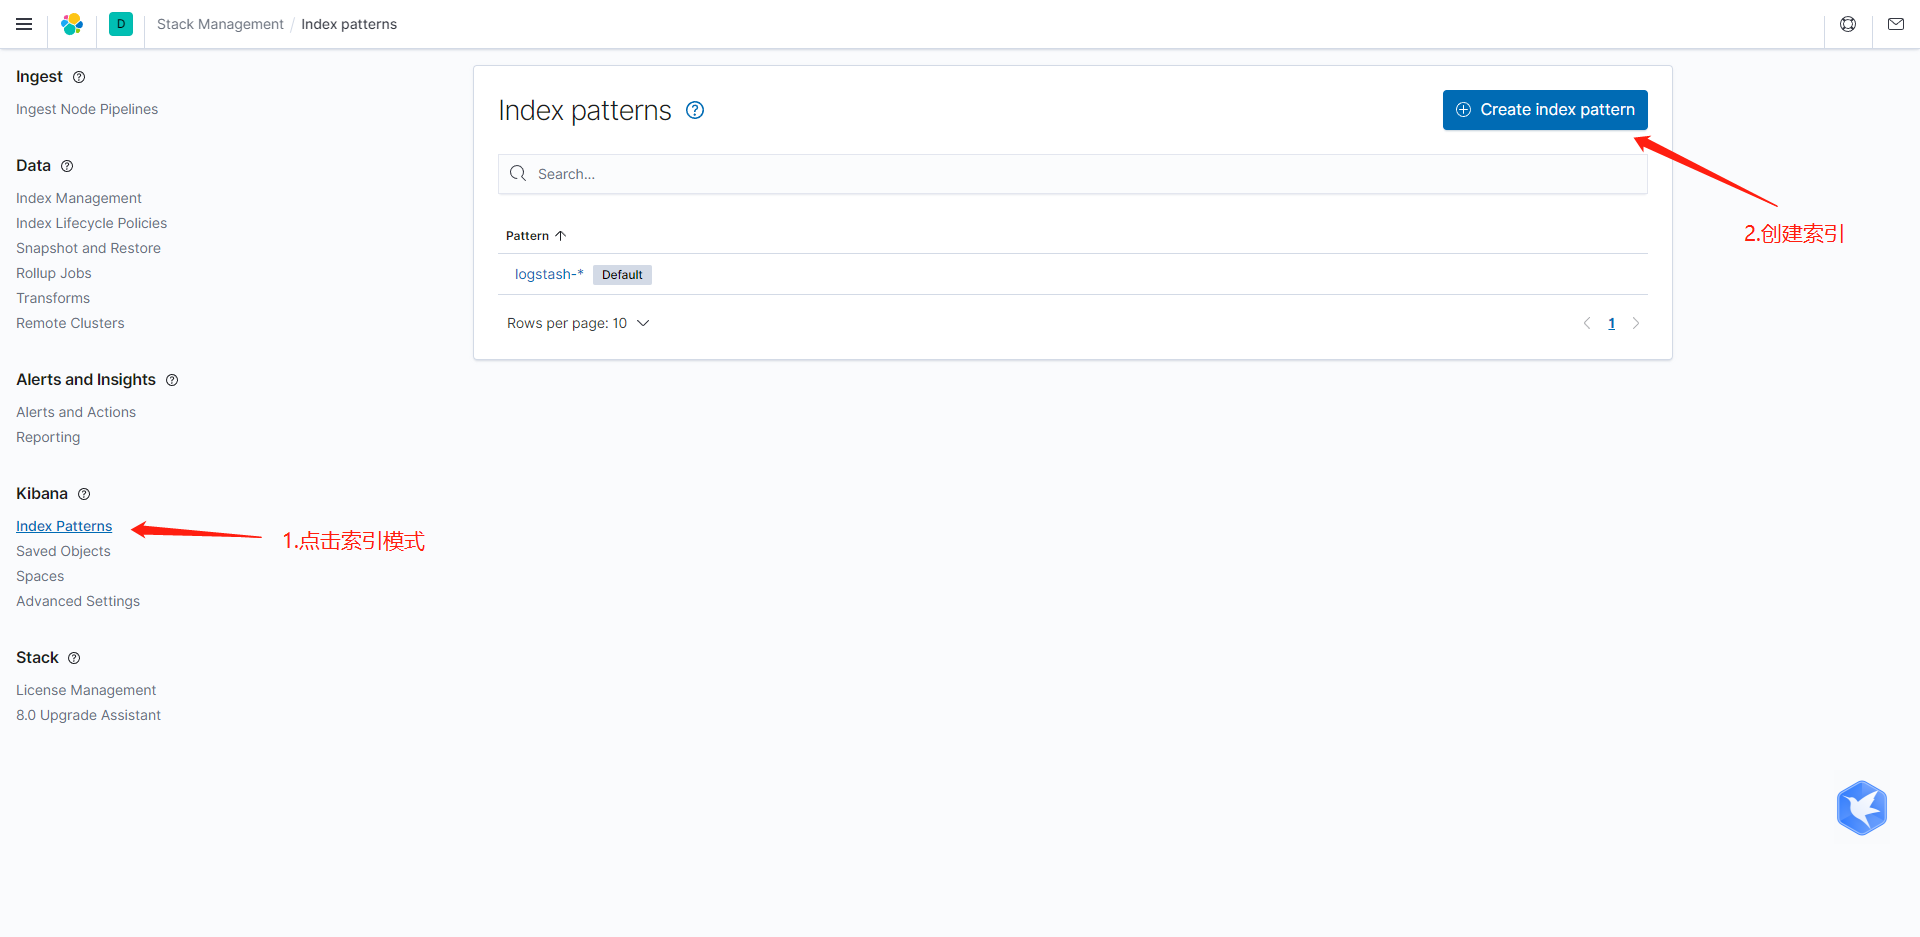
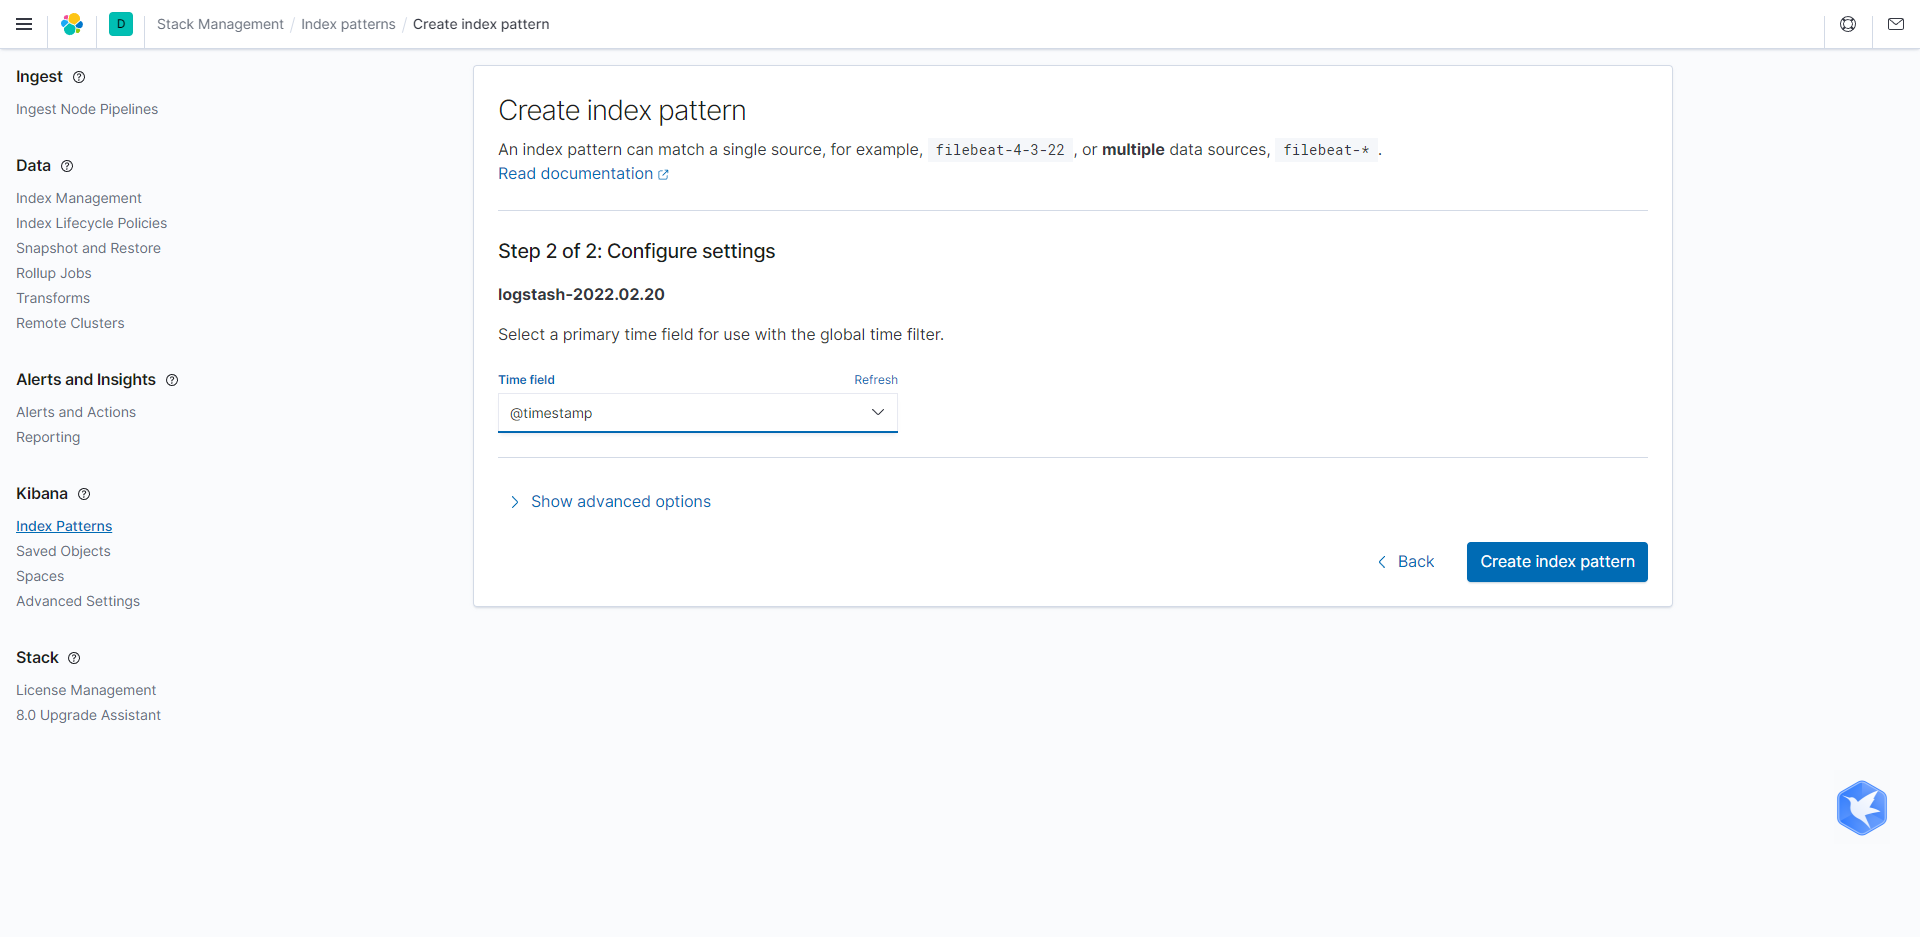
Enter your index mode. It will display the index schema you just created. You can type the entire index or use wildcards.
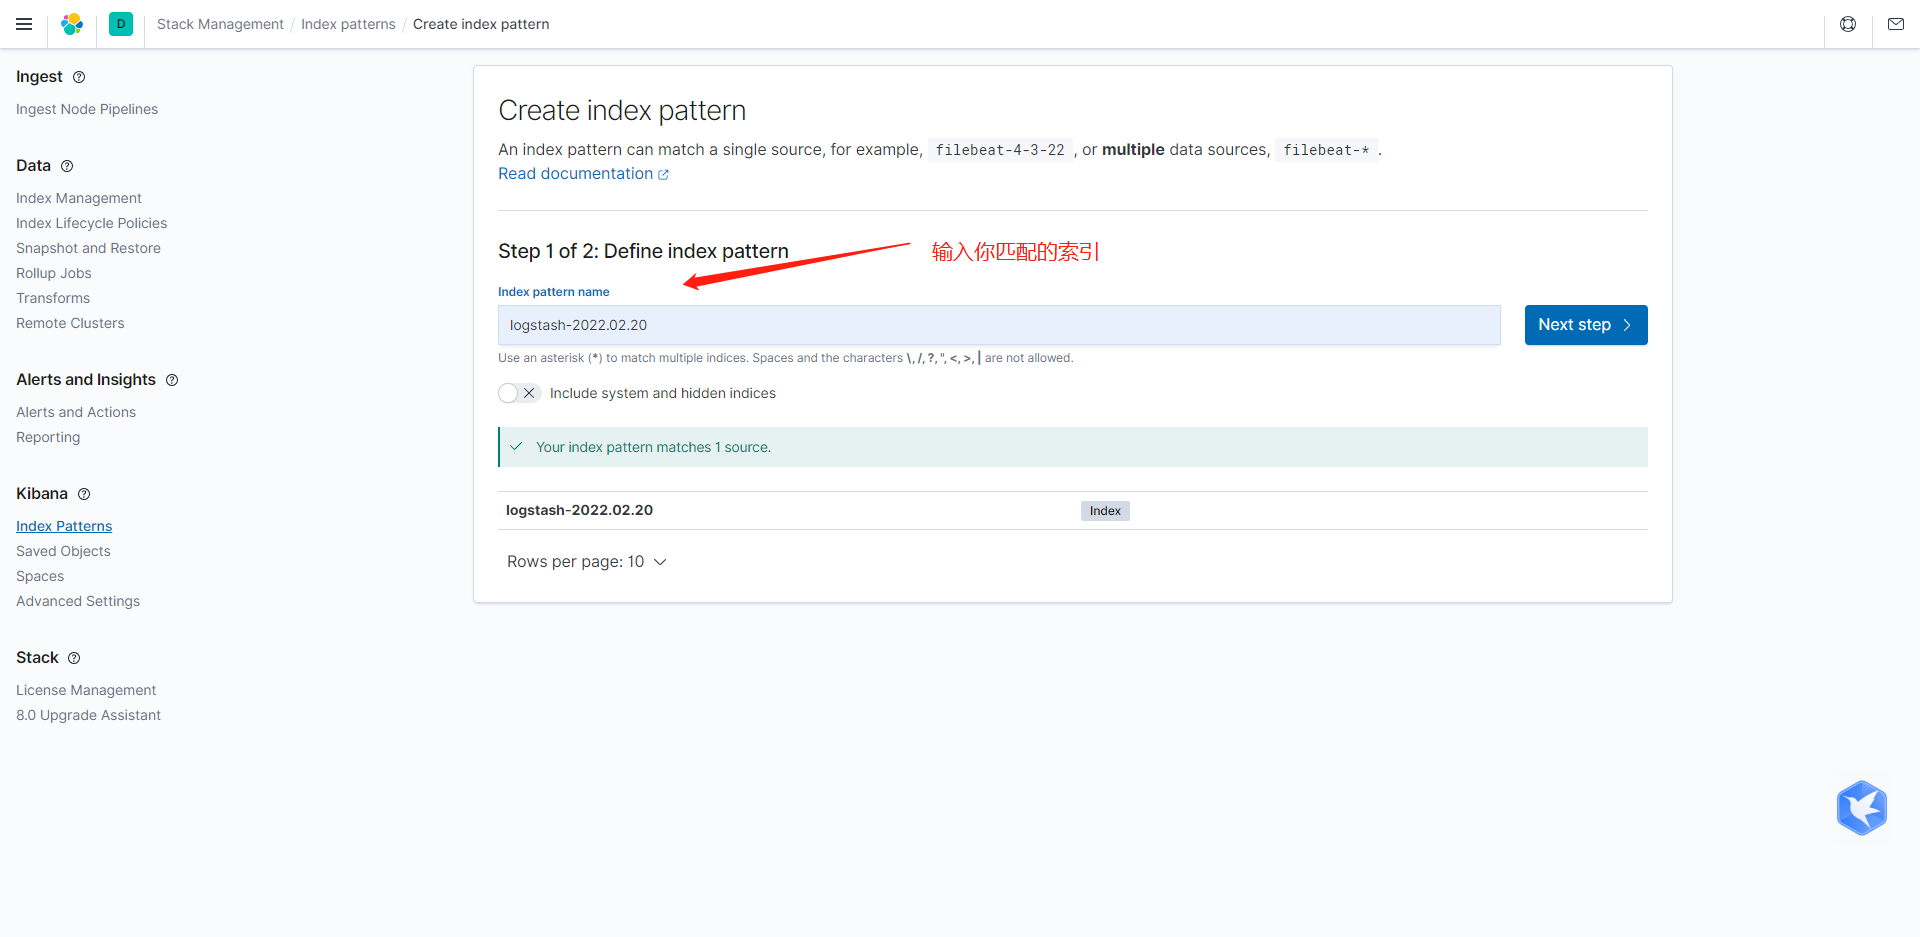
On the next page, select the @ timestamp field as the time filter field name, and then click the create index mode button.
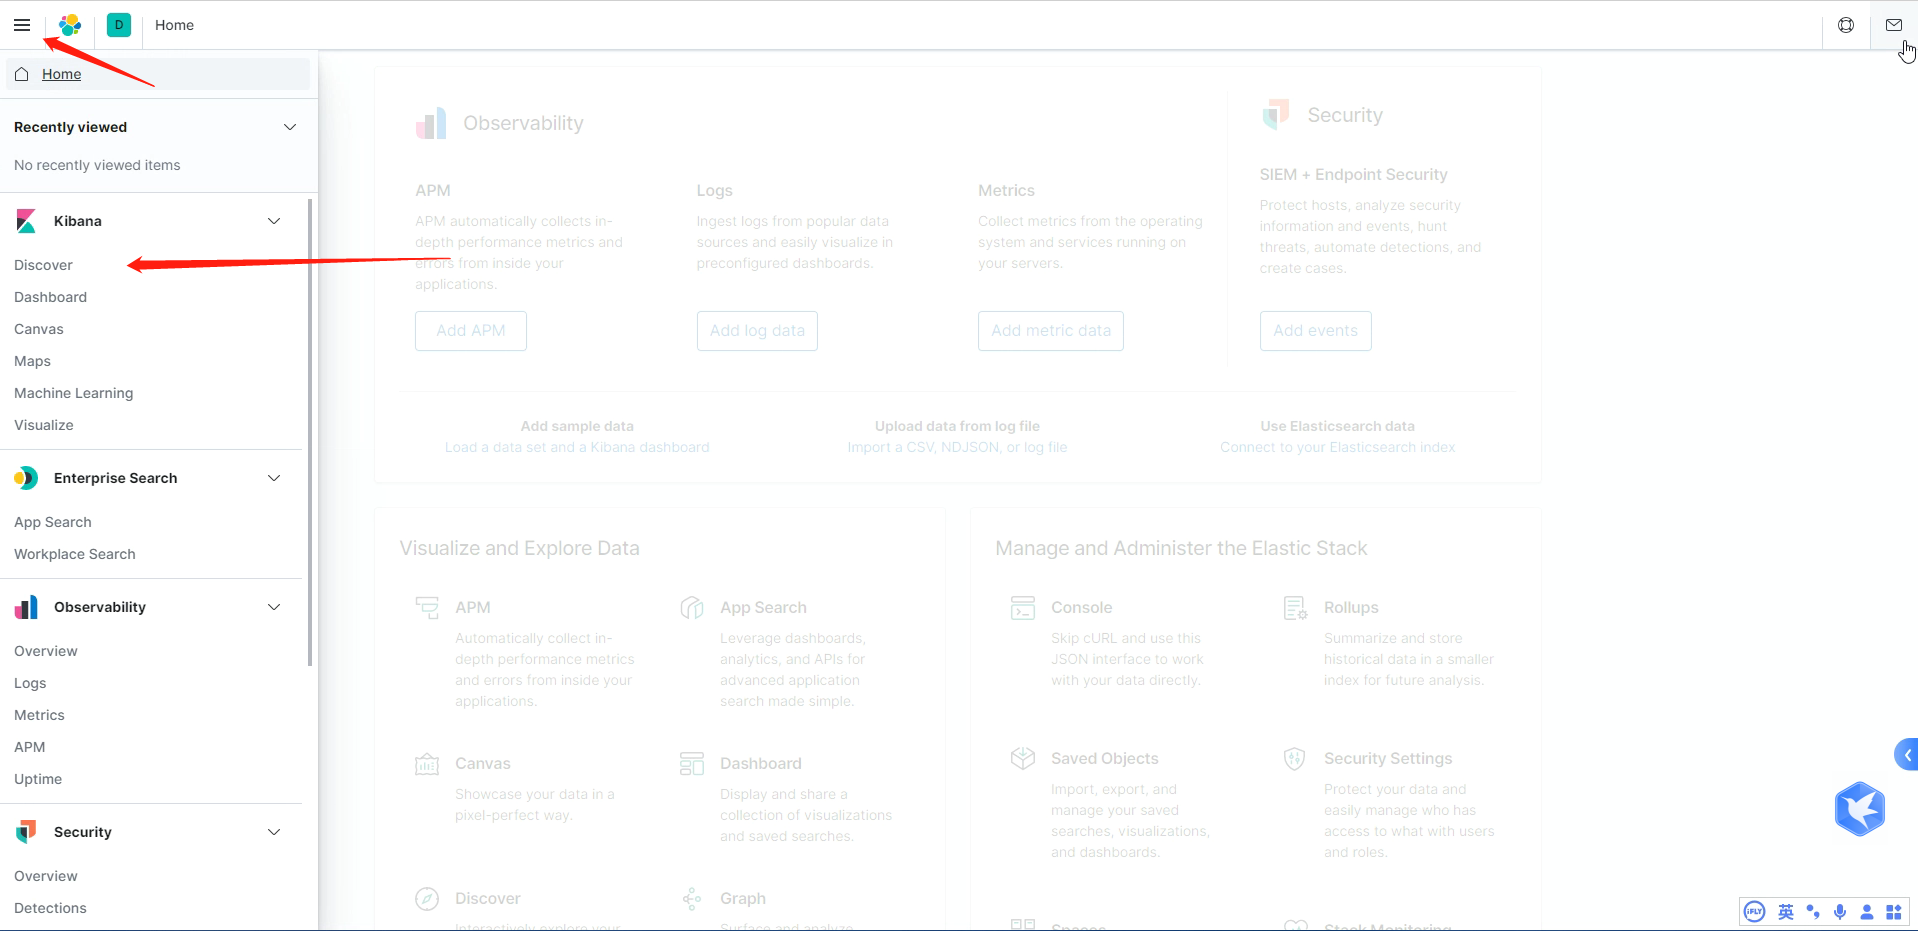
You can now view the log by clicking the Discover link in the navigation pane.
The logs printed in our program will be collected here. I won't demonstrate how to write the log code here. (I peed in the bathroom just now)

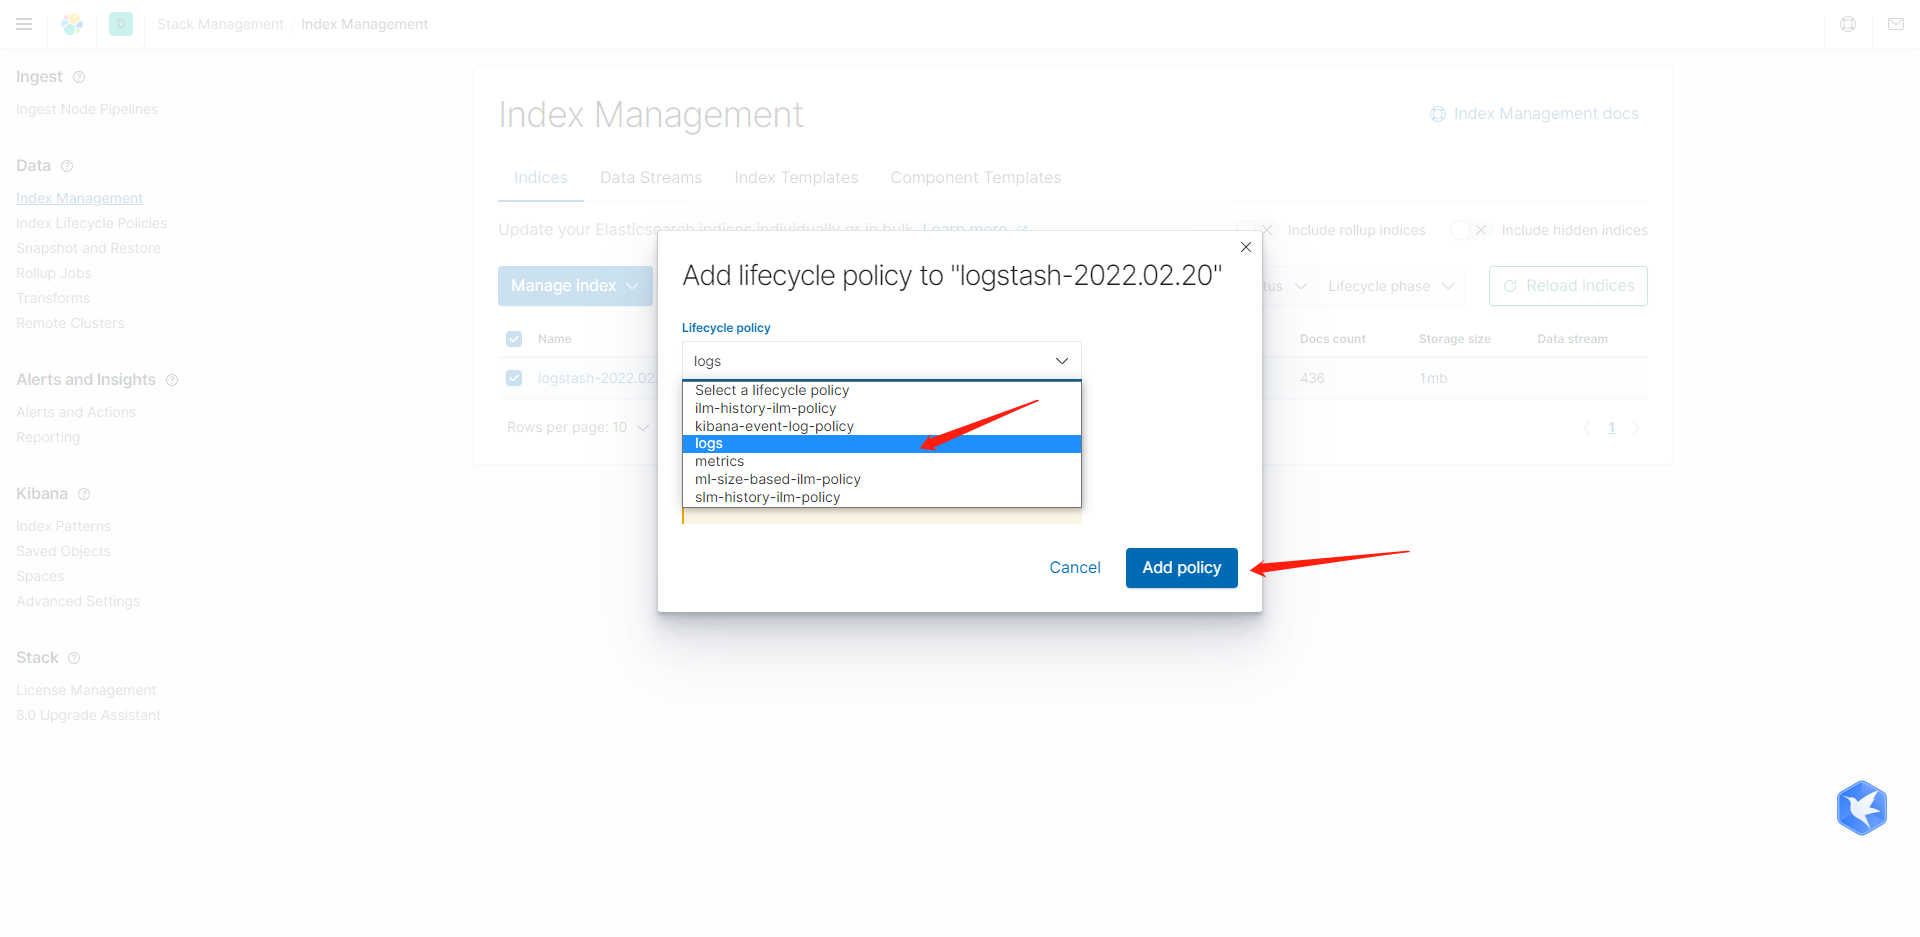
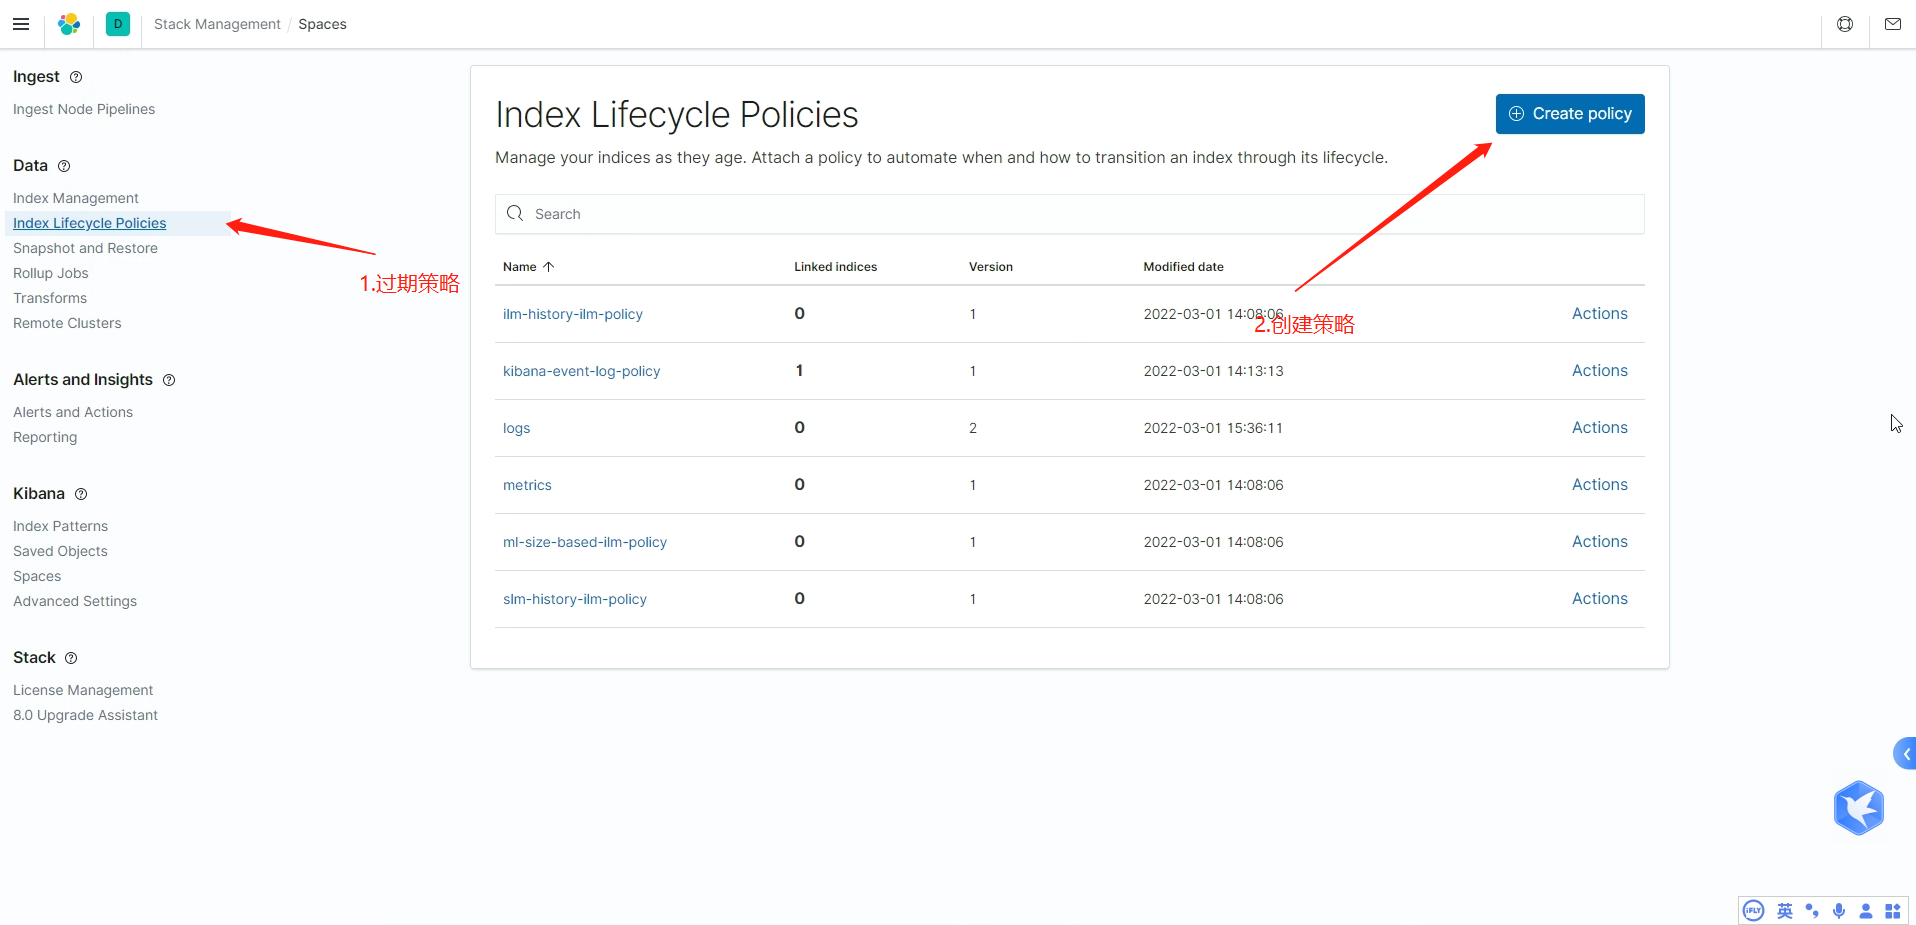
Configure log expiration policy
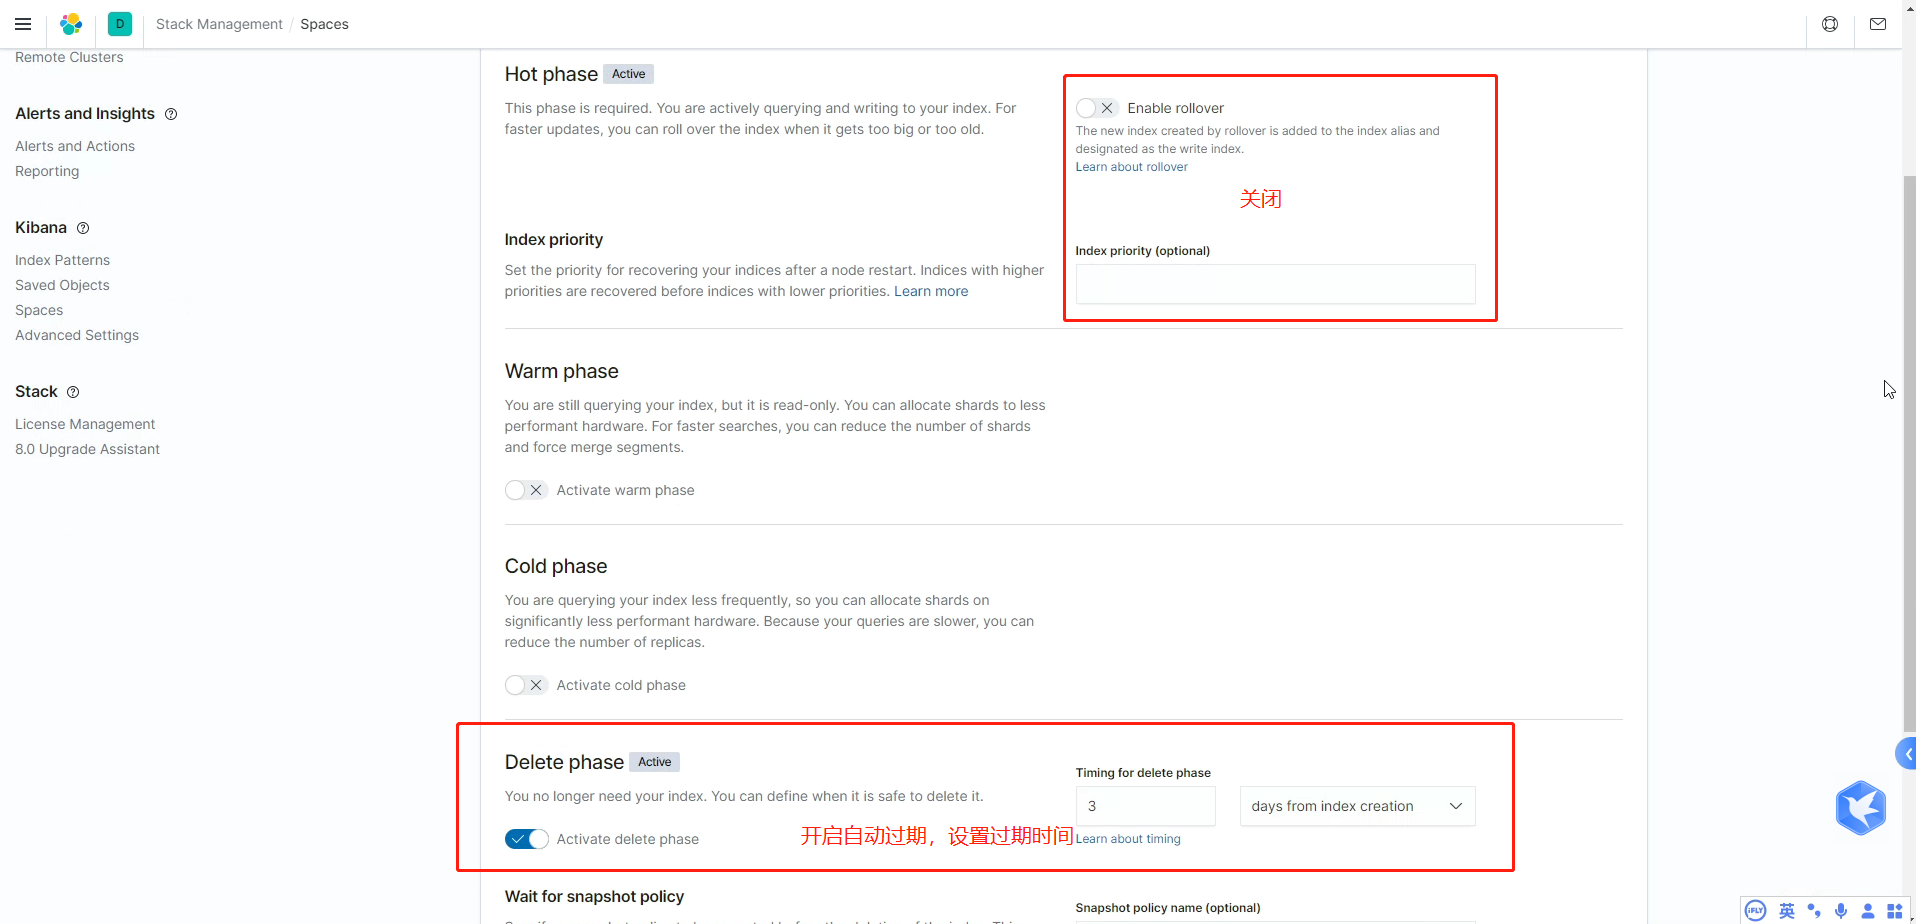
Because our log information generally does not need to be retained for a long time. (generally, it's enough to save for about 3 days, and the expired logs will be cleared automatically, which can also reduce the consumption of log memory)
- Remember to turn off the rolling update in the hot phase
- Start the delete phase, set the expiration time, and the snapshot can not be used
Association index policy mode
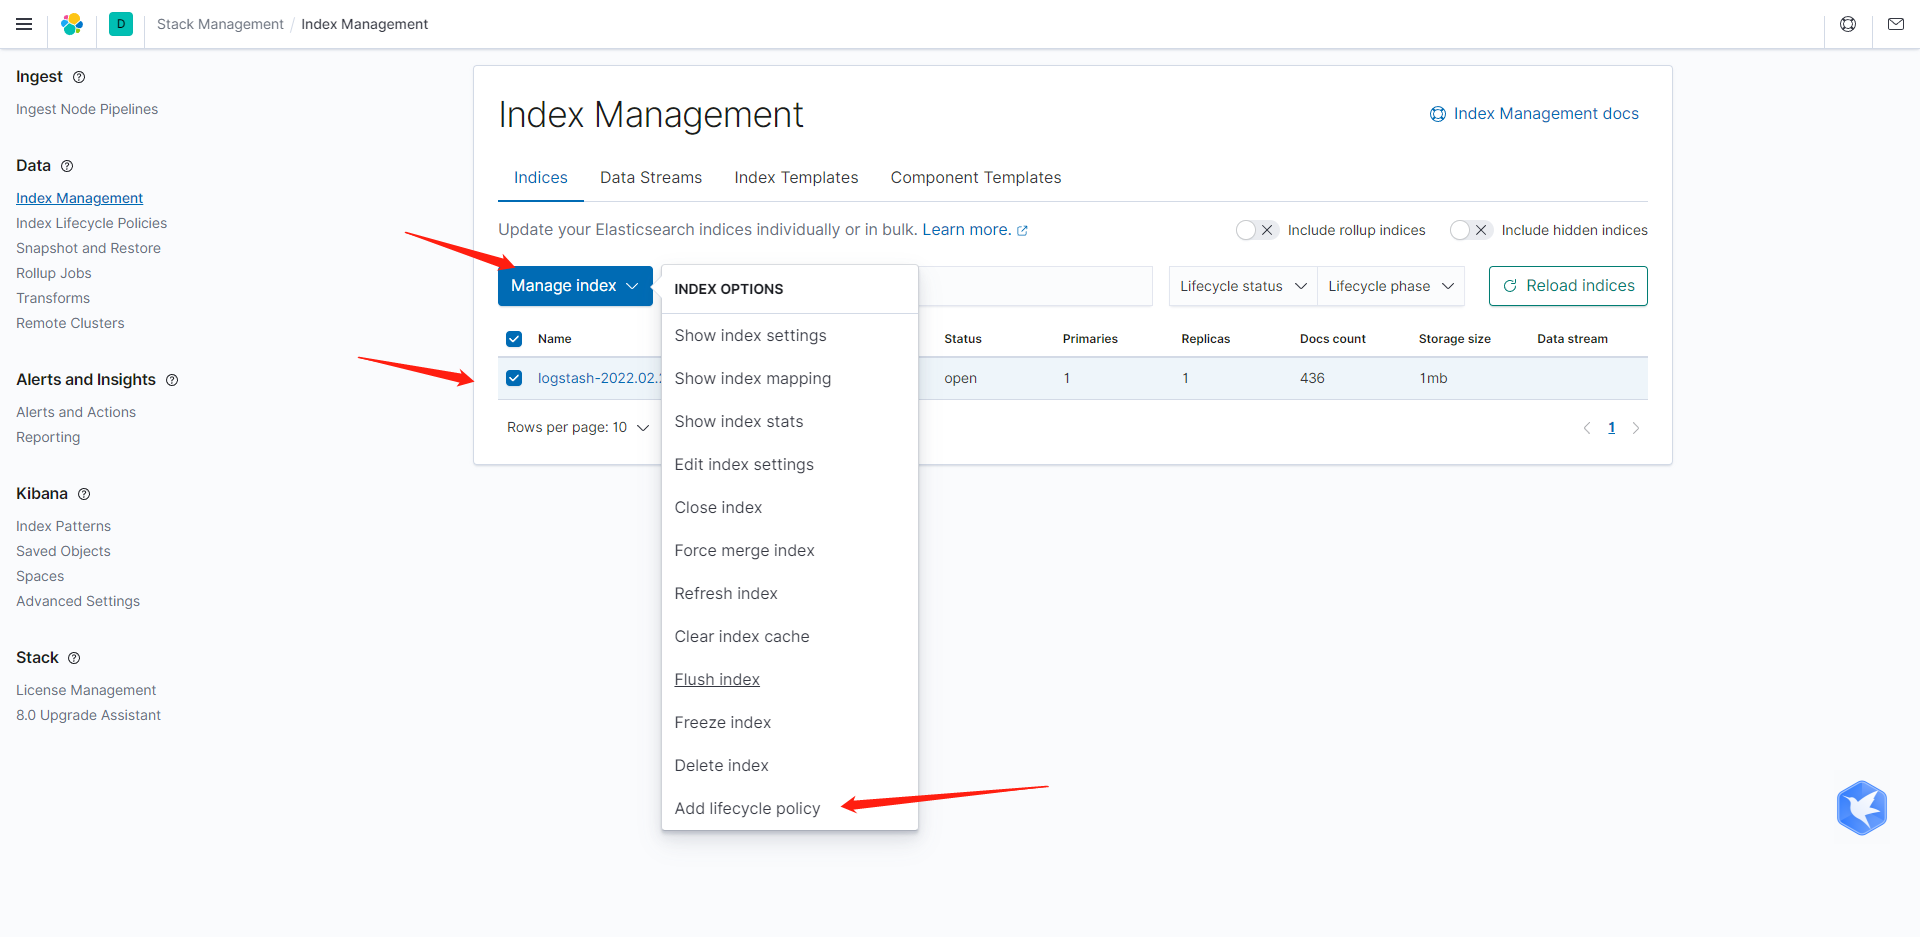
Select the policy module we just set to associate. (in this way, our logs will be automatically released)