Machine learning project practical series} housing price forecast
catalogue
Machine learning project practical series} housing price forecast
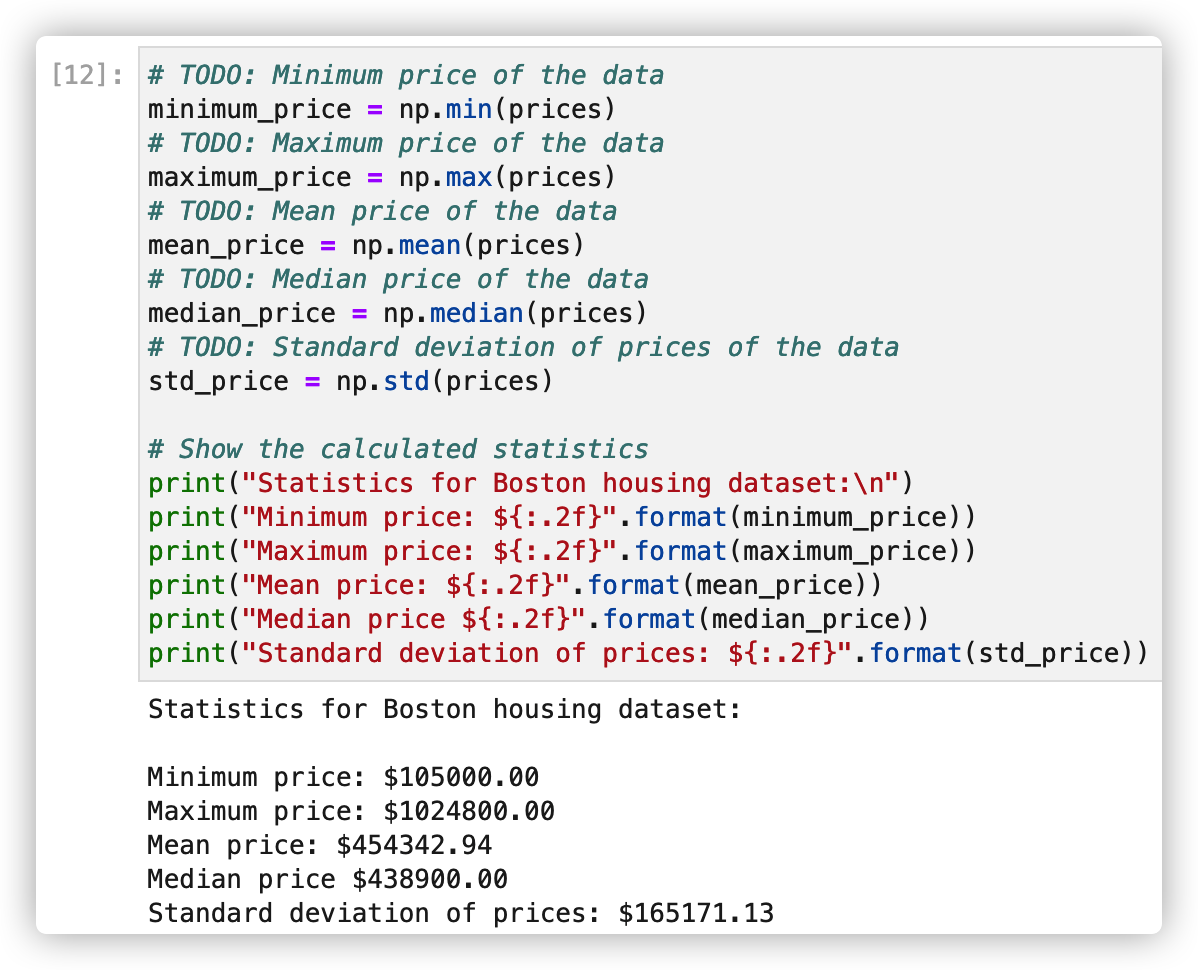
2. Basic statistical operation
1, Overview
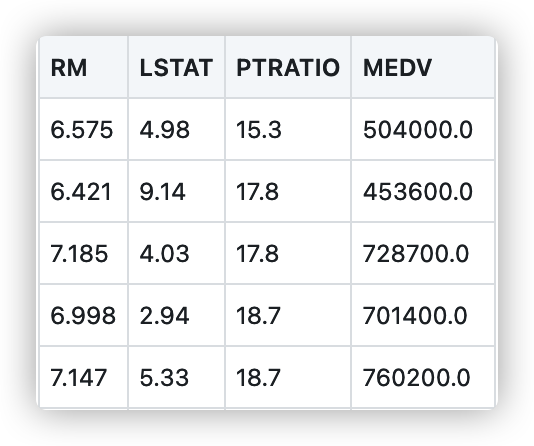
The data set includes house prices in the rest of Boston, and the cost of houses varies according to various factors such as crime rate and number of rooms.
House price forecast data set https://www.cs.toronto.edu/~delve/data/boston/bostonDetail.html
CRIM "numeric" per capita crime rate
ZN "numeric" proportion of residential land exceeding 2W5 square feet
Proportion of commercial land for non retail industry in INDUS "numeric" City
Does the CHAS "integer" Charles River flow through
NOX "numeric" carbon monoxide concentration
RM "numeric" average number of rooms per residence
AGE "numeric" proportion of self owned houses built before 1940
Weighted average distance from DIS "numeric" to five central areas of Boston
RAD "integer" accessibility index to Expressway
TAX "numeric" full value property TAX rate per US $1W
PIRATIO "numeric" teacher-student ratio
B "numeric" BK is the proportion of blacks. The closer it is to 0.63, the smaller it is. B=1000 * (BK-0.63) ^ 2
LSTAT "numeric" proportion of low-income population
The average house price of MEDV "numeric" owner occupied house is (1W USD)
2, Analysis data
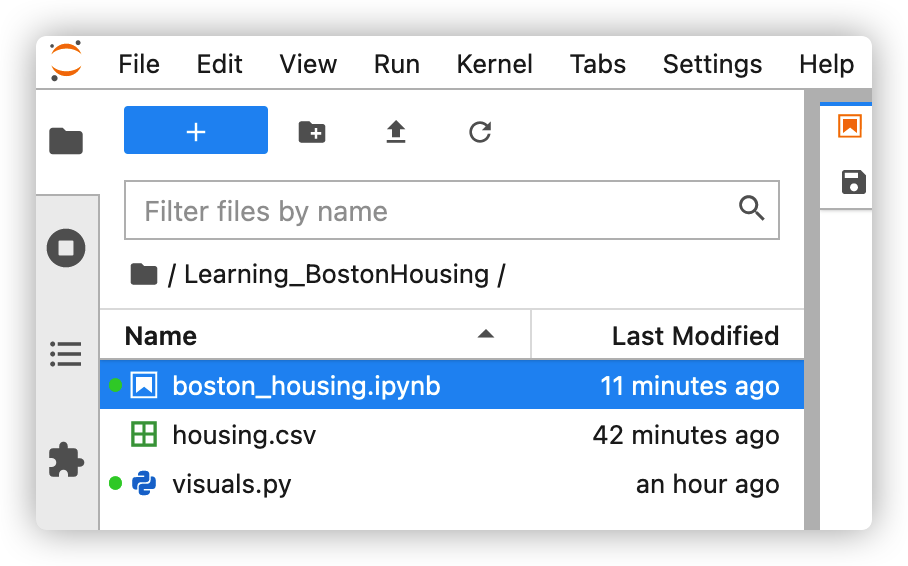
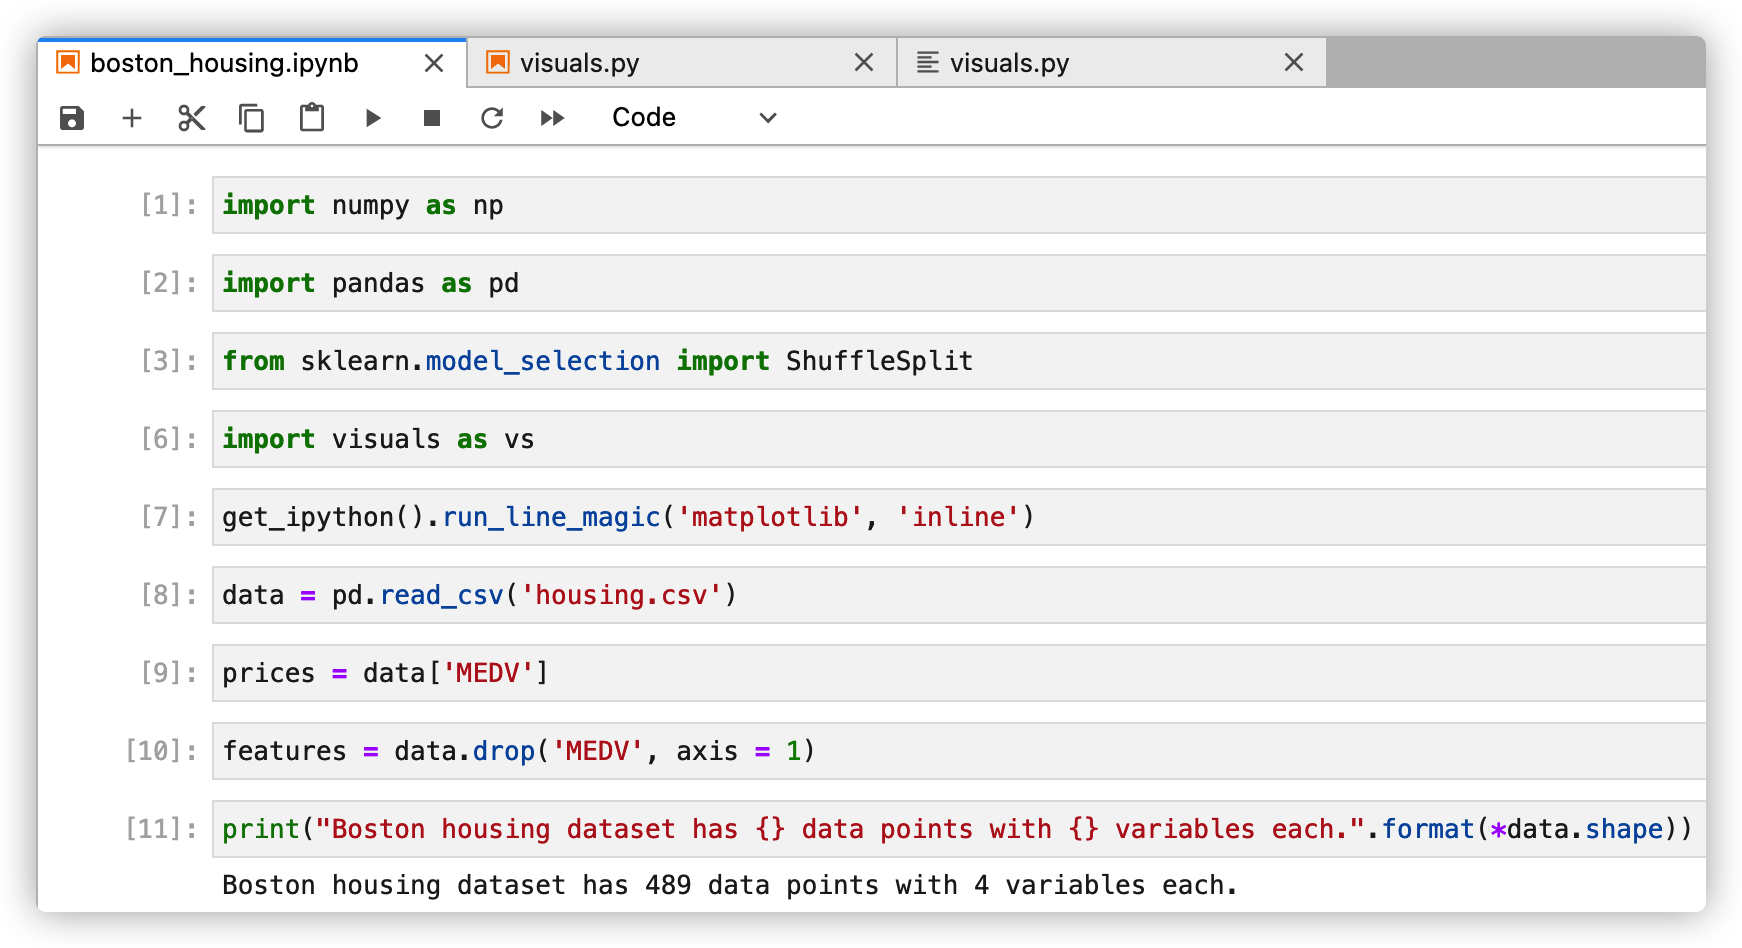
1. Data import
2. Basic statistical operation
3. Characteristic Observation
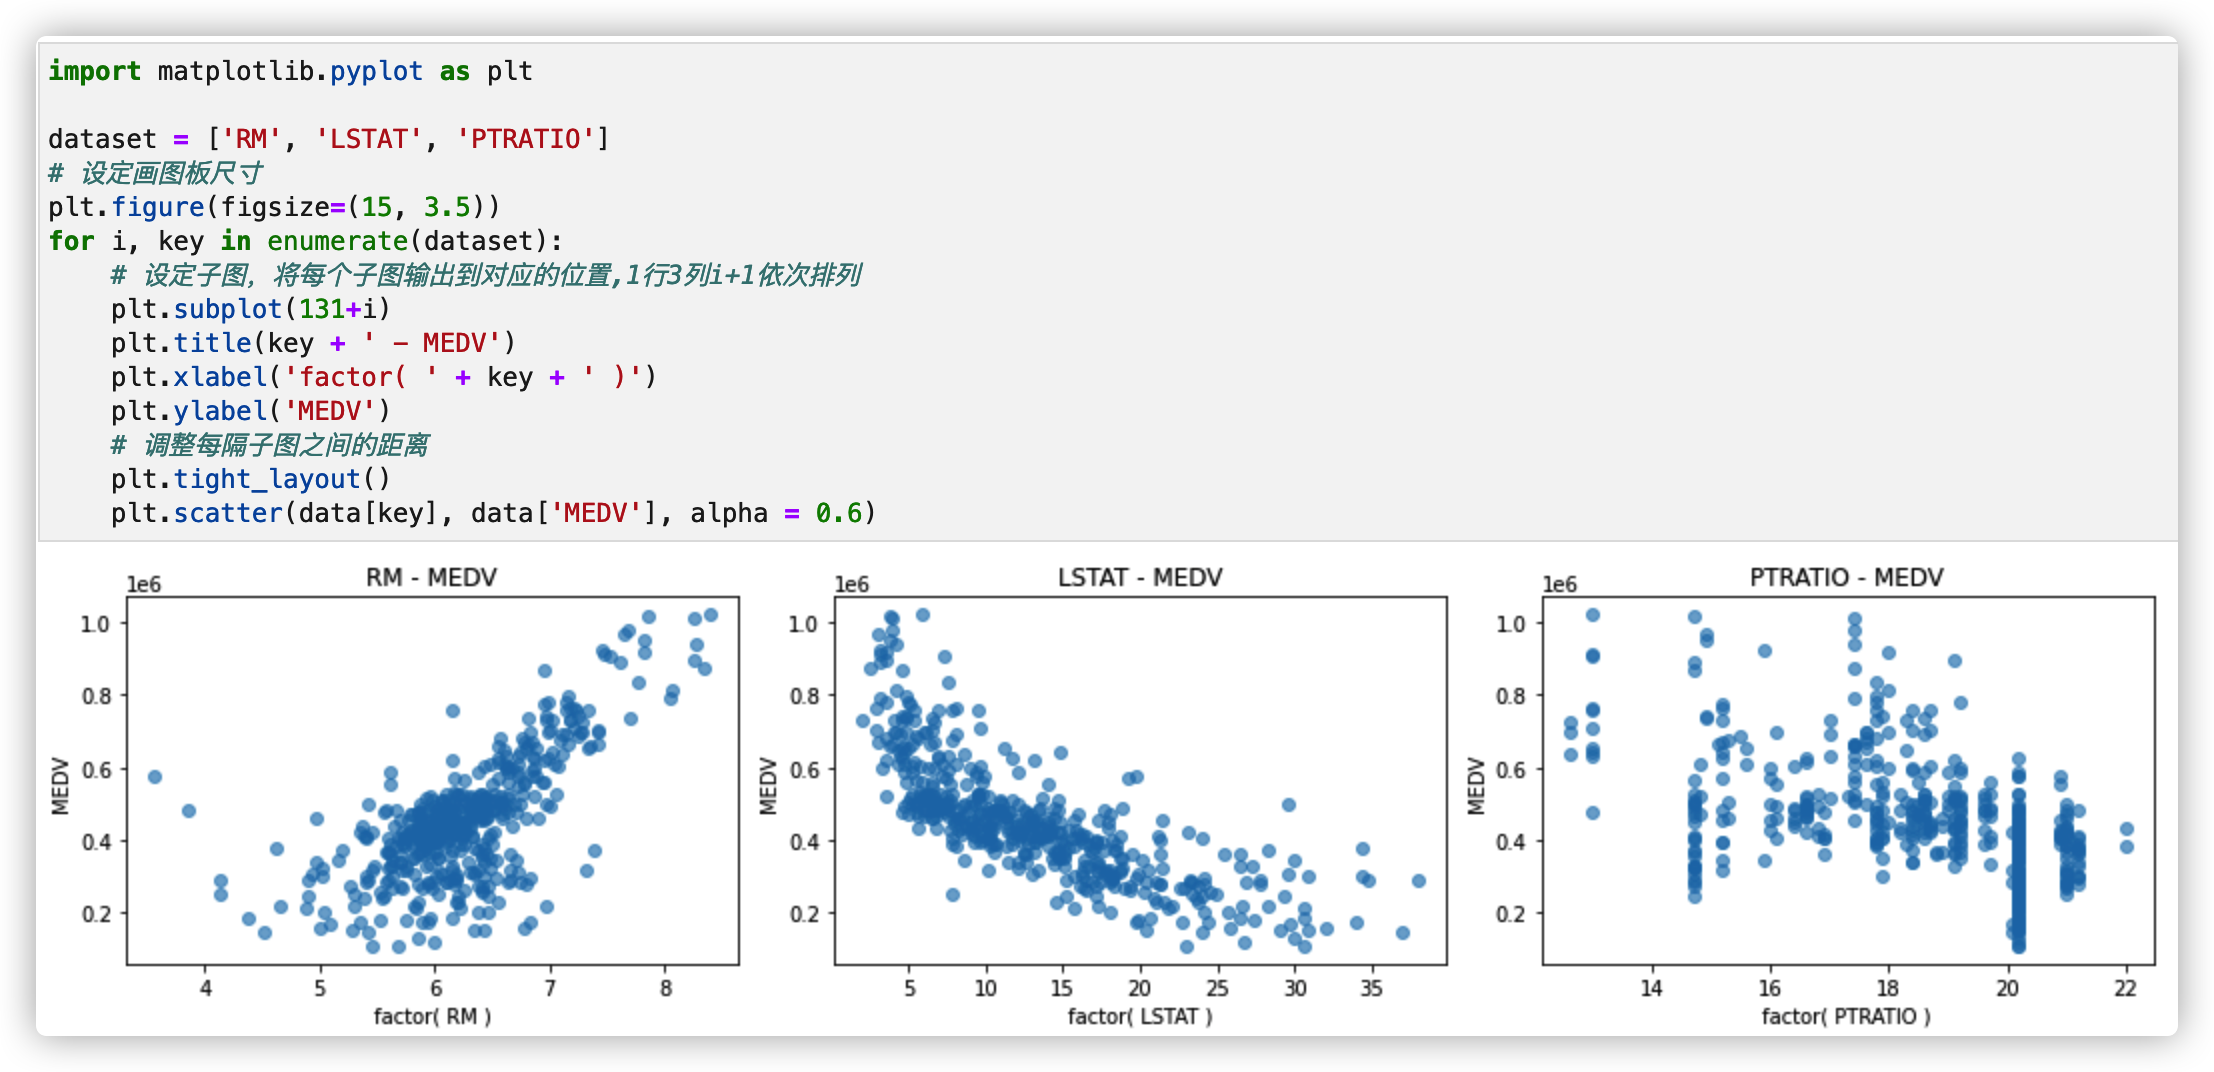
- RM is the average number of rooms per house in the area
- LSTAT refers to the percentage of owners in the area who belong to the low-income class (with jobs but low income)
- PTRATIO is the ratio of the number of students to teachers (students / teachers) in secondary and primary schools in the region
4. Establish model
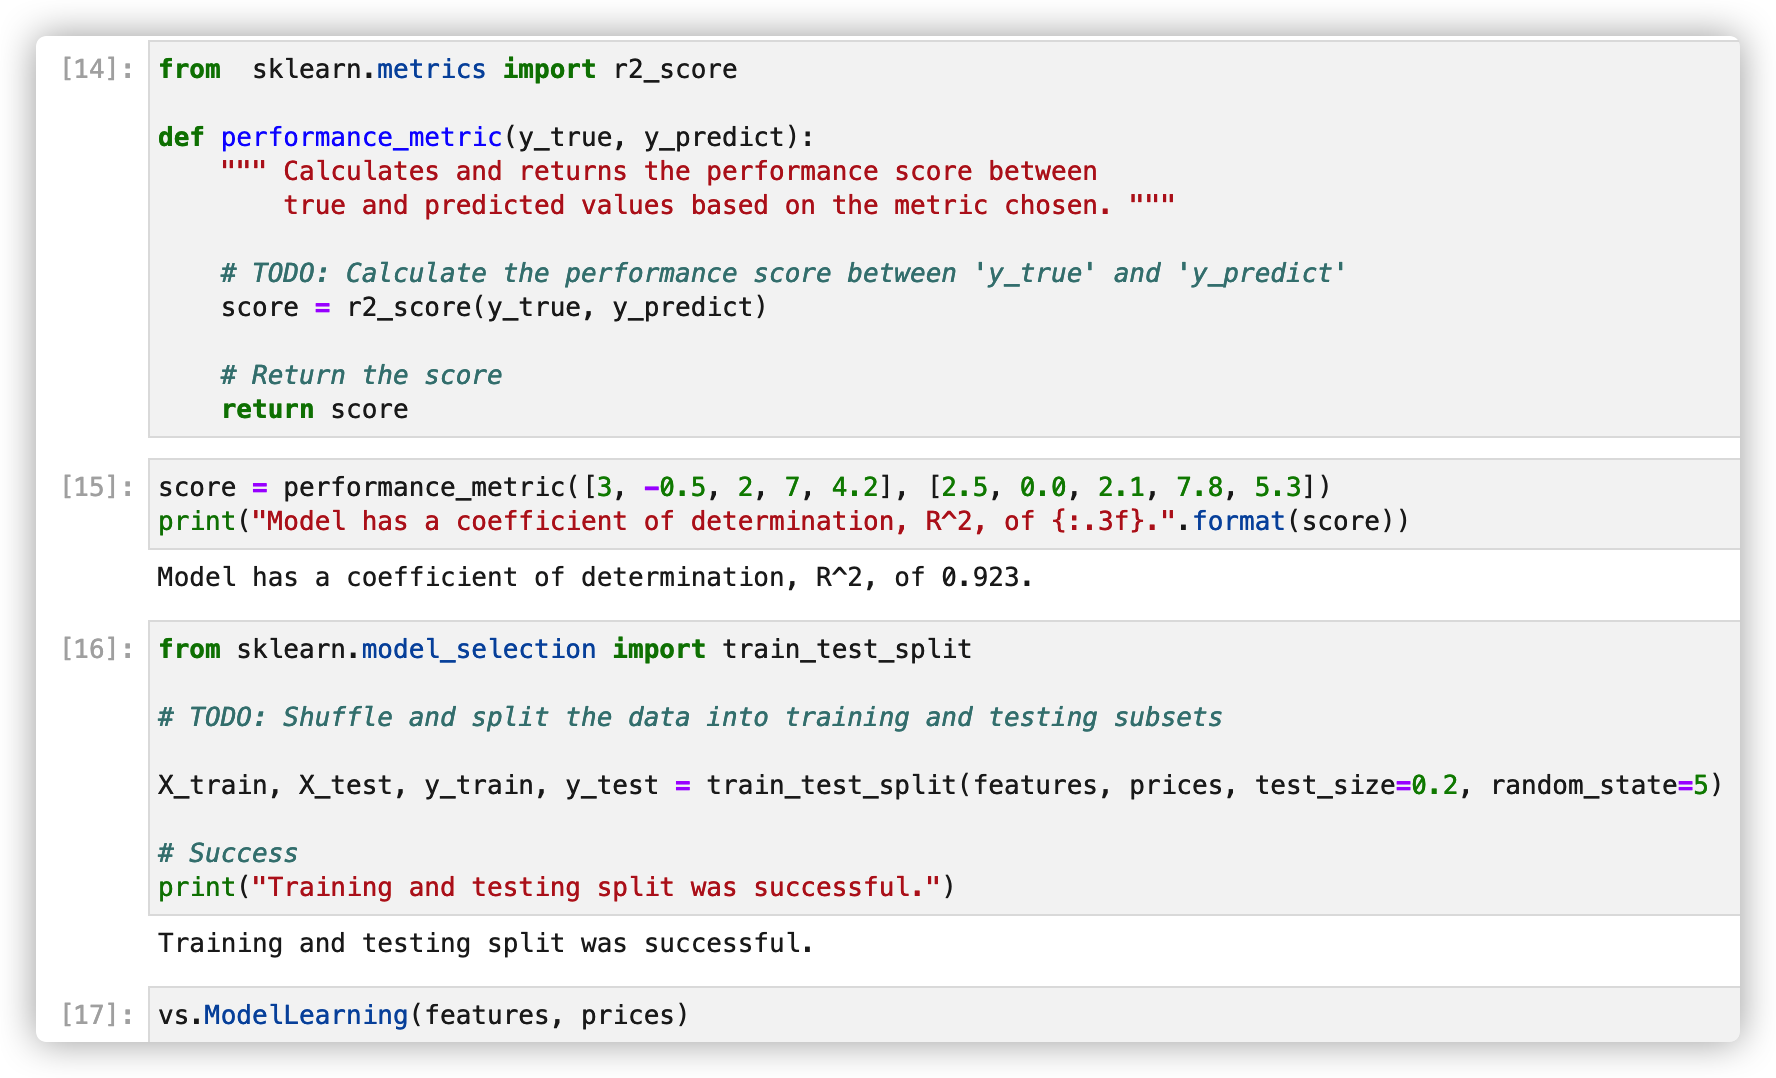
5. Analyze model performance
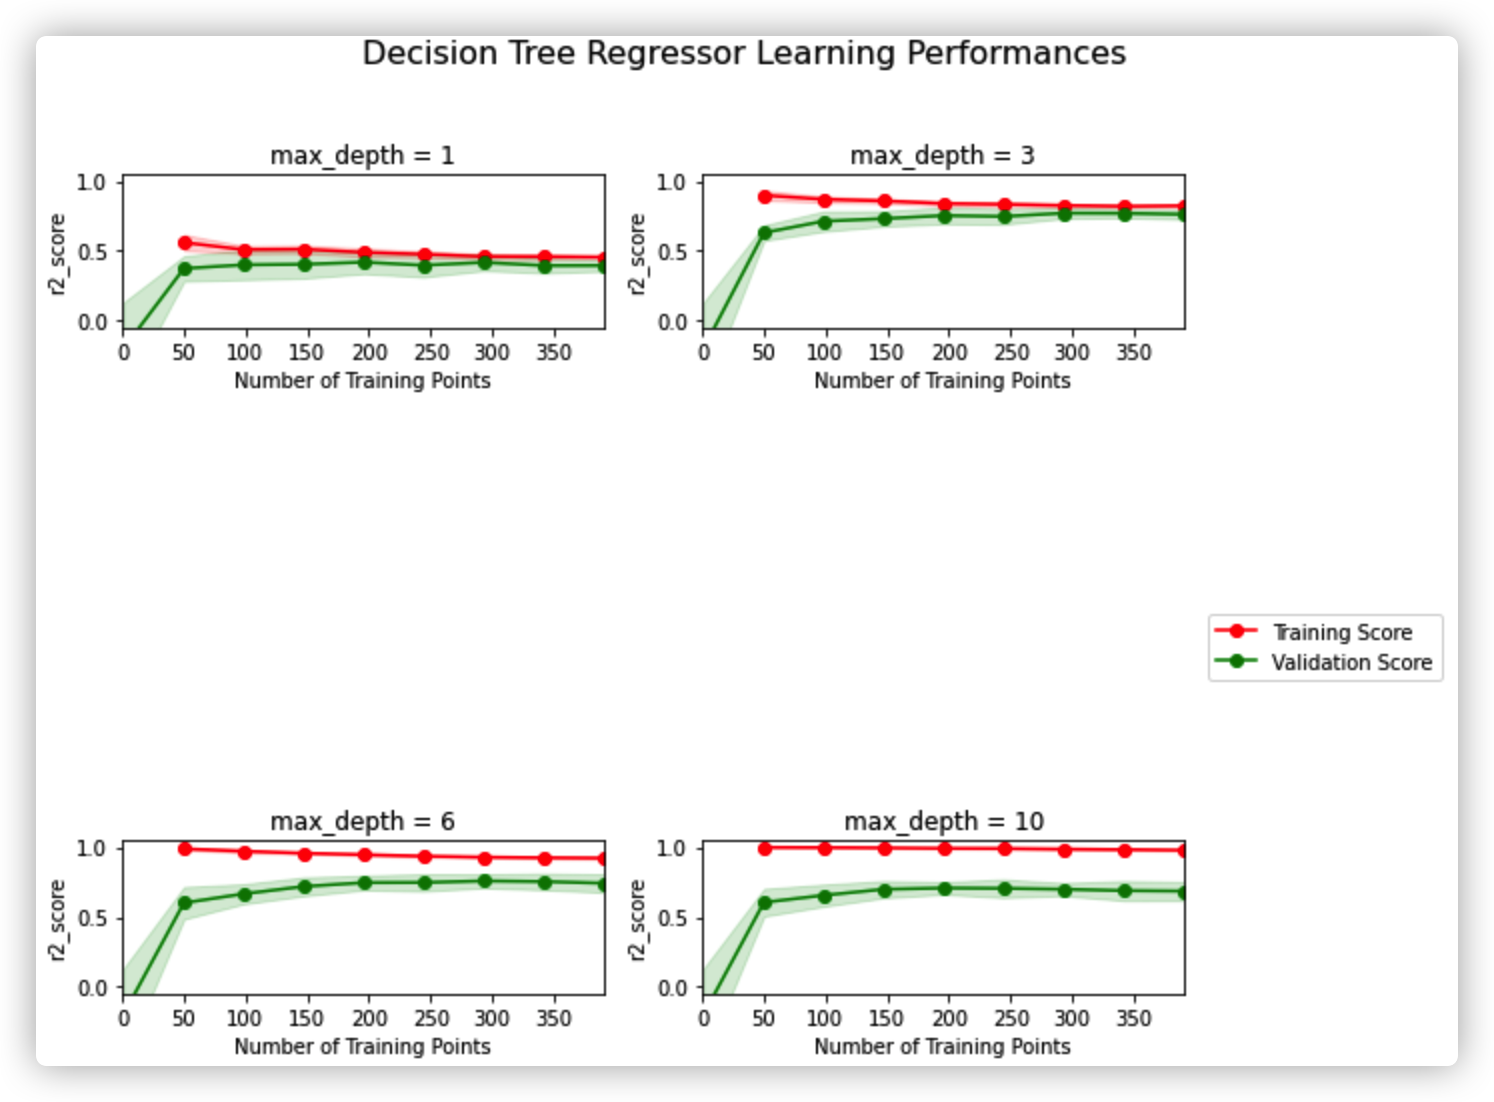
(1) Learning curve
vs.ModelLearning(features, prices)
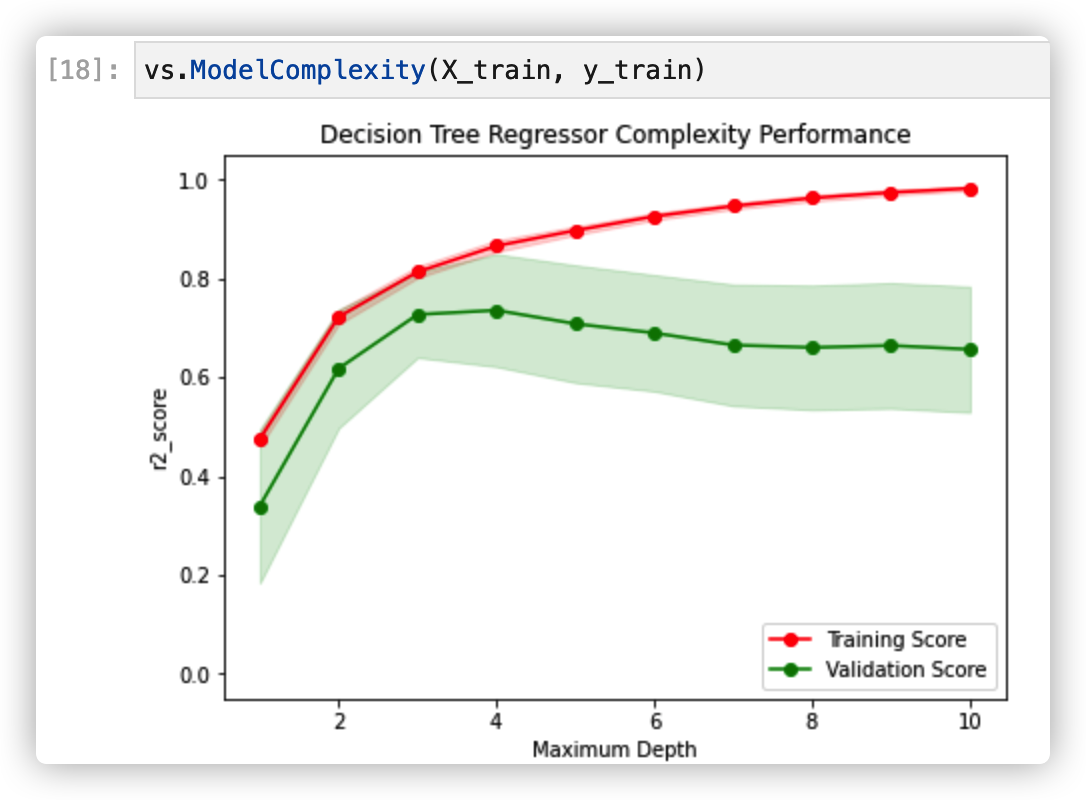
(2) Complexity curve
6. Fitting model
from sklearn.tree import DecisionTreeRegressor
from sklearn.metrics import make_scorer
from sklearn.model_selection import GridSearchCV

def fit_model(X, y):
    """ Performs grid search over the 'max_depth' parameter for a
        decision tree regressor trained on the input data [X, y]. """

    # Create cross-validation sets from the training data
    # sklearn version 0.18: ShuffleSplit(n_splits=10, test_size=0.1, train_size=None, random_state=None)
    # sklearn versiin 0.17: ShuffleSplit(n, n_iter=10, test_size=0.1, train_size=None, random_state=None)
    cv_sets = ShuffleSplit(n_splits=10, test_size=0.20, random_state=42)

    # TODO: Create a decision tree regressor object
    regressor = DecisionTreeRegressor()

    # TODO: Create a dictionary for the parameter 'max_depth' with a range from 1 to 10
    params = {'max_depth': range(1,11)}

    # TODO: Transform 'performance_metric' into a scoring function using 'make_scorer'
    scoring_fnc = make_scorer(performance_metric)

    # TODO: Create the grid search cv object --> GridSearchCV()
    # Make sure to include the right parameters in the object:
    # (estimator, param_grid, scoring, cv) which have values 'regressor', 'params', 'scoring_fnc', and 'cv_sets' respectively.
    grid = GridSearchCV(regressor, params, scoring=scoring_fnc, cv=cv_sets)

    # Fit the grid search object to the data to compute the optimal model
    grid = grid.fit(X, y)

    # Return the optimal model after fitting the data
    return grid.best_estimator_
What is the optimal depth of the fitting model
7. Forecast sales price

