Introduction to Exporter
What is an Exporter
Broadly speaking, all programs that can provide monitoring sample data to Prometheus can be called an Exporter. An instance of the Exporter is called target. As shown below, Prometheus periodically obtains sample data from these targets by polling

Source of Exporter
In terms of the source of exporters, they are mainly divided into two categories:
- Community provided
Prometheus community provides rich Exporter implementations, covering monitoring functions from infrastructure, middleware, network and other aspects. These exporters can meet most common monitoring requirements. - User defined
In addition to directly using the Exporter program provided by the community, users can also create their own Exporter program based on the Client Library provided by Prometheus. At present, promhues community officially provides support for the following programming languages: Go, Java/Scala, Python and Ruby. There are also third-party implementations, such as Bash, C + +, Common Lisp, Erlang, hasheel, Lua, and node JS, PHP, Rust, etc.
How the Exporter works
In terms of the operation mode of Exporter, it can be divided into:
- Independent use
The operating system itself does not directly support Prometheus, and users cannot directly support Prometheus from the operating system level. Therefore, the user can only convert the operation status data of the system into monitoring data that can be read by Prometheus by running a program independently and through the relevant interfaces provided by the operating system. These exporters act as an intermediary agent. - Integrated into the application
In order to better monitor the internal operation status of the system, some open source projects such as Kubernetes and ETCD directly use Prometheus Client Library in the code to provide direct support for Prometheus. This method breaks the boundary of monitoring, so that the application can directly expose the internal running state to Prometheus, which is suitable for some projects that need more customized monitoring indicators.
Common Exporter
Delivery Kube state metric
The exporter that collects k8s resource data for prometheus can collect relevant data of most k8s built-in resources, such as pod, deploy, service, etc. At the same time, it also provides its own data, mainly statistics on the number of resource collection and the number of exceptions
Official website https://quay.io/repository/coreos/kube-state-metrics?tab=tags
[root@node7-200 ~]# docker pull quay.io/coreos/kube-state-metrics:v1.5.0
[root@node7-200 ~]# docker images|grep kube-state
[root@node7-200 ~]# docker tag 91599517197a harbor.od.com/public/kube-state-metrics:v1.5.0
[root@node7-200 ~]# docker push harbor.od.com/public/kube-state-metrics:v1.5.0
[root@node7-200 ~]# mkdir /data/k8s-yaml/kube-state-metrics
[root@node7-200 ~]# cd /data/k8s-yaml/kube-state-metrics
[root@node7-200 kube-state-metrics]# vi rbac.yaml
apiVersion: v1
kind: ServiceAccount
metadata:
  labels:
    addonmanager.kubernetes.io/mode: Reconcile
    kubernetes.io/cluster-service: "true"
  name: kube-state-metrics
  namespace: kube-system
---
apiVersion: rbac.authorization.k8s.io/v1
kind: ClusterRole
metadata:
  labels:
    addonmanager.kubernetes.io/mode: Reconcile
    kubernetes.io/cluster-service: "true"
  name: kube-state-metrics
rules:
- apiGroups:
  - ""
  resources:
  - configmaps
  - secrets
  - nodes
  - pods
  - services
  - resourcequotas
  - replicationcontrollers
  - limitranges
  - persistentvolumeclaims
  - persistentvolumes
  - namespaces
  - endpoints
  verbs:
  - list
  - watch
- apiGroups:
  - policy
  resources:
  - poddisruptionbudgets
  verbs:
  - list
  - watch
- apiGroups:
  - extensions
  resources:
  - daemonsets
  - deployments
  - replicasets
  verbs:
  - list
  - watch
- apiGroups:
  - apps
  resources:
  - statefulsets
  verbs:
  - list
  - watch
- apiGroups:
  - batch
  resources:
  - cronjobs
  - jobs
  verbs:
  - list
  - watch
- apiGroups:
  - autoscaling
  resources:
  - horizontalpodautoscalers
  verbs:
  - list
  - watch
---
apiVersion: rbac.authorization.k8s.io/v1
kind: ClusterRoleBinding
metadata:
  labels:
    addonmanager.kubernetes.io/mode: Reconcile
    kubernetes.io/cluster-service: "true"
  name: kube-state-metrics
roleRef:
  apiGroup: rbac.authorization.k8s.io
  kind: ClusterRole
  name: kube-state-metrics
subjects:
- kind: ServiceAccount
  name: kube-state-metrics
  namespace: kube-system
[root@node7-200 kube-state-metrics]# vi dp.yaml
apiVersion: extensions/v1beta1
kind: Deployment
metadata:
  annotations:
    deployment.kubernetes.io/revision: "2"
  labels:
    grafanak8sapp: "true"
    app: kube-state-metrics
  name: kube-state-metrics
  namespace: kube-system
spec:
  selector:
    matchLabels:
      grafanak8sapp: "true"
      app: kube-state-metrics
  strategy:
    rollingUpdate:
      maxSurge: 25%
      maxUnavailable: 25%
    type: RollingUpdate
  template:
    metadata:
      labels:
        grafanak8sapp: "true"
        app: kube-state-metrics
    spec:
      containers:
      - name: kube-state-metrics
        image: harbor.od.com/public/kube-state-metrics:v1.5.0
        imagePullPolicy: IfNotPresent
        ports:
        - containerPort: 8080
          name: http-metrics
          protocol: TCP
        readinessProbe:
          failureThreshold: 3
          httpGet:
            path: /healthz
            port: 8080
            scheme: HTTP
          initialDelaySeconds: 5
          periodSeconds: 10
          successThreshold: 1
          timeoutSeconds: 5
      serviceAccountName: kube-state-metrics
[root@node7-21 ~]# kubectl apply -f http://k8s-yaml.od.com/kube-state-metrics/rbac.yaml
[root@node7-21 ~]# kubectl apply -f http://k8s-yaml.od.com/kube-state-metrics/dp.yaml
[root@node7-21 ~]# kubectl get pods -n kube-system -o wide | grep metrics
kube-state-metrics-8669f776c6-hntnr 1/1 Running 0 2m50s 172.7.21.6 node7-21.host.com <none> <none>
Deliver node exporter
In order to collect the operation indicators of the host, such as CPU, memory, disk and other information. We can use the Node Exporter.
[root@node7-200 ~]# docker pull prom/node-exporter:v0.15.0
[root@node7-200 ~]# docker images|grep node-exporter
prom/node-exporter v0.15.0 12d51ffa2b22 3 years ago 22.8MB
[root@node7-200 ~]# docker tag 12d51ffa2b22 harbor.od.com/public/node-exporter:v0.15.0
[root@node7-200 ~]# docker push harbor.od.com/public/node-exporter:v0.15.0
[root@node7-200 ~]# mkdir /data/k8s-yaml/node-exporter/
[root@node7-200 ~]# cd /data/k8s-yaml/node-exporter/
[root@node7-200 node-exporter]# vi ds.yaml
kind: DaemonSet
apiVersion: extensions/v1beta1
metadata:
  name: node-exporter
  namespace: kube-system
  labels:
    daemon: "node-exporter"
    grafanak8sapp: "true"
spec:
  selector:
    matchLabels:
      daemon: "node-exporter"
      grafanak8sapp: "true"
  template:
    metadata:
      name: node-exporter
      labels:
        daemon: "node-exporter"
        grafanak8sapp: "true"
    spec:
      volumes:
      - name: proc
        hostPath:
          path: /proc
          type: ""
      - name: sys
        hostPath:
          path: /sys
          type: ""
      containers:
      - name: node-exporter
        image: harbor.od.com/public/node-exporter:v0.15.0
        imagePullPolicy: IfNotPresent
        args:
        - --path.procfs=/host_proc
        - --path.sysfs=/host_sys
        ports:
        - name: node-exporter
          hostPort: 9100
          containerPort: 9100
          protocol: TCP
        volumeMounts:
        - name: sys
          readOnly: true
          mountPath: /host_sys
        - name: proc
          readOnly: true
          mountPath: /host_proc
      hostNetwork: true
[root@node7-22 ~]# kubectl apply -f http://k8s-yaml.od.com/node-exporter/ds.yaml
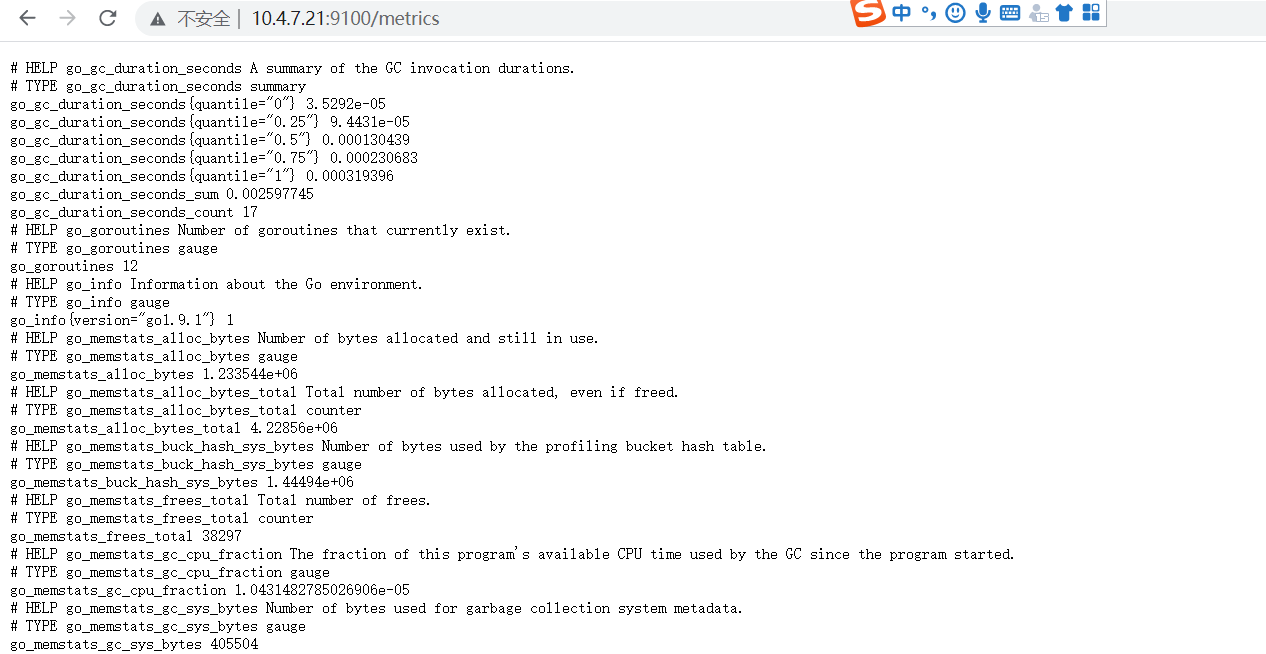
After successful startup, you can view all the monitoring data of the current host obtained by the node exporter, as follows:
Deliver cadvisor
CAdvisor is an open source visualization tool for displaying and analyzing the running state of containers. By running CAdvisor on the host, users can easily obtain the operation statistics of containers on the current host and display them to users in the form of charts.
[root@node7-200 node-exporter]# docker pull google/cadvisor:v0.28.3
[root@node7-200 node-exporter]# docker images|grep cadvisor
google/cadvisor v0.28.3 75f88e3ec333 3 years ago 62.2MB
[root@node7-200 node-exporter]# docker tag 75f88e3ec33 harbor.od.com/public/cadvisor:v0.28.3
[root@node7-200 node-exporter]# docker push harbor.od.com/public/cadvisor:v0.28.3
[root@node7-200 node-exporter]# mkdir /data/k8s-yaml/cadvisor/
[root@node7-200 node-exporter]# cd /data/k8s-yaml/cadvisor/
[root@node7-200 cadvisor]# vi ds.yaml
apiVersion: apps/v1
kind: DaemonSet
metadata:
  name: cadvisor
  namespace: kube-system
  labels:
    app: cadvisor
spec:
  selector:
    matchLabels:
      name: cadvisor
  template:
    metadata:
      labels:
        name: cadvisor
    spec:
      hostNetwork: true
      tolerations:
      - key: node-role.kubernetes.io/master
        effect: NoExecute
      containers:
      - name: cadvisor
        image: harbor.od.com/public/cadvisor:v0.28.3
        imagePullPolicy: IfNotPresent
        volumeMounts:
        - name: rootfs
          mountPath: /rootfs
          readOnly: true
        - name: var-run
          mountPath: /var/run
        - name: sys
          mountPath: /sys
          readOnly: true
        - name: docker
          mountPath: /var/lib/docker
          readOnly: true
        ports:
          - name: http
            containerPort: 4194
            protocol: TCP
        readinessProbe:
          tcpSocket:
            port: 4194
          initialDelaySeconds: 5
          periodSeconds: 10
        args:
          - --housekeeping_interval=10s
          - --port=4194
      terminationGracePeriodSeconds: 30
      volumes:
      - name: rootfs
        hostPath:
          path: /
      - name: var-run
        hostPath:
          path: /var/run
      - name: sys
        hostPath:
          path: /sys
      - name: docker
        hostPath:
          path: /data/docker
[root@node7-21 ~]# mount -o remount,rw /sys/fs/cgroup/
[root@node7-21 ~]# ln -s /sys/fs/cgroup/cpu,cpuacct /sys/fs/cgroup/cpuacct,cpu
[root@node7-21 ~]# ls -l /sys/fs/cgroup/
[root@node7-22 ~]# mount -o remount,rw /sys/fs/cgroup/
[root@node7-22 ~]# ln -s /sys/fs/cgroup/cpu,cpuacct /sys/fs/cgroup/cpuacct,cpu
[root@node7-22 ~]# ls -l /sys/fs/cgroup/
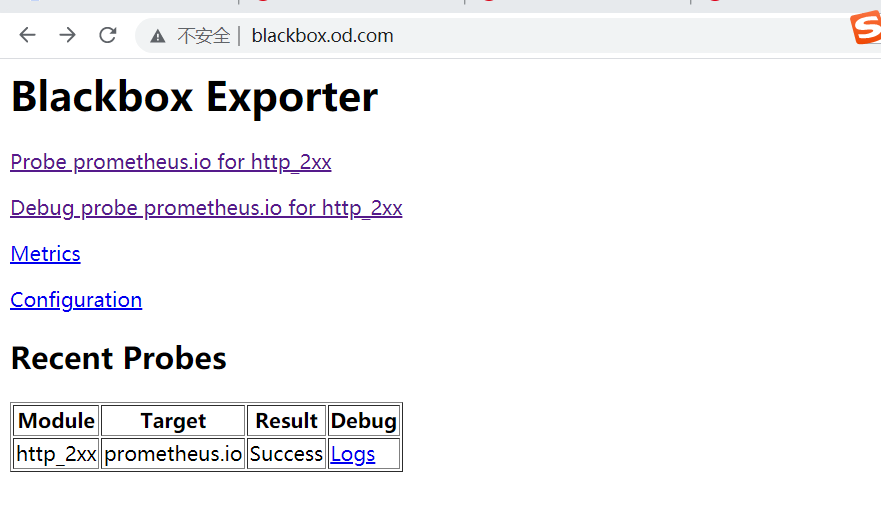
Deliver blackbox exporter
Through the white box, we can understand the actual internal operation status, and through the observation of monitoring indicators, we can predict the possible problems, so as to optimize the potential uncertain factors. From the perspective of complete monitoring logic, in addition to a large number of white box monitoring applications, appropriate black box monitoring should also be added. Black box monitoring is to test the external visibility of the service as a user. Common black box monitoring includes HTTP probe and TCP probe, which are used to detect the accessibility and access efficiency of the site or service.
The biggest difference between black box monitoring and white box monitoring is that black box monitoring is fault oriented. When faults occur, black box monitoring can quickly find faults, while white box monitoring focuses on actively discovering or predicting potential problems. A perfect monitoring goal is to be able to find potential problems from the perspective of white box and quickly find existing problems from the perspective of black box.
Blackbox Exporter is an official black box monitoring solution provided by Prometheus community, which allows users to detect the network through HTTP, HTTPS, DNS, TCP and ICMP.
[root@node7-200 ~]# docker pull prom/blackbox-exporter:v0.15.1
[root@node7-200 ~]# docker images|grep blackbox-exporter
prom/blackbox-exporter v0.15.1 81b70b6158be 23 months ago 19.7MB
[root@node7-200 ~]# docker tag 81b70b6158be harbor.od.com/public/blackbox-exporter:v0.15.1
[root@node7-200 ~]# docker push harbor.od.com/public/blackbox-exporter:v0.15.1
[root@node7-200 ~]# mkdir /data/k8s-yaml/blackbox-exporter
[root@node7-200 ~]# cd /data/k8s-yaml/blackbox-exporter
[root@node7-200 blackbox-exporter]# vi cm.yaml
apiVersion: v1
kind: ConfigMap
metadata:
  labels:
    app: blackbox-exporter
  name: blackbox-exporter
  namespace: kube-system
data:
  blackbox.yml: |-
    modules:
      http_2xx:
        prober: http
        timeout: 2s
        http:
          valid_http_versions: ["HTTP/1.1", "HTTP/2"]
          valid_status_codes: [200,301,302]
          method: GET
          preferred_ip_protocol: "ip4"
      tcp_connect:
        prober: tcp
        timeout: 2s
[root@node7-200 blackbox-exporter]# vi dp.yaml
kind: Deployment
apiVersion: extensions/v1beta1
metadata:
  name: blackbox-exporter
  namespace: kube-system
  labels:
    app: blackbox-exporter
  annotations:
    deployment.kubernetes.io/revision: 1
spec:
  replicas: 1
  selector:
    matchLabels:
      app: blackbox-exporter
  template:
    metadata:
      labels:
        app: blackbox-exporter
    spec:
      volumes:
      - name: config
        configMap:
          name: blackbox-exporter
          defaultMode: 420
      containers:
      - name: blackbox-exporter
        image: harbor.od.com/public/blackbox-exporter:v0.15.1
        imagePullPolicy: IfNotPresent
        args:
        - --config.file=/etc/blackbox_exporter/blackbox.yml
        - --log.level=info
        - --web.listen-address=:9115
        ports:
        - name: blackbox-port
          containerPort: 9115
          protocol: TCP
        resources:
          limits:
            cpu: 200m
            memory: 256Mi
          requests:
            cpu: 100m
            memory: 50Mi
        volumeMounts:
        - name: config
          mountPath: /etc/blackbox_exporter
        readinessProbe:
          tcpSocket:
            port: 9115
          initialDelaySeconds: 5
          timeoutSeconds: 5
          periodSeconds: 10
          successThreshold: 1
          failureThreshold: 3
[root@node7-200 blackbox-exporter]# vi svc.yaml
kind: Service
apiVersion: v1
metadata:
  name: blackbox-exporter
  namespace: kube-system
spec:
  selector:
    app: blackbox-exporter
  ports:
    - name: blackbox-port
      protocol: TCP
      port: 9115
[root@node7-200 blackbox-exporter]# vi ingress.yaml
apiVersion: extensions/v1beta1
kind: Ingress
metadata:
  name: blackbox-exporter
  namespace: kube-system
spec:
  rules:
  - host: blackbox.od.com
    http:
      paths:
      - path: /
        backend:
          serviceName: blackbox-exporter
          servicePort: blackbox-port
[root@node7-21 ~]# kubectl apply -f http://k8s-yaml.od.com/blackbox-exporter/cm.yaml
[root@node7-21 ~]# kubectl apply -f http://k8s-yaml.od.com/blackbox-exporter/dp.yaml
[root@node7-21 ~]# kubectl apply -f http://k8s-yaml.od.com/blackbox-exporter/svc.yaml
[root@node7-21 ~]# kubectl apply -f http://k8s-yaml.od.com/blackbox-exporter/ingress.yaml