[TOC]
Preface
about Actuator:
Partners who know about Spring Boot monitoring capabilities should know about the Spring Boot Actuator subproject, which provides powerful monitoring capabilities for applications.Starting with Spring Boot 2.x, Actuator changed the underlying layer to Micrometer, providing stronger and more flexible monitoring capabilities.Micrometer is a monitoring facade that can be analogized to Slf4j in the monitoring community.With Micrometer, applications can dock a variety of Monitoring system For example, as described in this article: Prometheus
about Prometheus :
Prometheus is an open source system monitoring + alert + time series database (TSDB) developed by SoundCloud. Most of the components of Prometheus are written in Go and are open source versions of the Google BorgMon monitoring system.It is currently hosted by the CNCF Foundation and has been hatched successfully.Prometheus is also currently quite active in the open source community and is sufficient to support tens of thousands of clusters in terms of performance.
Prometheus features:
- Multidimensional data model for identifying time series data using measure name and key pairs
- Has a flexible query language: PromQL
- Independent of distributed storage, a single server node is autonomous
- Collecting time series data by pull based on HTTP
- Time Series Data Push Through Intermediate Gateway
- Supports discovery of target service objects through service discovery or static configuration
- Supports a variety of graphics and interface presentations, such as Grafana
For more information: Official Documents,GitHub warehouse
about Grafana:
Grafana is an open source application written in the GO language that supports cross-platform metrical analysis and visualization + alerts.You can query and visualize the collected data and notify in time.Grafana supports a variety of data sources and displays, all in all, a powerful and cool visualization tool for monitoring metrics.
For more information: Official Documents,GitHub warehouse
Create Project
The main purpose of this article is to achieve the monitoring of microservices. After a brief understanding of the concepts of these tools, let's start with them.Start by creating a simple Spring Boot project that relies primarily on the following:
<dependency>
    <groupId>org.springframework.boot</groupId>
    <artifactId>spring-boot-starter-web</artifactId>
</dependency>
<dependency>
    <groupId>org.springframework.boot</groupId>
    <artifactId>spring-boot-starter-actuator</artifactId>
</dependency>
<dependency>
    <groupId>io.micrometer</groupId>
    <artifactId>micrometer-registry-prometheus</artifactId>
</dependency>- Tips: If you want to dock other monitoring systems here, you only need to change the dependent package name.For example, if you want to dock Influx, change the dependency to micrometer-registry-influx.
Edit project configuration:
server:
  port: 9562
spring:
  application:
    # Specify application name
    name: prometheus-demo
management:
  endpoints:
    web:
      exposure:
        # Expose Actuator's/actuator/prometheus endpoint
        include: 'prometheus'
  metrics:
    tags:
      # Set a Tag for the metric, set here to the application name, Tag is one of the capabilities provided by Prometheus for more flexible filtering
      application: ${spring.application.name}
After completing these steps, do a simple test to see if the endpoint returns the monitoring data properly.Start the project and access the/actuator/prometheus endpoint.Normally the following is returned:
# HELP process_start_time_seconds Start time of the process since unix epoch.
# TYPE process_start_time_seconds gauge
process_start_time_seconds{application="prometheus-demo",} 1.577697308142E9
# HELP jvm_buffer_memory_used_bytes An estimate of the memory that the Java virtual machine is using for this buffer pool
# TYPE jvm_buffer_memory_used_bytes gauge
jvm_buffer_memory_used_bytes{application="prometheus-demo",id="mapped",} 0.0
jvm_buffer_memory_used_bytes{application="prometheus-demo",id="direct",} 16384.0
# HELP tomcat_sessions_expired_sessions_total
# TYPE tomcat_sessions_expired_sessions_total counter
tomcat_sessions_expired_sessions_total{application="prometheus-demo",} 0.0
# HELP jvm_gc_pause_seconds Time spent in GC pause
# TYPE jvm_gc_pause_seconds summary
jvm_gc_pause_seconds_count{action="end of minor GC",application="prometheus-demo",cause="Metadata GC Threshold",} 1.0
jvm_gc_pause_seconds_sum{action="end of minor GC",application="prometheus-demo",cause="Metadata GC Threshold",} 0.006
jvm_gc_pause_seconds_count{action="end of major GC",application="prometheus-demo",cause="Metadata GC Threshold",} 1.0
jvm_gc_pause_seconds_sum{action="end of major GC",application="prometheus-demo",cause="Metadata GC Threshold",} 0.032
jvm_gc_pause_seconds_count{action="end of minor GC",application="prometheus-demo",cause="Allocation Failure",} 1.0
jvm_gc_pause_seconds_sum{action="end of minor GC",application="prometheus-demo",cause="Allocation Failure",} 0.008
# HELP jvm_gc_pause_seconds_max Time spent in GC pause
# TYPE jvm_gc_pause_seconds_max gauge
jvm_gc_pause_seconds_max{action="end of minor GC",application="prometheus-demo",cause="Metadata GC Threshold",} 0.006
jvm_gc_pause_seconds_max{action="end of major GC",application="prometheus-demo",cause="Metadata GC Threshold",} 0.032
jvm_gc_pause_seconds_max{action="end of minor GC",application="prometheus-demo",cause="Allocation Failure",} 0.008
# HELP jvm_memory_used_bytes The amount of used memory
# TYPE jvm_memory_used_bytes gauge
jvm_memory_used_bytes{application="prometheus-demo",area="heap",id="PS Survivor Space",} 0.0
jvm_memory_used_bytes{application="prometheus-demo",area="heap",id="PS Old Gen",} 1.3801776E7
jvm_memory_used_bytes{application="prometheus-demo",area="nonheap",id="Metaspace",} 3.522832E7
jvm_memory_used_bytes{application="prometheus-demo",area="nonheap",id="Code Cache",} 6860800.0
jvm_memory_used_bytes{application="prometheus-demo",area="heap",id="PS Eden Space",} 1.9782928E7
jvm_memory_used_bytes{application="prometheus-demo",area="nonheap",id="Compressed Class Space",} 4825568.0
# HELP logback_events_total Number of error level events that made it to the logs
# TYPE logback_events_total counter
logback_events_total{application="prometheus-demo",level="info",} 7.0
logback_events_total{application="prometheus-demo",level="trace",} 0.0
logback_events_total{application="prometheus-demo",level="warn",} 0.0
logback_events_total{application="prometheus-demo",level="debug",} 0.0
logback_events_total{application="prometheus-demo",level="error",} 0.0
# HELP process_uptime_seconds The uptime of the Java virtual machine
# TYPE process_uptime_seconds gauge
process_uptime_seconds{application="prometheus-demo",} 30.499
# HELP jvm_buffer_count_buffers An estimate of the number of buffers in the pool
# TYPE jvm_buffer_count_buffers gauge
jvm_buffer_count_buffers{application="prometheus-demo",id="mapped",} 0.0
jvm_buffer_count_buffers{application="prometheus-demo",id="direct",} 2.0
# HELP system_cpu_count The number of processors available to the Java virtual machine
# TYPE system_cpu_count gauge
system_cpu_count{application="prometheus-demo",} 6.0
# HELP jvm_threads_peak_threads The peak live thread count since the Java virtual machine started or peak was reset
# TYPE jvm_threads_peak_threads gauge
jvm_threads_peak_threads{application="prometheus-demo",} 22.0
# HELP tomcat_sessions_alive_max_seconds
# TYPE tomcat_sessions_alive_max_seconds gauge
tomcat_sessions_alive_max_seconds{application="prometheus-demo",} 0.0
# HELP jvm_memory_committed_bytes The amount of memory in bytes that is committed for the Java virtual machine to use
# TYPE jvm_memory_committed_bytes gauge
jvm_memory_committed_bytes{application="prometheus-demo",area="heap",id="PS Survivor Space",} 1.5204352E7
jvm_memory_committed_bytes{application="prometheus-demo",area="heap",id="PS Old Gen",} 1.31596288E8
jvm_memory_committed_bytes{application="prometheus-demo",area="nonheap",id="Metaspace",} 3.7879808E7
jvm_memory_committed_bytes{application="prometheus-demo",area="nonheap",id="Code Cache",} 6881280.0
jvm_memory_committed_bytes{application="prometheus-demo",area="heap",id="PS Eden Space",} 1.76685056E8
jvm_memory_committed_bytes{application="prometheus-demo",area="nonheap",id="Compressed Class Space",} 5373952.0
# HELP jvm_buffer_total_capacity_bytes An estimate of the total capacity of the buffers in this pool
# TYPE jvm_buffer_total_capacity_bytes gauge
jvm_buffer_total_capacity_bytes{application="prometheus-demo",id="mapped",} 0.0
jvm_buffer_total_capacity_bytes{application="prometheus-demo",id="direct",} 16384.0
# HELP jvm_gc_live_data_size_bytes Size of old generation memory pool after a full GC
# TYPE jvm_gc_live_data_size_bytes gauge
jvm_gc_live_data_size_bytes{application="prometheus-demo",} 1.3801776E7
# HELP jvm_memory_max_bytes The maximum amount of memory in bytes that can be used for memory management
# TYPE jvm_memory_max_bytes gauge
jvm_memory_max_bytes{application="prometheus-demo",area="heap",id="PS Survivor Space",} 1.5204352E7
jvm_memory_max_bytes{application="prometheus-demo",area="heap",id="PS Old Gen",} 2.841116672E9
jvm_memory_max_bytes{application="prometheus-demo",area="nonheap",id="Metaspace",} -1.0
jvm_memory_max_bytes{application="prometheus-demo",area="nonheap",id="Code Cache",} 2.5165824E8
jvm_memory_max_bytes{application="prometheus-demo",area="heap",id="PS Eden Space",} 1.390411776E9
jvm_memory_max_bytes{application="prometheus-demo",area="nonheap",id="Compressed Class Space",} 1.073741824E9
# HELP jvm_threads_daemon_threads The current number of live daemon threads
# TYPE jvm_threads_daemon_threads gauge
jvm_threads_daemon_threads{application="prometheus-demo",} 18.0
# HELP jvm_threads_states_threads The current number of threads having NEW state
# TYPE jvm_threads_states_threads gauge
jvm_threads_states_threads{application="prometheus-demo",state="runnable",} 8.0
jvm_threads_states_threads{application="prometheus-demo",state="new",} 0.0
jvm_threads_states_threads{application="prometheus-demo",state="timed-waiting",} 2.0
jvm_threads_states_threads{application="prometheus-demo",state="blocked",} 0.0
jvm_threads_states_threads{application="prometheus-demo",state="waiting",} 12.0
jvm_threads_states_threads{application="prometheus-demo",state="terminated",} 0.0
# HELP jvm_gc_memory_promoted_bytes_total Count of positive increases in the size of the old generation memory pool before GC to after GC
# TYPE jvm_gc_memory_promoted_bytes_total counter
jvm_gc_memory_promoted_bytes_total{application="prometheus-demo",} 8296848.0
# HELP tomcat_sessions_active_max_sessions
# TYPE tomcat_sessions_active_max_sessions gauge
tomcat_sessions_active_max_sessions{application="prometheus-demo",} 0.0
# HELP tomcat_sessions_created_sessions_total
# TYPE tomcat_sessions_created_sessions_total counter
tomcat_sessions_created_sessions_total{application="prometheus-demo",} 0.0
# HELP jvm_gc_memory_allocated_bytes_total Incremented for an increase in the size of the young generation memory pool after one GC to before the next
# TYPE jvm_gc_memory_allocated_bytes_total counter
jvm_gc_memory_allocated_bytes_total{application="prometheus-demo",} 1.36924824E8
# HELP process_cpu_usage The "recent cpu usage" for the Java Virtual Machine process
# TYPE process_cpu_usage gauge
process_cpu_usage{application="prometheus-demo",} 0.10024585094452443
# HELP system_cpu_usage The "recent cpu usage" for the whole system
# TYPE system_cpu_usage gauge
system_cpu_usage{application="prometheus-demo",} 0.38661791030714154
# HELP tomcat_sessions_active_current_sessions
# TYPE tomcat_sessions_active_current_sessions gauge
tomcat_sessions_active_current_sessions{application="prometheus-demo",} 0.0
# HELP jvm_classes_loaded_classes The number of classes that are currently loaded in the Java virtual machine
# TYPE jvm_classes_loaded_classes gauge
jvm_classes_loaded_classes{application="prometheus-demo",} 7195.0
# HELP http_server_requests_seconds
# TYPE http_server_requests_seconds summary
http_server_requests_seconds_count{application="prometheus-demo",exception="None",method="GET",outcome="CLIENT_ERROR",status="404",uri="/**",} 1.0
http_server_requests_seconds_sum{application="prometheus-demo",exception="None",method="GET",outcome="CLIENT_ERROR",status="404",uri="/**",} 0.012429856
# HELP http_server_requests_seconds_max
# TYPE http_server_requests_seconds_max gauge
http_server_requests_seconds_max{application="prometheus-demo",exception="None",method="GET",outcome="CLIENT_ERROR",status="404",uri="/**",} 0.012429856
# HELP jvm_gc_max_data_size_bytes Max size of old generation memory pool
# TYPE jvm_gc_max_data_size_bytes gauge
jvm_gc_max_data_size_bytes{application="prometheus-demo",} 2.841116672E9
# HELP jvm_threads_live_threads The current number of live threads including both daemon and non-daemon threads
# TYPE jvm_threads_live_threads gauge
jvm_threads_live_threads{application="prometheus-demo",} 22.0
# HELP jvm_classes_unloaded_classes_total The total number of classes unloaded since the Java virtual machine has started execution
# TYPE jvm_classes_unloaded_classes_total counter
jvm_classes_unloaded_classes_total{application="prometheus-demo",} 1.0
# HELP tomcat_sessions_rejected_sessions_total
# TYPE tomcat_sessions_rejected_sessions_total counter
tomcat_sessions_rejected_sessions_total{application="prometheus-demo",} 0.0
The data returned by this endpoint is what Prometheus needs to use.Each item has a corresponding comment explaining its meaning, which I believe is not difficult to understand.For example:
# HELP jvm_memory_used_bytes The amount of used memory
# TYPE jvm_memory_used_bytes gauge
jvm_memory_used_bytes{application="prometheus-demo",area="heap",id="PS Survivor Space",} 0.0
Representation: The PS Survivor Space area in prometheus-demo application heap memory occupies 0.0 bytes of space.
Install Prometheus Service
The next step is to install the Prometheus service on the server to collect monitoring data from the monitoring endpoints exposed by the microservice.For simplicity, I use docker installation here, other installation methods can be referred to Official Installation Documentation.
First prepare a configuration file for Prometheus:
[root@localhost ~]# mkdir /etc/prometheus
[root@localhost ~]# vim /etc/prometheus/prometheus.yml
scrape_configs:
# Write freely, suggest English, do not include special characters
- job_name: 'spring'
  # How often do you collect data
  scrape_interval: 15s
  # Timeout during collection
  scrape_timeout: 10s
  # Endpoint of collection
  metrics_path: '/actuator/prometheus'
  # The collected service address, i.e. the ip and port of the micro service
  static_configs:
  - targets: ['192.168.1.252:9562']
The purpose of this profile is to have the Prometheus service automatically request http://192.168.1.252:9562/actuator/prometheus every 15 seconds.More Configuration Items Reference: Official Prometheus Configuration Document
Finally, start the Prometheus service through docker with the following commands:
[root@localhost ~]# docker run -d -p 9090:9090 -v /etc/prometheus/prometheus.yml:/etc/prometheus/prometheus.yml prom/prometheus --config.file=/etc/prometheus/prometheus.yml
After successful startup, normally visit http://{ip}:9090 and you will see the first page of Prometheus: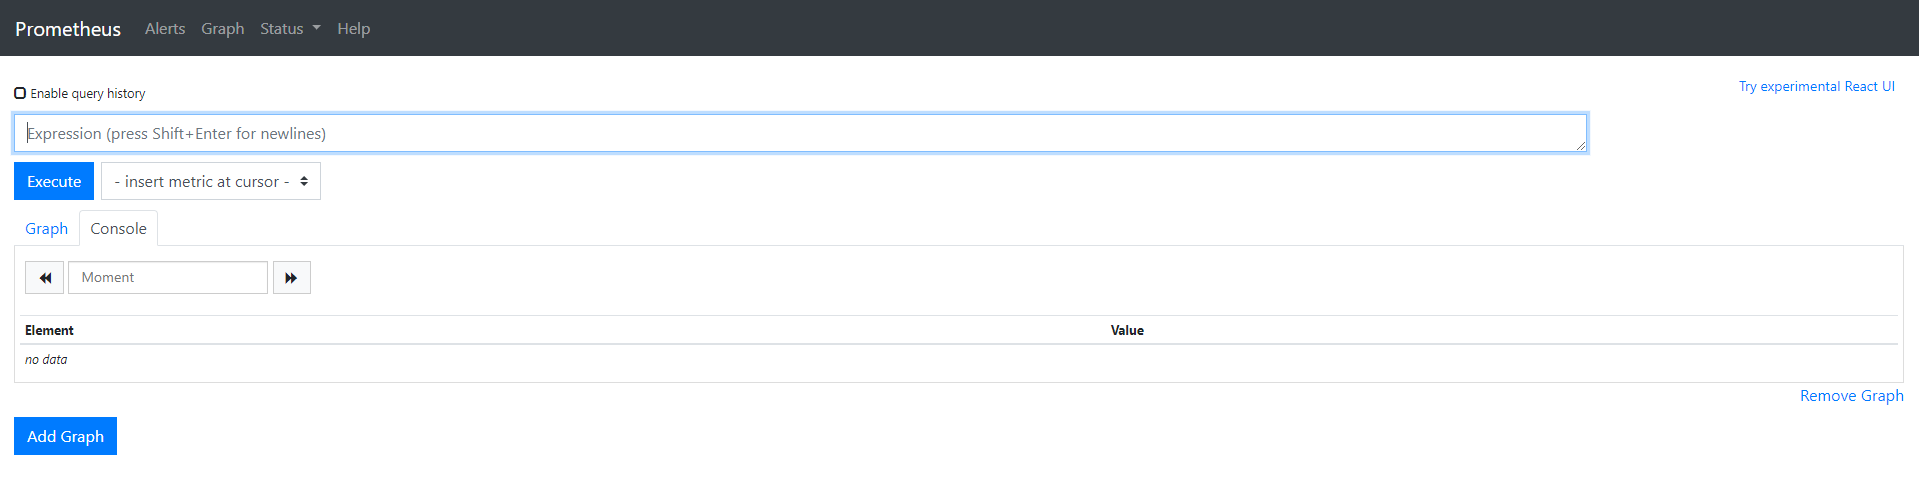
Click Insert metric at cursor to select a monitoring indicator; click Graph to display the indicator as a chart; click Execute to see results similar to the following: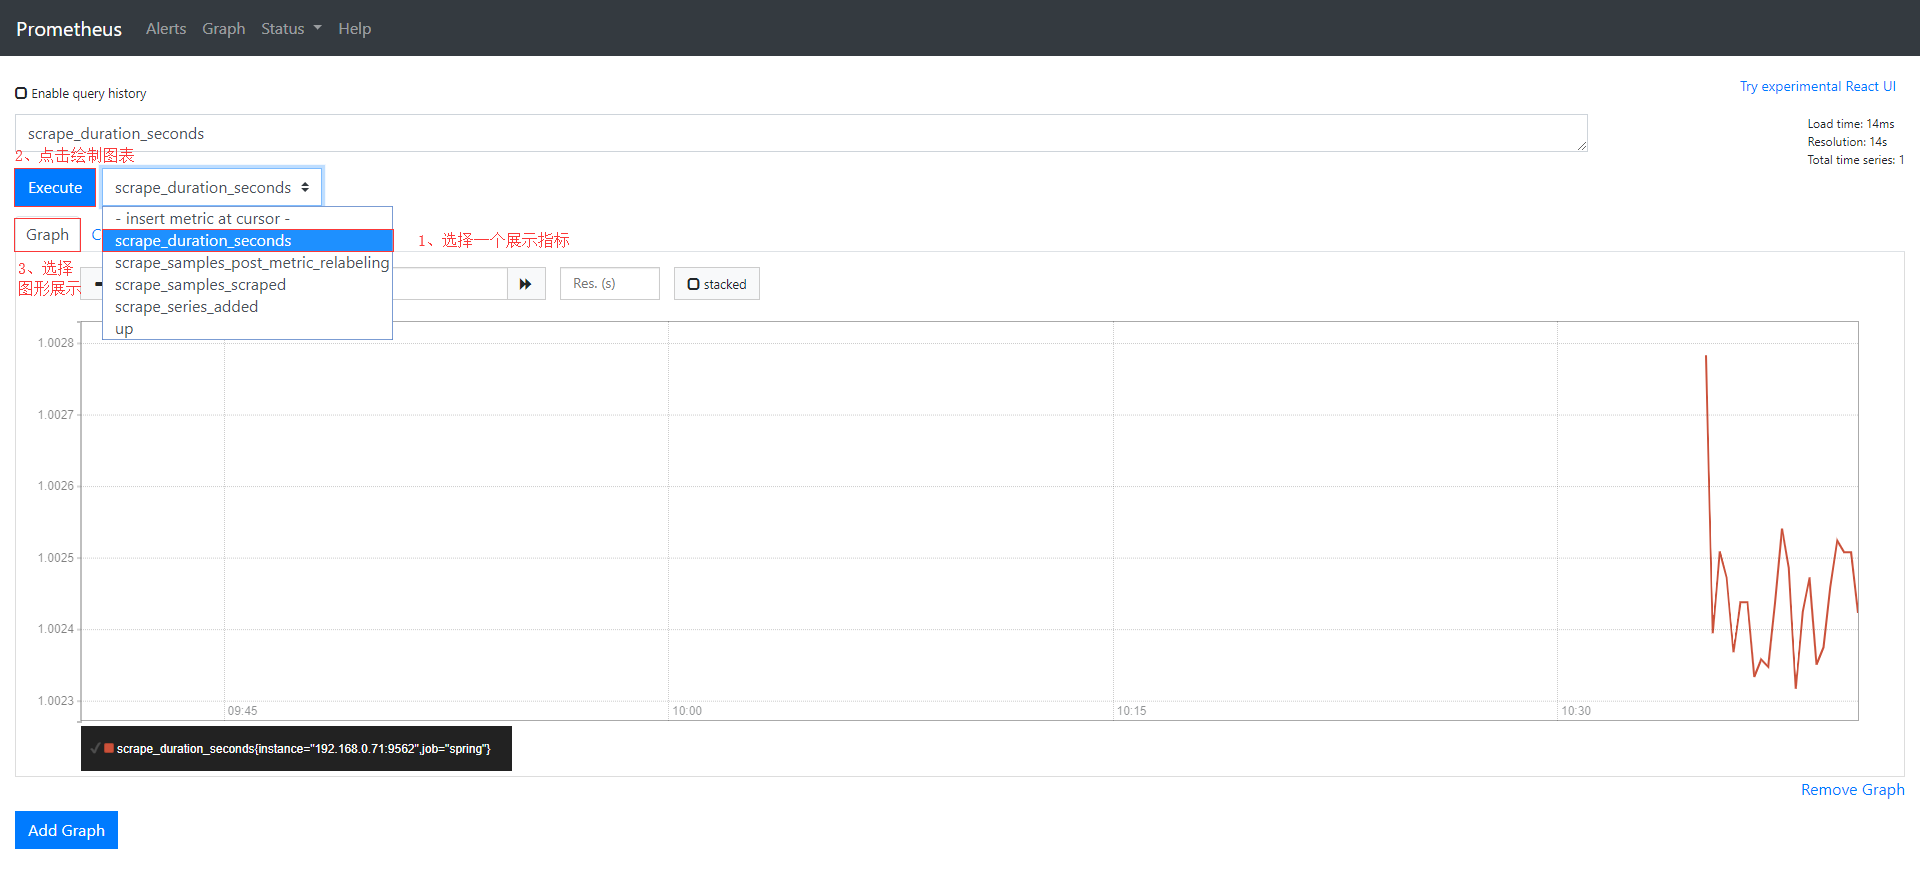
Functional description:
- Insert metric at cursor: Select indicators to show
- Graph: Let metrics be graphically displayed
- Execute: Draw indicator chart information
- Add Graph: Draw more indicator charts
Grafana Visualization
In the last section, we have successfully set up the Prometheus service and briefly introduced the monitoring data visualization interface that comes with Prometheus. However, the experience is not good and there are few functions.Let's integrate Grafana for a more friendly and production-proximity monitoring data visualization platform.
The Grafana service also needs to be installed on the server, and for simplicity, I'm still installing docker here.Other installation methods can be referred to Official Installation Documentation.
Grafana can be started with just one line of command using docker, as follows:
[root@localhost ~]# docker run -d -p 3000:3000 grafana/grafana
Configuring monitoring data sources
After Grafana starts successfully, log in by visiting http://{ip}:3000/login with admin as the default account password:
After successful login, the first page is as follows: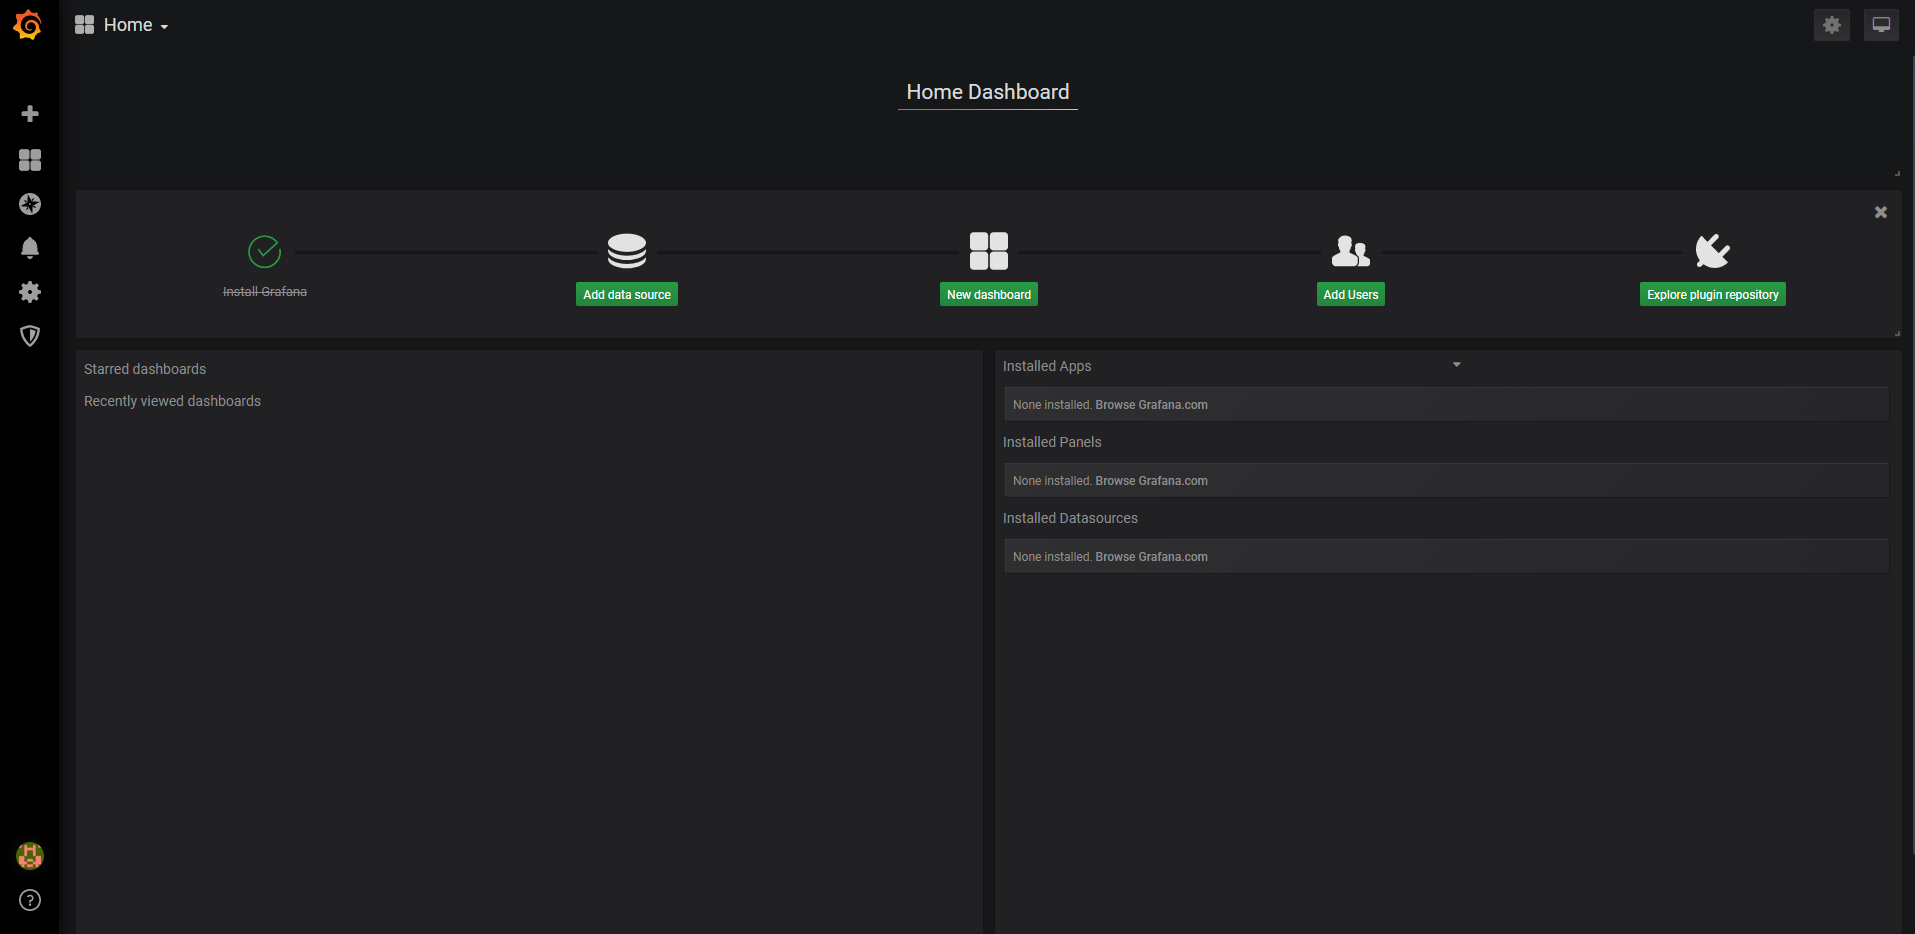
First, you need to add a source of monitoring data. Click Add data source on the first page to see an interface similar to the following: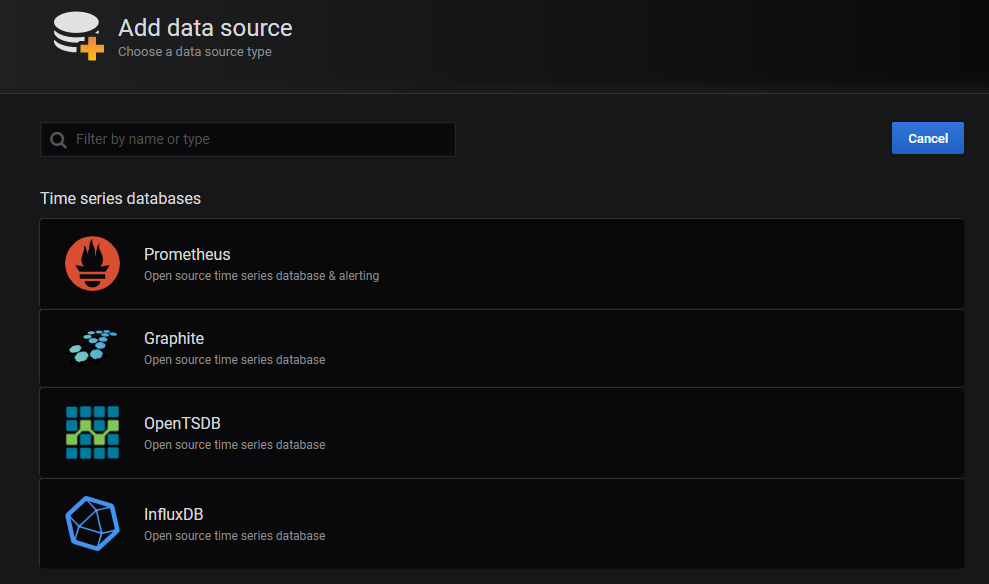
Click Prometheus here to see a similar interface for configuring Prometheus services: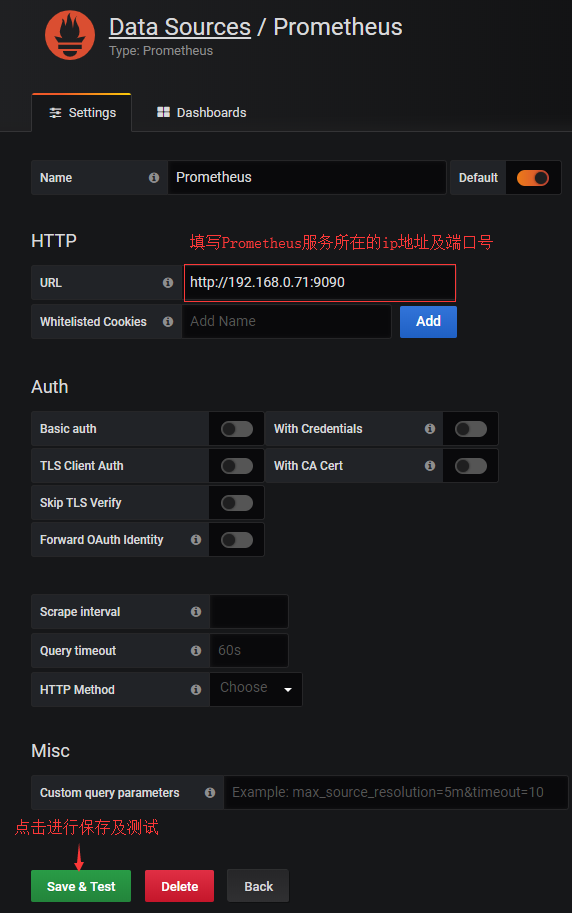
When the save is successful, you will be prompted as follows:
Create monitoring Dashboard
Click the + button on the navigation bar and click Dashboard to see an interface similar to the following: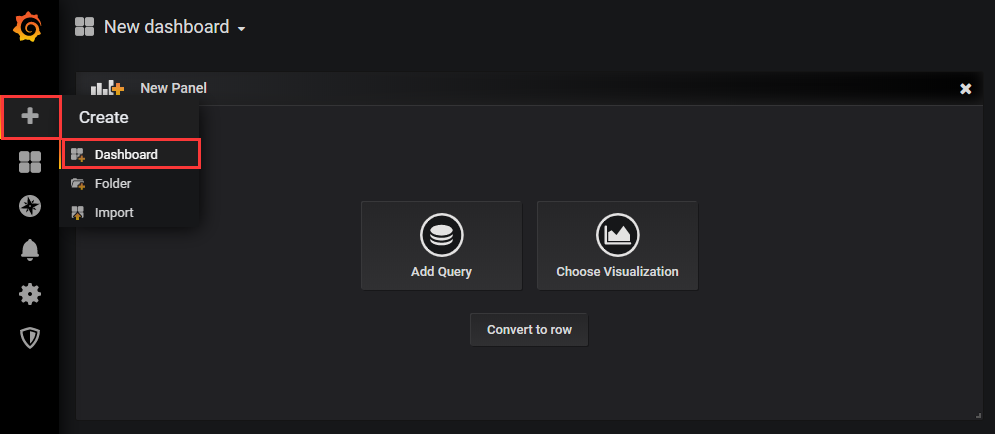
Click Add Query to see an interface similar to the following: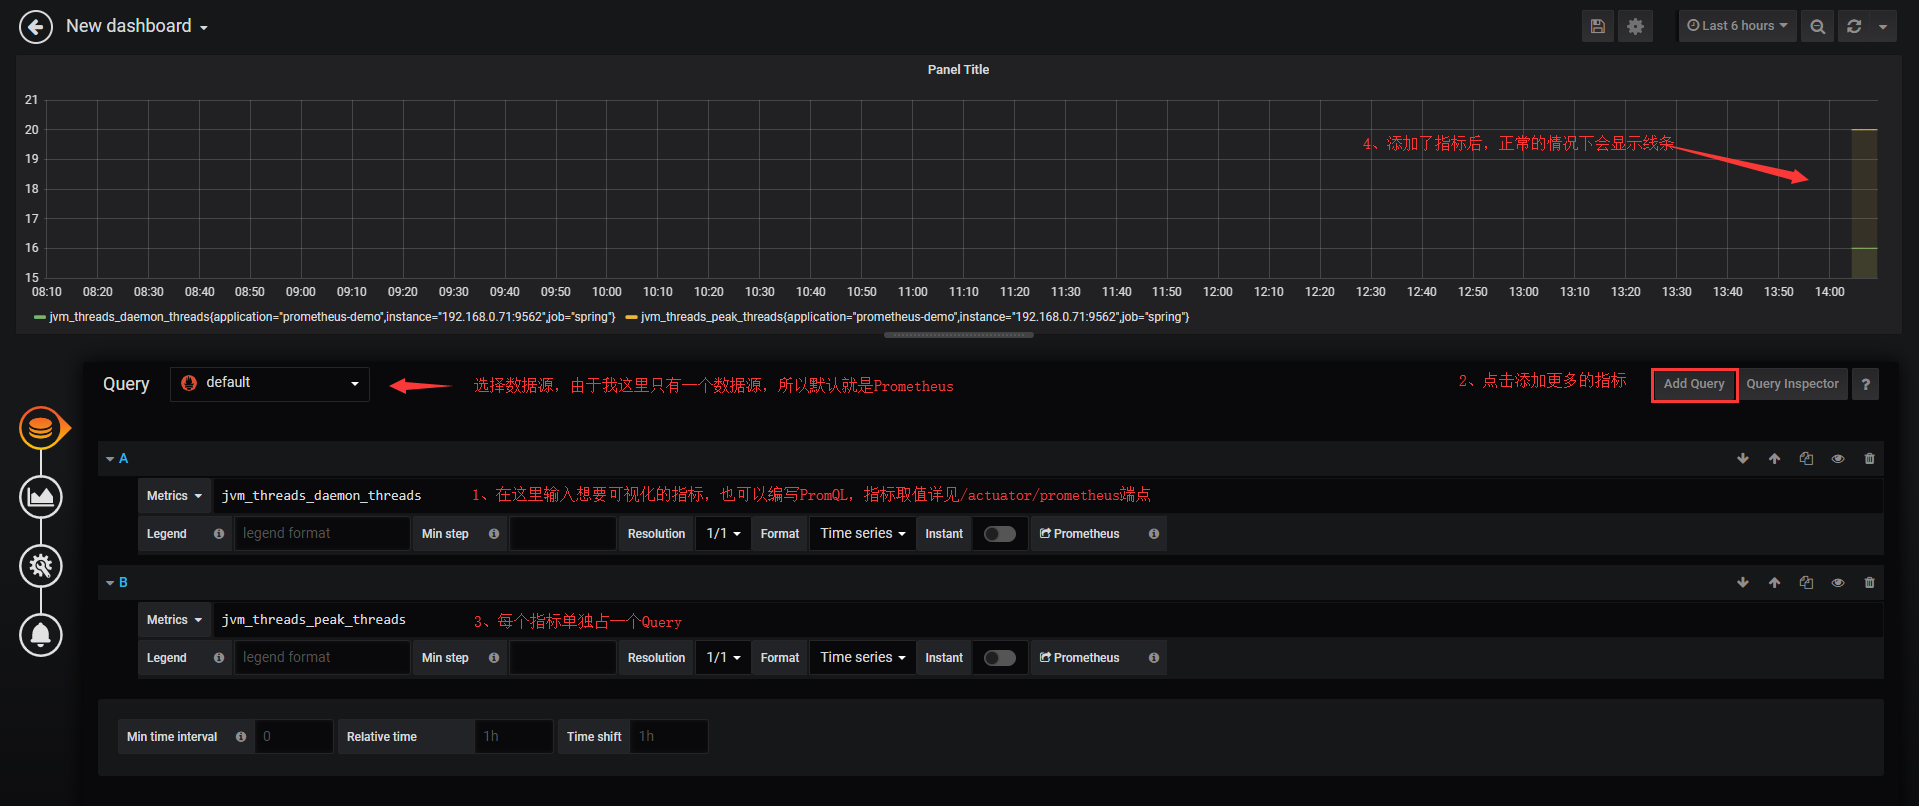
Add an indicator query at the location marked by the red box. The value of the indicator is detailed in the / actuator/prometheus endpoints applied by Spring Boot, such as jvm_memory_used_bytes, jvm_threads_states_threads, jvm_threads_live_threads, and so on.
Grafana gives you better hints and supports more complex calculations such as aggregation, summation, averaging, and so on.If you want to draw more than one line, click the Add Query button.As shown in the figure above, the author draws two lines for the graph, representing the daemon and peak threads.
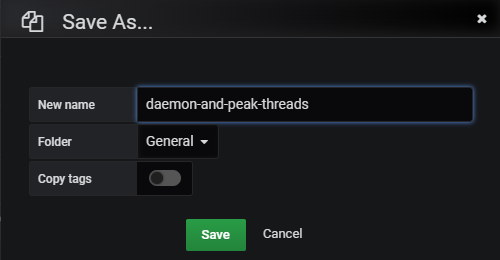
Click the button below and fill in the Title to set the chart title: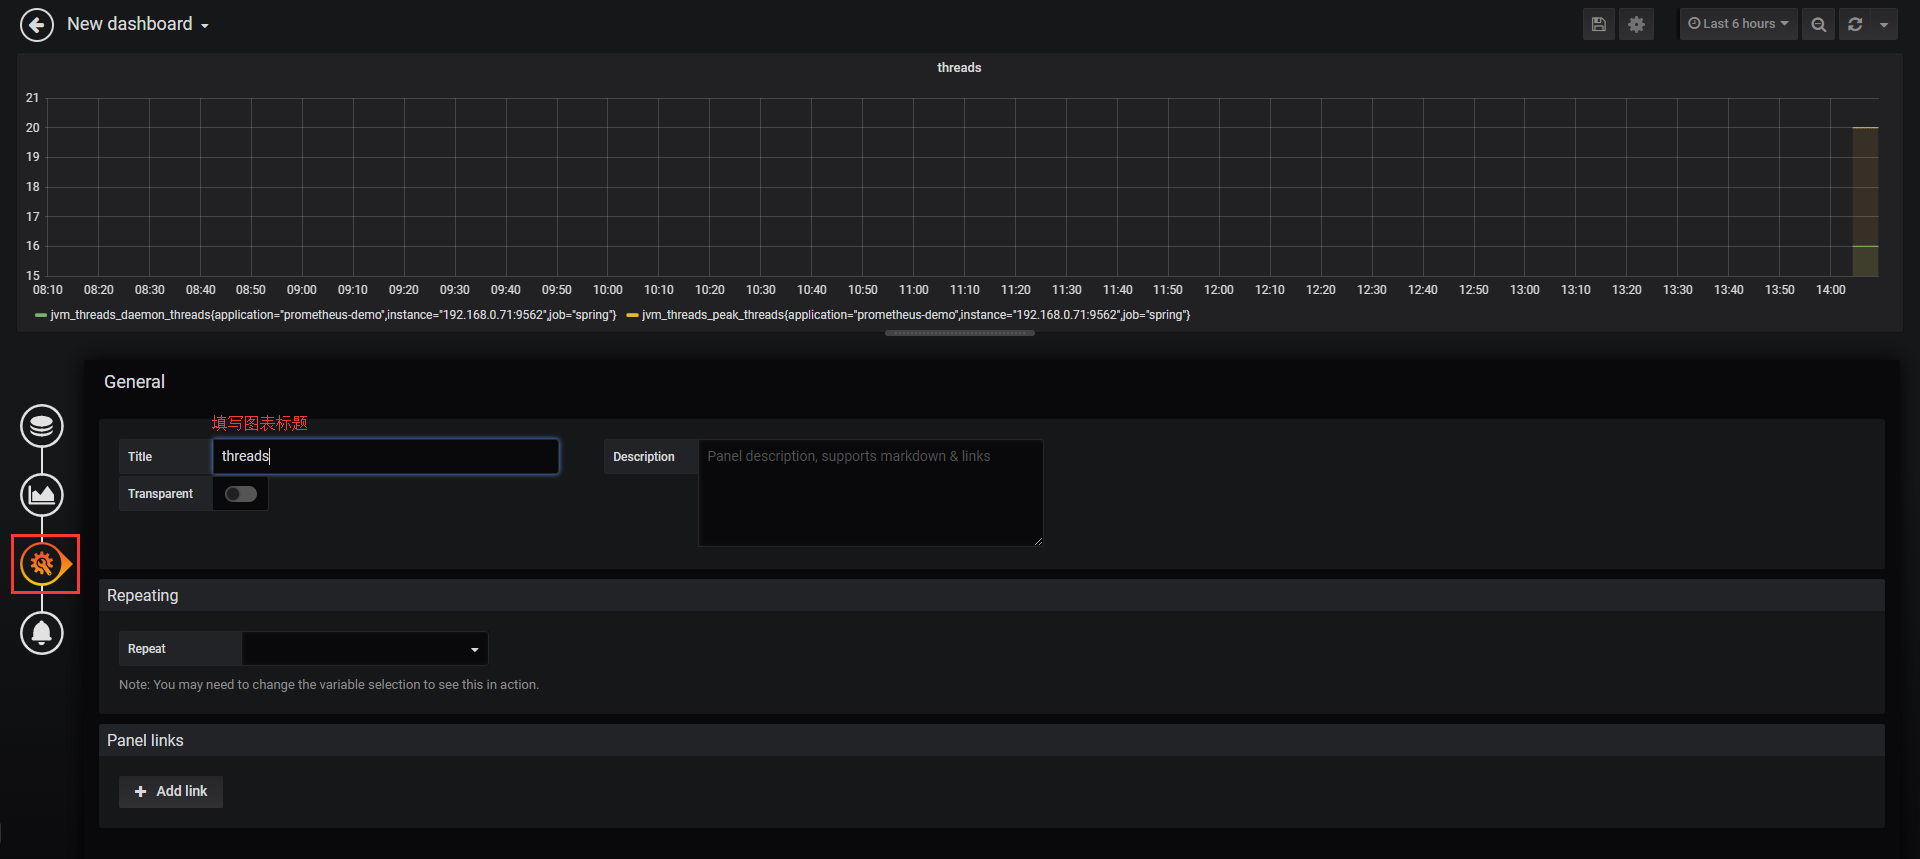
If you need to add a new chart to Dashboard, click the top left button in the image above:
And follow the steps shown below: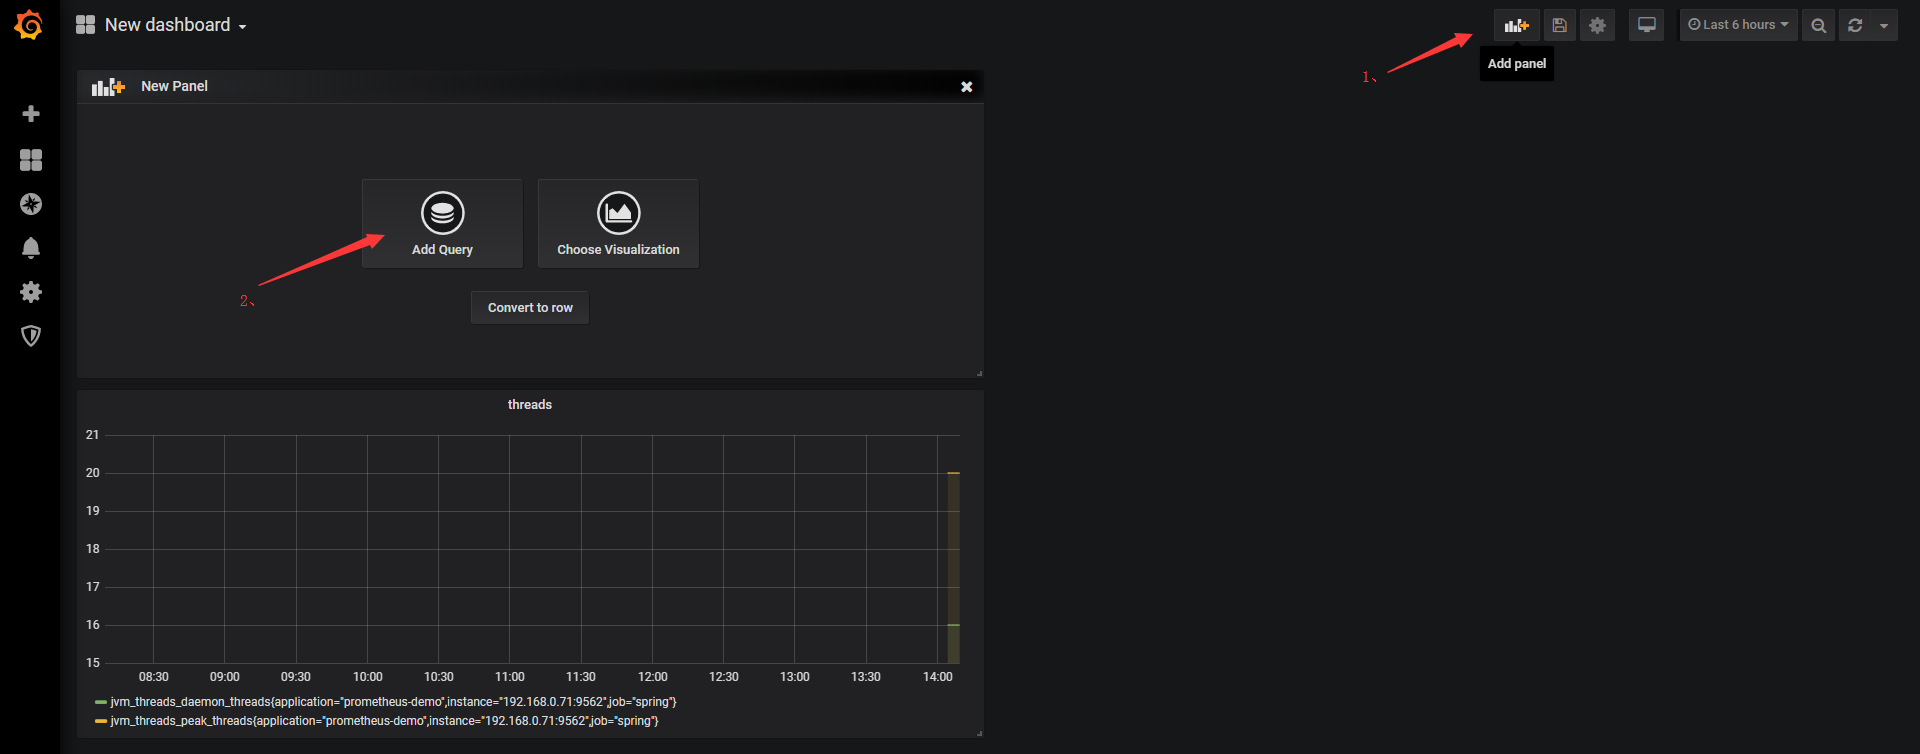
If you need to save the Dashboard, click the Save button in the upper right corner: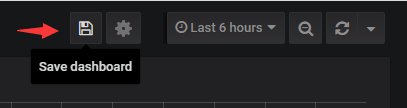
Dashboard Market
So far, we've successfully integrated Grafana with Prometheus for a richer chart presentation - putting monitoring metrics of interest on Dashboard and being very flexible!However, the operation of this configuration is not difficult, but it is time consuming.
So is there a well-configured, powerful, universal, ready-to-use Dashboard?The answer is yes!Go to Grafana Lab - Dashboards , enter a keyword to search for the specified Dashboard: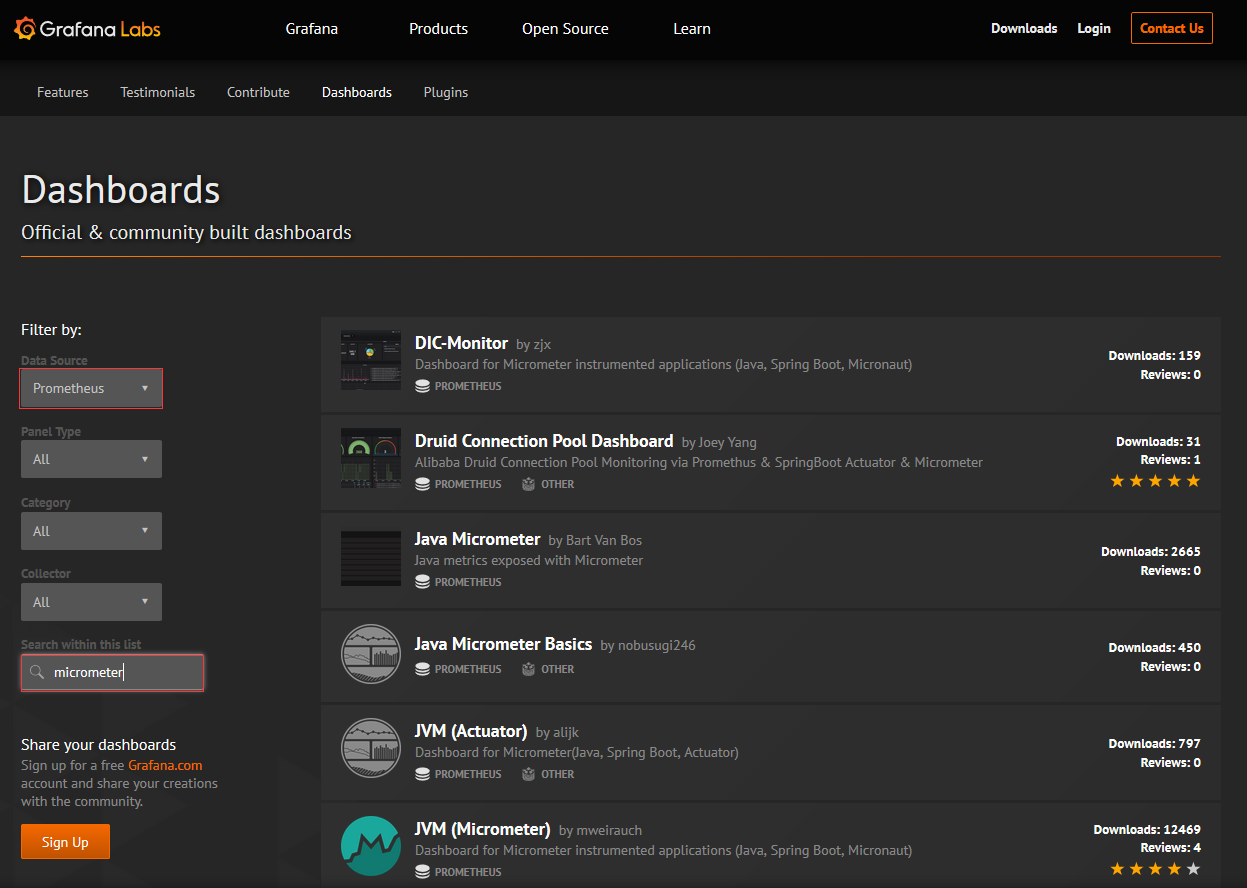
As shown in the figure above, several dashboards with Prometheus as the data source supporting Micrometer can be found.Below is a brief demonstration of how to use the JVM(Micrometer) Dashboard.Click JVM(Micrometer) to enter the Dashboard details page, as shown in the following image: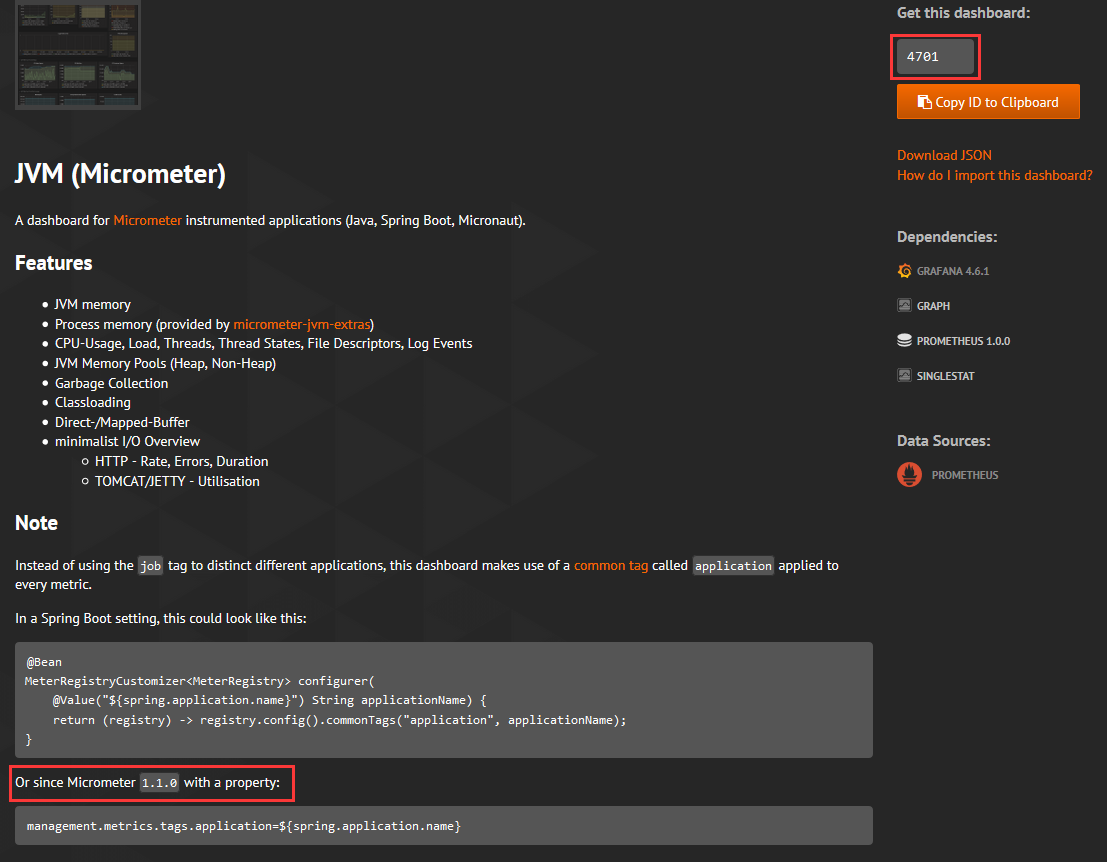
The characteristics and configuration of the Dashboard are described in detail in the figure.management.metrics.tags.application, which was previously configured when the Prometheus service was installed.The red box 4701 in the upper right corner of the page is a very important number because it is the id of the Dashboard.
Back on Grafana's first page, let's import this Dashboard and follow the steps shown below: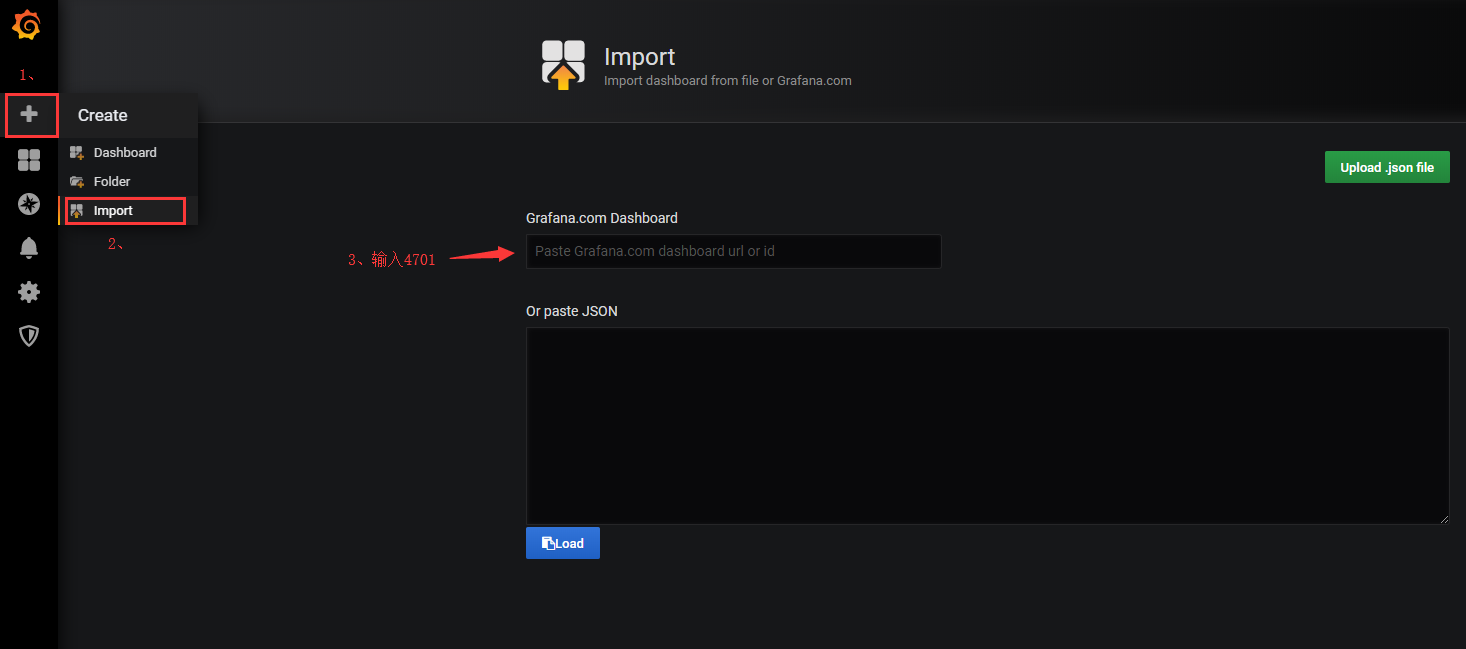
After entering, you can see an interface similar to the following, select the data source, and click Import: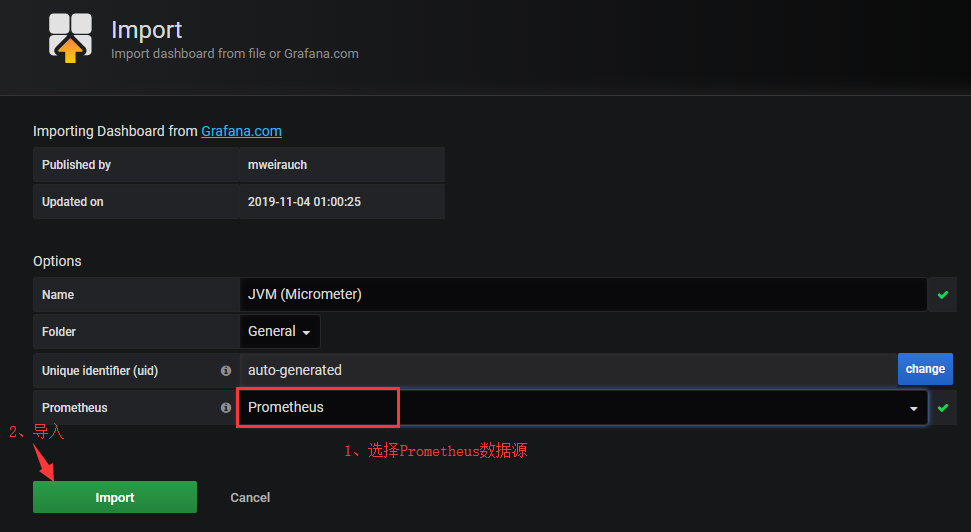
At this point, you'll see an interface similar to the following, with Dashboard supporting the metrics we're always interested in: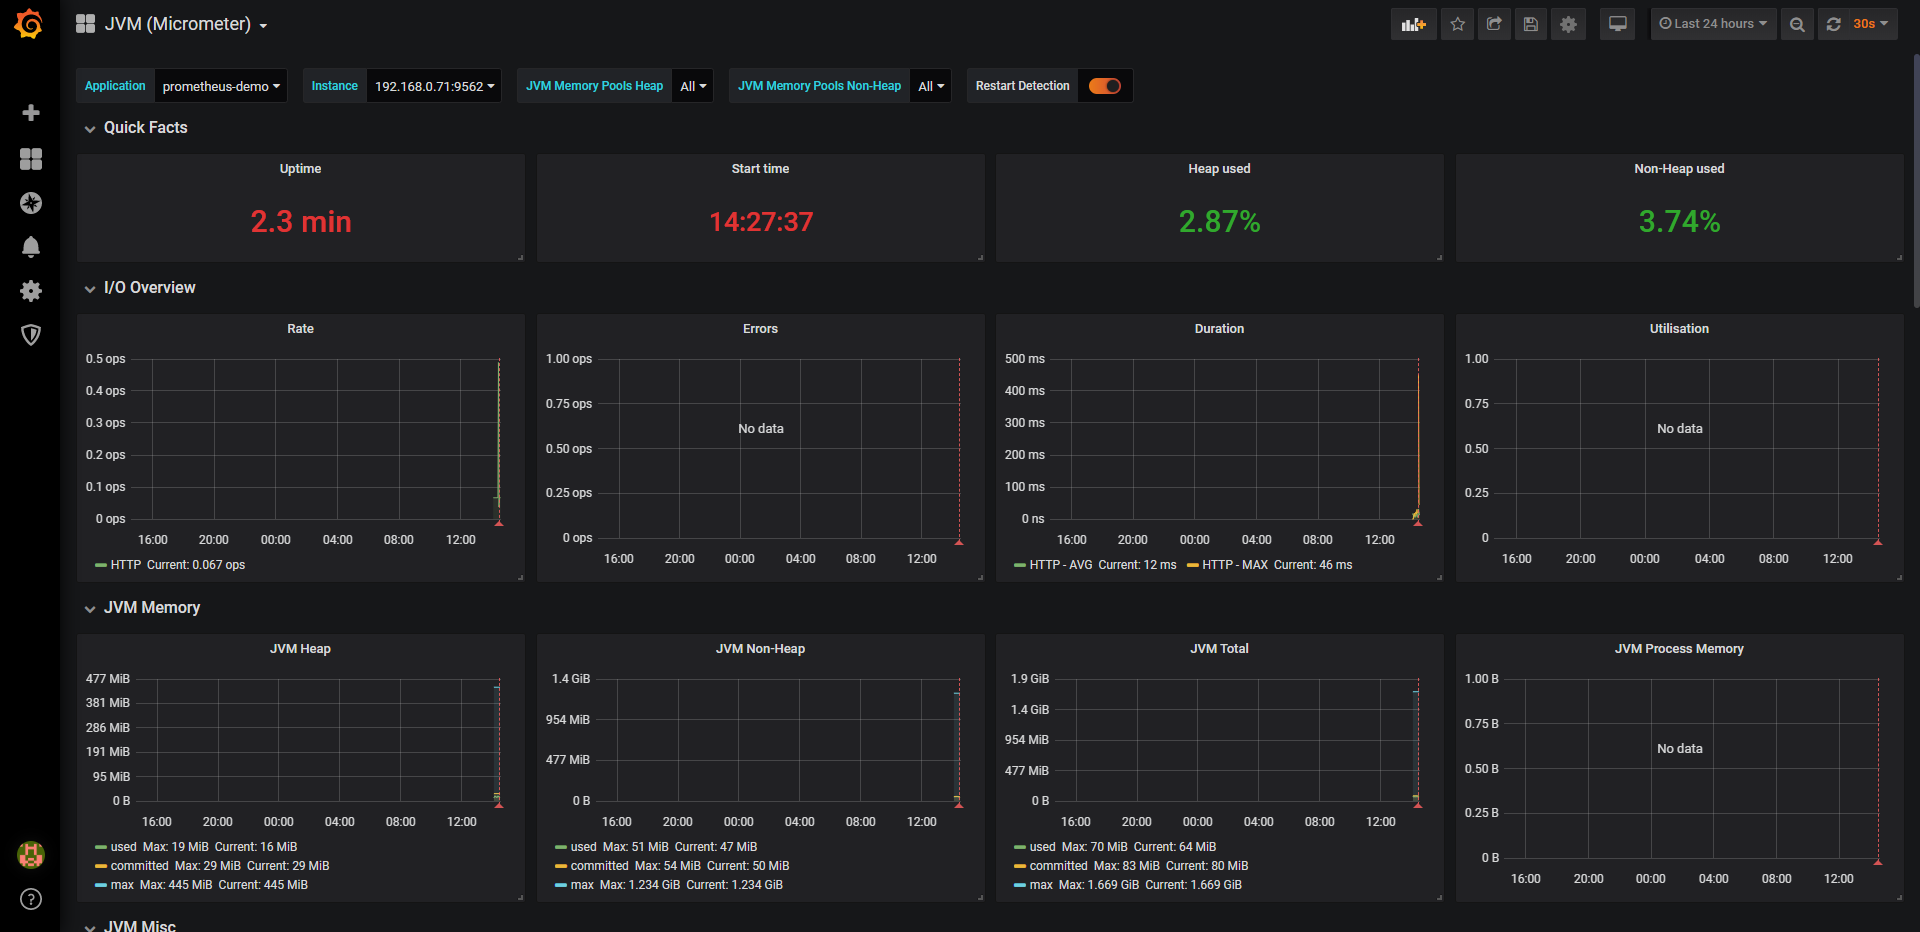
In the options bar above, you can choose to view different services/applications:
In addition, there are some useful Dashboard s that you can find out for yourself without further discussion here: