
Quantitative strategy development, high-quality community, trading idea sharing and other related contents
"Know the game, break the game"
Hello, I'm the Ukrainian swordsman.
The last strategy of this month came. The small partners in the group mentioned whether they could write an arbitrage strategy before. OK, in this issue, we will develop an arbitrage strategy. There are many theories of arbitrage strategy, such as distance method, cointegration method, random spread method, time series method and so on. The most important one is the equilibrium relationship. However, I'm not going to list a lot of mathematical formulas because I can't. But adhere to the consistent style of squirrel kuanke: 0 to 1, strategy landing.
OK, get down to business. I chose YP of oil as the target of arbitrage, because in the early years, the company mainly focused on agricultural products, and three oils and two meals are relatively familiar. There are many band opportunities for agricultural products, especially oil meal. There are always 3-4 bands every year. If your CTA strategy does not perform well in this section, it is normal. Few CTA strategies with good performance can compete with black chemical industry, which has a lot to do with variety characteristics. Let's take a look at YP's arbitrage spread chart (15 minute chart):

This is the price difference change since 15 years. Although it is messy, it still follows the equilibrium relationship;

The mean regression characteristic of price spread is obvious. The upper limit of percentile calculation is about 1200 and the lower limit is about 500. Our profitable place is within the range. How to grasp this part of profit is the key to strategic profit. As for fish head and fish tail, let's not rob them.
First up strategy:
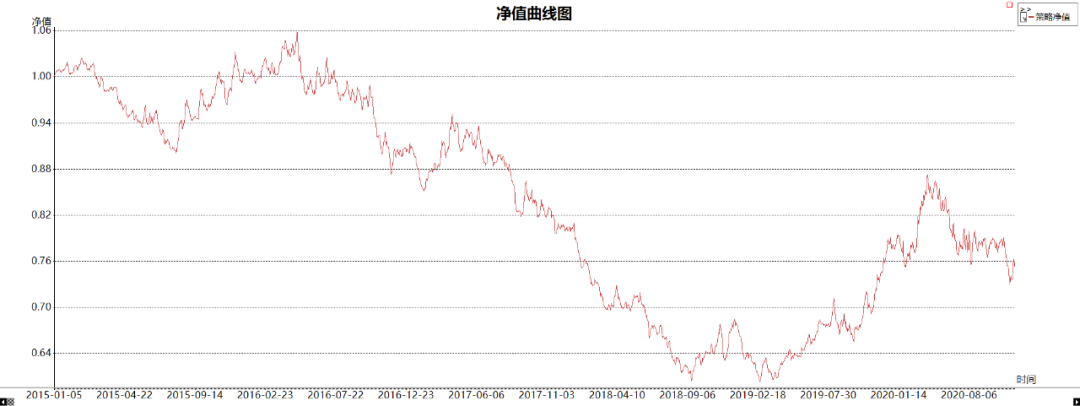
Sorry, I didn't expect that the strategy that performs well in other varieties is this virtue. In Taiyuan dialect, it is called seeking flax wipe. It doesn't matter. I am afraid that we will not change our strategy.
Let's return to the figure of price difference:

Our goal is to eat the fish, but we found that the fish has too many "thorns", and the size is uneven, which is not easy to remove. Disorderly price noise hinders us from earning profits from major trends, which is also the reason for the poor performance of the strategy, so the focus is on filtering.
filter
Keep the opening and closing conditions and parameters of the original strategy unchanged, and add the calculation formula of Volatility:
//For value1 = 1 to R1 / / {if (value1 = = 1) NTD1 = 0; if (JC [value1] < = HH) NTD1 = NTD1 + (HH - JC [value1]); if (JC [value1] > = LL) NTD1 = NTD1 + (JC [value1] - ll);} For value1 = 1 To R1*2 // { If(value1==1)NTD2=0; If (JC[value1] <= HH2 ) NTD2 = NTD2 + (HH2 - JC[value1]); If (JC[value1] >= LL2 ) NTD2 = NTD2 + (JC[value1] - LL2); } // Volatility calculation N1 = (NTD1 / JC) / summary ((NTD1 / JC), R1); N2=(NTD2/JC)/Summation((NTD2/JC),R1);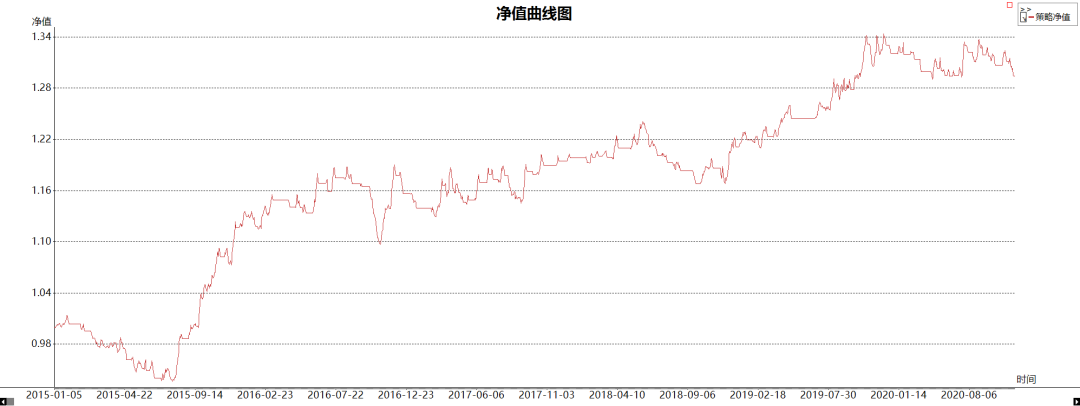
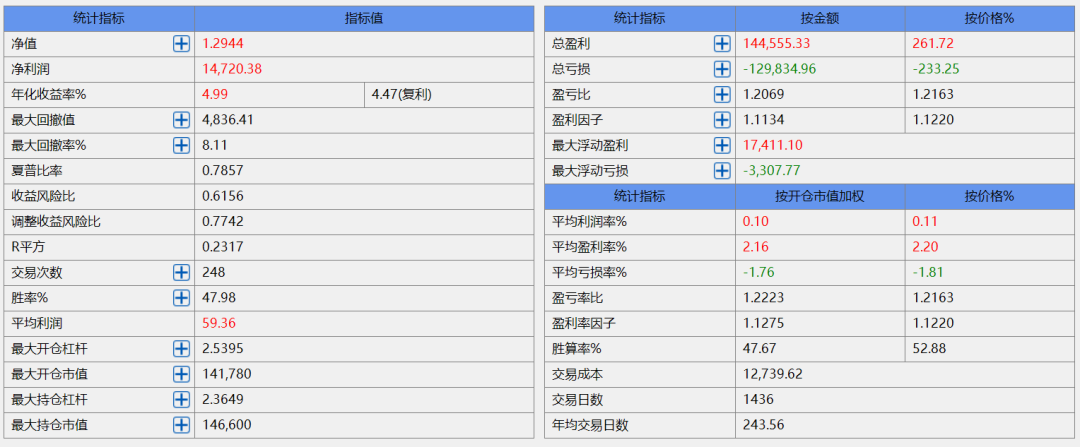

In the strategy code, price theft prevention has been done. In the middle is the price difference chart plus the condition line of opening and closing positions. From the test report, the effect has been greatly improved. However, it has not met my expectations. We can see from the performance chart that there has been no record high in 16 to 19 years and it is in the retreat period. This will not work. Now let's take a look at the market during this period:

Although the market has had several smooth bands during this period, it is mainly short wave reciprocating.
How to change? My first thought is whether the conditions for closing positions can be more flexible.
Second Edition
Add adaptive closing parameters:
if(CurrentBar>barN) { if(ATRN[1]>SY) //When the volatility is greater than the upper limit, Volatility tends to overheat {if (Atrn [1] > Atrn [2]) //The continuous amplification of volatility indicates that the trend is accelerating and the market fluctuation is increasing. The moving interference stop parameters also increase to avoid being thrown out// If the volatility is greater than SY, but the volatility begins to weaken, it indicates that the market may enter pullback or shock. At this time, TRS parameters will not continue to increase, that is, protect profits; { TRS=TRS+X; TRS=Min(TRS,200); } } If (Atrn [1] < XY) / / when the volatility is less than the lower limit, the volatility gradually shrinks. { if(ATRN[1]<ATRN[2]) //The volatility of the market is fluctuating, or there is no obvious trend of contraction. Moving profit stop parameters are also reduced to avoid excessive losses in the volatile market due to slow parameters// If the volatility is less than XY, but the volatility begins to strengthen, it indicates that the market may enter the trend or band. At this time, the TRS parameter will not continue to decrease, that is, protect the position; { TRS=TRS-X; TRS=Max(TRS,100); } } BarN=CurrentBar; }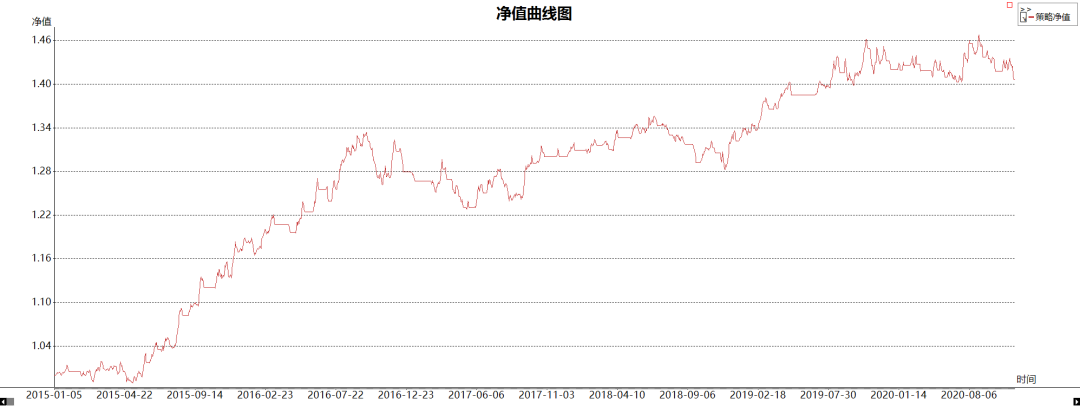
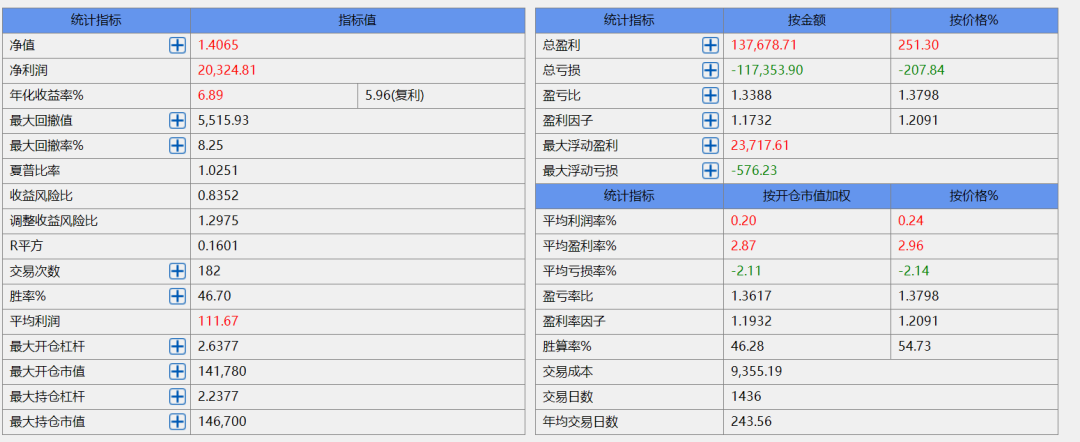
First, make repeated adjustments within the sample of 16-19 years, and then check the universality outside the sample to avoid using too optimal parameters. I found that after adding parameter adaptation, the overall strategy performance was improved, and the net value ranged from 1.2 to 1.4. However, the period of 16-19 years has not been handled well. The problem may not be the playing conditions. What should we do?
Third Edition
Change the entry conditions, use the peaks and troughs in the service cycle, and replace it with ER noise filtering:
filter=EffRatio>P ; //ER filtering noise reduction / / plotnumeric ("effratio", effratio * 100); Commentary("EffRatio"+Text(EffRatio)); Commentary("ATR"+Text(ATR)); SH=SwingHigh(1,JC,X,N);// Calculate wave crest SL=SwingLow(1,JC,X,N)// Calculate the trough if (SH > 0) plotnumeric ("sh", SH); if(SL>0)PlotNumeric("SL",SL);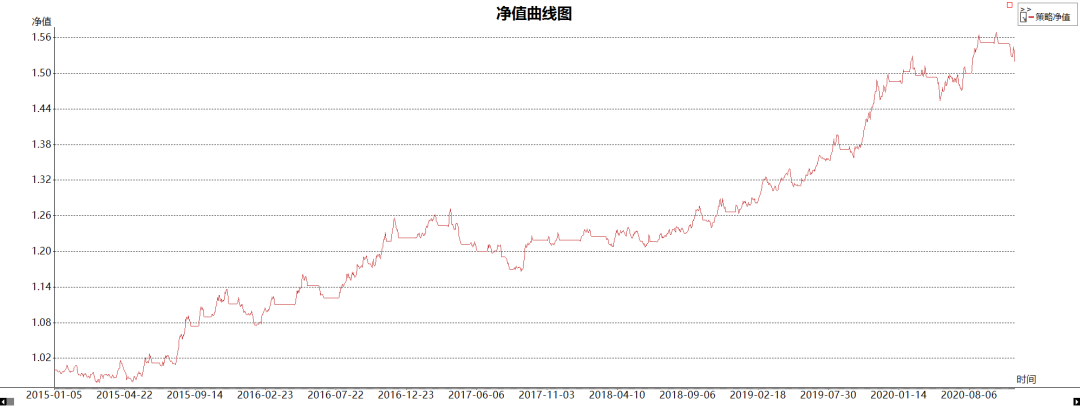
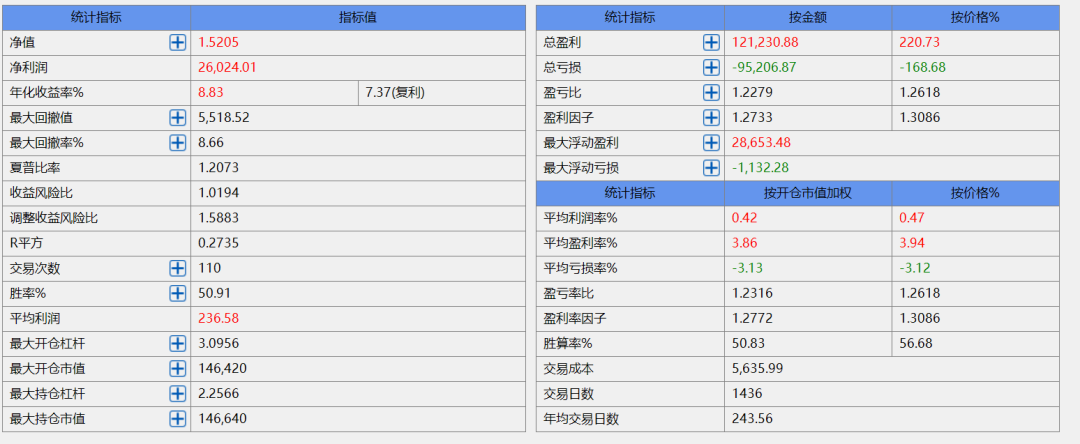
After changing the opening conditions and adding ER filter, the performance has increased significantly. The withdrawal period we are concerned about is shortened from July 2016 to 2019 to December 2016 to September 18. Although there was no profit during this period, the profits in other periods increased a lot. In the opening conditions, the upper and lower limits mentioned at the beginning of the article are also added. If it is lower than the lower limit, it will not open empty, and if it is higher than the upper limit, it will not open much. As for this point, it is based on the fundamental statistics done in the company before, and it is also related to the substitution between varieties. This is also the reason why arbitrage follows the equilibrium relationship. In fact, the downward space of the price difference is limited, and the upward space may exceed expectations, so it is not a symmetrical relationship. When we are in the extreme position, we should not trade with the trend, and the really valuable market is in the region.
Policy source package:
This strategy is only used for learning and communication, and the profit and loss of firm trading is the responsibility of the investor.