Linux command class
tail
The most commonly used tail -f
tail -300f shopbase.log #Count down 300 lines and enter the real-time listening file writing mode
grep
grep forest f.txt     #File lookup
grep forest f.txt cpf.txt #Multi file lookup
grep 'log' /home/admin -r -n #Find all files that match the keyword in the directory
cat f.txt | grep -i shopbase
grep 'shopbase' /home/admin -r -n --include *.{vm,java} #Specify file suffix
grep 'shopbase' /home/admin -r -n --exclude *.{vm,java} #Inverse matching
seq 10 | grep 5 -A 3    #Upper match
seq 10 | grep 5 -B 3    #Lower matching
seq 10 | grep 5 -C 3    #Match up and down. It's OK to use this at ordinary times
cat f.txt | grep -c 'SHOPBASE'
awk
1 basic command
awk '{print $4,$6}' f.txt
awk '{print NR,$0}' f.txt cpf.txt
awk '{print FNR,$0}' f.txt cpf.txt
awk '{print FNR,FILENAME,$0}' f.txt cpf.txt
awk '{print FILENAME,"NR="NR,"FNR="FNR,"$"NF"="$NF}' f.txt cpf.txt
echo 1:2:3:4 | awk -F: '{print $1,$2,$3,$4}'
2 matching
awk '/ldb/ {print}' f.txt   #Match ldb
awk '!/ldb/ {print}' f.txt  #Mismatched ldb
awk '/ldb/ && /LISTEN/ {print}' f.txt   #Match ldb and LISTEN
awk '$5 ~ /ldb/ {print}' f.txt #The fifth column matches ldb
3 built in variables
NR:NR refers to the number of data read according to the record separator after the execution of awk. The default record separator is line feed, so the default is the number of data rows read. NR can be understood as the abbreviation of Number of Record.
FNR: when awk processing multiple input files, after the first file is processed, the NR does not start from 1, but continues to accumulate. Therefore, FNR appears. Whenever a new file is processed, the FNR counts from 1. FNR can be understood as File Number of Record.
NF: NF indicates the number of fields divided by the current record. NF can be understood as Number of Field.
find
sudo -u admin find /home/admin /tmp /usr -name \*.log(Multiple directories)
find . -iname \*.txt(Match case)
find . -type d(All subdirectories under the current directory)
find /usr -type l(All symbolic links in the current directory)
find /usr -type l -name "z*" -ls(More about symbolic links eg:inode,catalogue)
find /home/admin -size +250000k(Over 250000 k Of course+Change to-Is less than)
find /home/admin f -perm 777 -exec ls -l {} \; (Query files by permissions)
find /home/admin -atime -1  1 Files accessed within days
find /home/admin -ctime -1  1 Files whose status has changed within days
find /home/admin -mtime -1  1 Documents modified within days
find /home/admin -amin -1  1 Files accessed in minutes
find /home/admin -cmin -1  1 Files whose status has changed in minutes
find /home/admin -mmin -1  1 Files modified within minutes
pgm
Batch query VM shopbase logs that meet the conditions
pgm -A -f vm-shopbase 'cat /home/admin/shopbase/logs/shopbase.log.2017-01-17|grep 2069861630'
top
In addition to looking at some basic information, the rest of top is to cooperate to query various problems of vm
ps -ef | grep java
top -H -p pid
After the thread is converted from hexadecimal to hexadecimal, jstack grabs it to see what the thread is doing
Java commands
jps
sudo -u admin /opt/taobao/java/bin/jps -mlvV

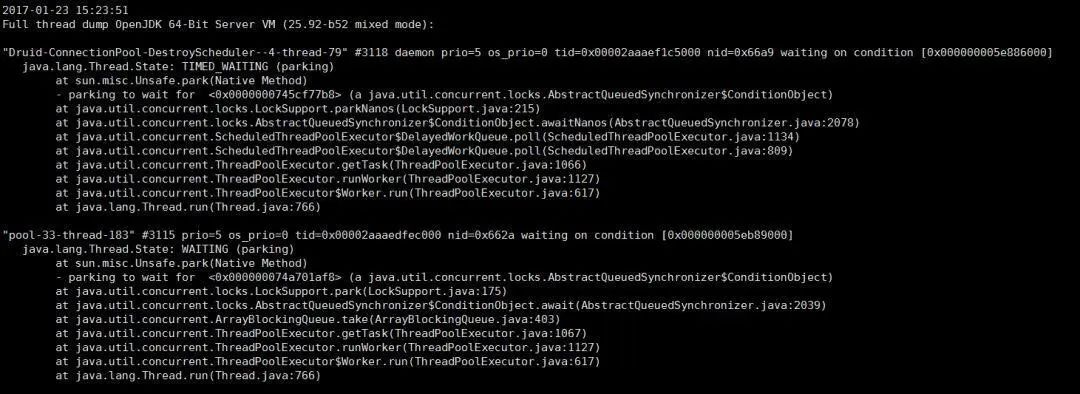
jstack
Common usage:
sudo -u admin /opt/taobao/install/ajdk-8_1_1_fp1-b52/bin/jstack 2815
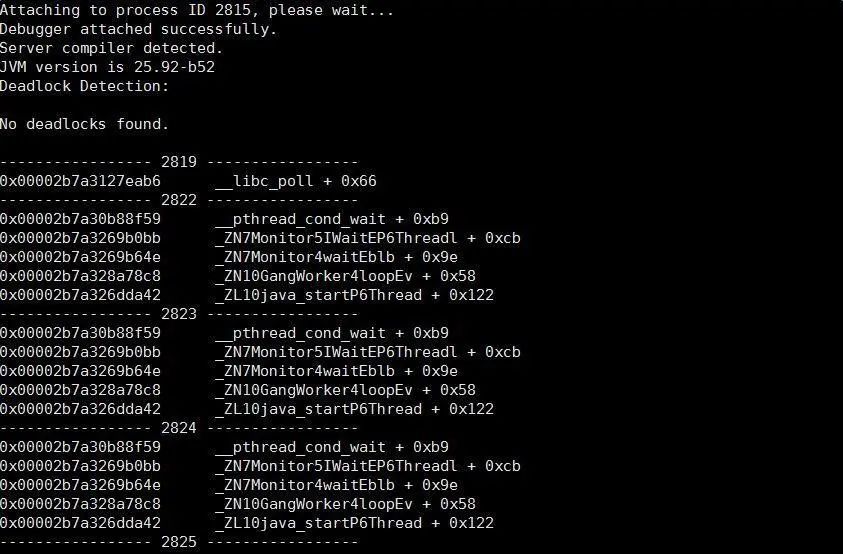
native+java stack:
sudo -u admin /opt/taobao/install/ajdk-8_1_1_fp1-b52/bin/jstack -m 2815
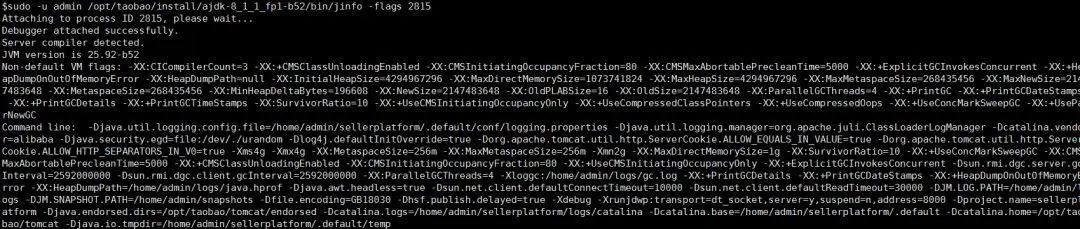
jinfo
You can see the system startup parameters as follows
sudo -u admin /opt/taobao/install/ajdk-8_1_1_fp1-b52/bin/jinfo -flags 2815
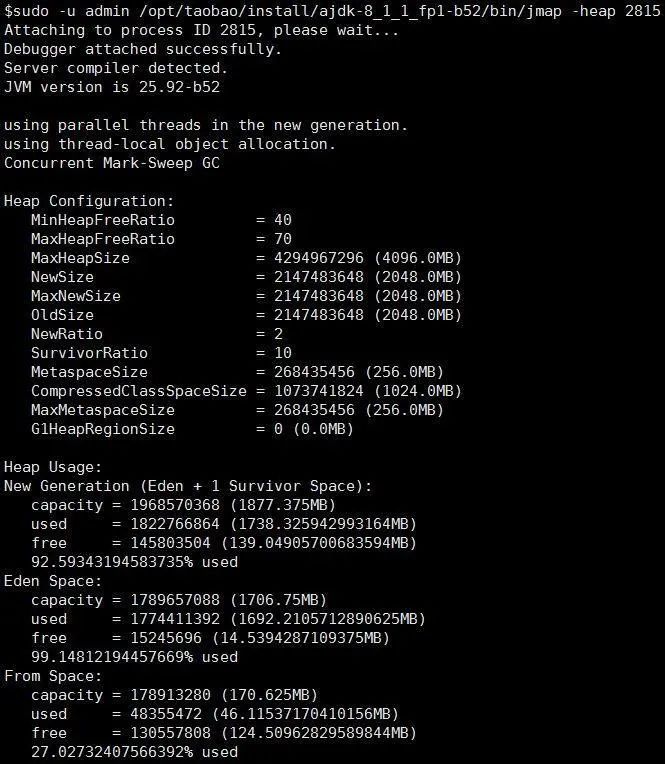
jmap
Two purposes
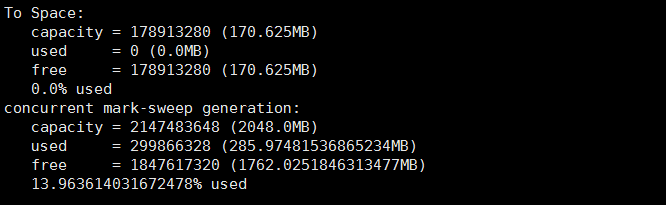
1. Check the heap
sudo -u admin /opt/taobao/install/ajdk-8_1_1_fp1-b52/bin/jmap -heap 2815
2.dump
sudo -u admin /opt/taobao/install/ajdk-8_1_1_fp1-b52/bin/jmap -dump:live,format=b,file=/tmp/heap2.bin 2815
perhaps
sudo -u admin /opt/taobao/install/ajdk-8_1_1_fp1-b52/bin/jmap -dump:format=b,file=/tmp/heap3.bin 2815
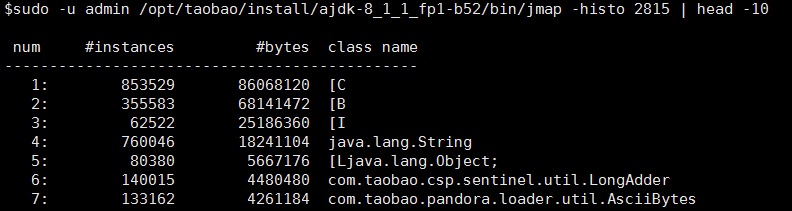
3. Look who occupied the pile? With zprofiler and btrace, troubleshooting is like a tiger's wings
sudo -u admin /opt/taobao/install/ajdk-8_1_1_fp1-b52/bin/jmap -histo 2815 | head -10
jstat
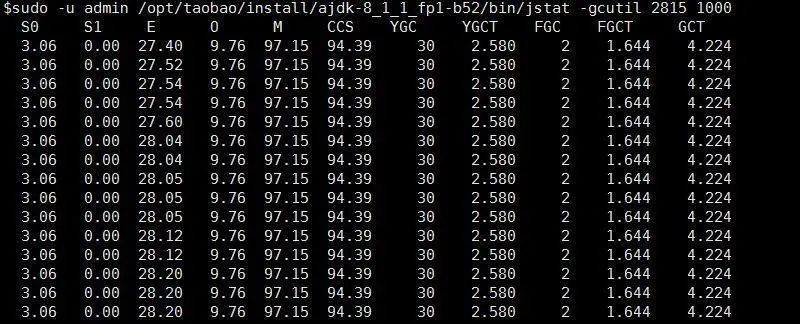
There are many jstat parameters, but one is enough
sudo -u admin /opt/taobao/install/ajdk-8_1_1_fp1-b52/bin/jstat -gcutil 2815 1000
jdb
Today, jdb is often used. jdb can be used to pre send debug, assuming that you pre send java_home is / opt/taobao/java /, and the remote debugging port is 8000. Then sudo -u admin /opt/taobao/java/bin/jdb -attach 8000
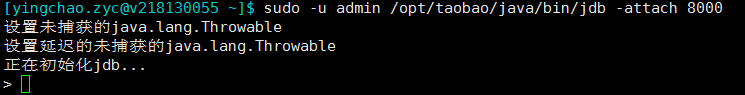
The above indicates that JDB is started successfully. You can set breakpoints for debugging later. See the official description of Oracle for specific parameters http://docs.oracle.com/javase/7/docs/technotes/tools/windows/jdb.html
maven helper
A good helper for analyzing maven's dependence.
VM options
- Which file is your class loaded from?
-XX:+TraceClassLoading The result is as follows[Loaded java.lang.invoke.MethodHandleImpl$Lazy from D:\programme\jdk\jdk8U74\jre\lib\rt.jar]
- The application hung the output dump file
-XX:+HeapDumpOnOutOfMemoryError -XX:HeapDumpPath=/home/admin/logs/java.hprof Group vm This option is basically available in the parameters
jar package conflict
mvn dependency:tree > ~/dependency.txt
Hit all dependencies
mvn dependency:tree -Dverbose -Dincludes=groupId:artifactId
Only the dependencies of the specified groupId and artifactId are displayed
-XX:+TraceClassLoading
vm startup script is added. The details of the loaded class can be seen in the tomcat startup script
-verbose
vm startup script is added. The details of the loaded class can be seen in the tomcat startup script
greys:sc
The sc command of greys can also clearly see where the current class is loaded from
other
dmesg
If you find that your java process has quietly disappeared without leaving any clues, dmesg is likely to have what you want
sudo dmesg|grep -i kill|less
Find the keyword oom_killer. The results found are similar to the following:
[6710782.021013] java invoked oom-killer: gfp_mask=0xd0, order=0, oom_adj=0, oom_scoe_adj=0[6710782.070639] [<ffffffff81118898>] ? oom_kill_process+0x68/0x140 [6710782.257588] Task in /LXC011175068174 killed as a result of limit of /LXC011175068174 [6710784.698347] Memory cgroup out of memory: Kill process 215701 (java) score 854 or sacrifice child [6710784.707978] Killed process 215701, UID 679, (java) total-vm:11017300kB, anon-rss:7152432kB, file-rss:1232kB
The above shows that the corresponding java process was killed by the system's oom killer, with a score of 854. Explain the oom killer (out of memory killer), which will monitor the memory resource consumption of the machine. Before the machine runs out of memory, the mechanism will scan all processes (calculated according to certain rules, memory occupation, time, etc.), select the process with the highest score, and then kill it to protect the machine.
Dmesg log time conversion formula: log actual time = Greenwich 1970-01-01 + (current time seconds - seconds since system startup + log time printed by dmesg) seconds:
date -d "1970-01-01 UTC `echo "$(date +%s)-$(cat /proc/uptime|cut -f 1 -d' ')+12288812.926194"|bc ` seconds"
The rest is to see why the memory is so large that the oom killer is triggered.