Introduction to debuggerd
Android The system comes with a practical program to diagnose abnormal exit daemon
Debuggerd. This process can detect program crash and output process status information when crash to file and serial port for developers to analyze and debug. Debuggerd's data is stored in the / data/tombstone / directory and can hold 10 files. When more than 10 files are saved, it overwrites the earliest produced files. In the serial port, we use DEBUG tag directly to output logcat information. Linux kernel has its own signaling mechanism. When an application crashes, the system kernel usually sends a signal to the process in question to notify it of any abnormalities. These processes can capture these signals and process them accordingly. Usually for the processing of abnormal program signals, it is exit. Android implements a more practical function in this mechanism: intercept these signals, dump process information for debugging.
Operation principle of debuggerd
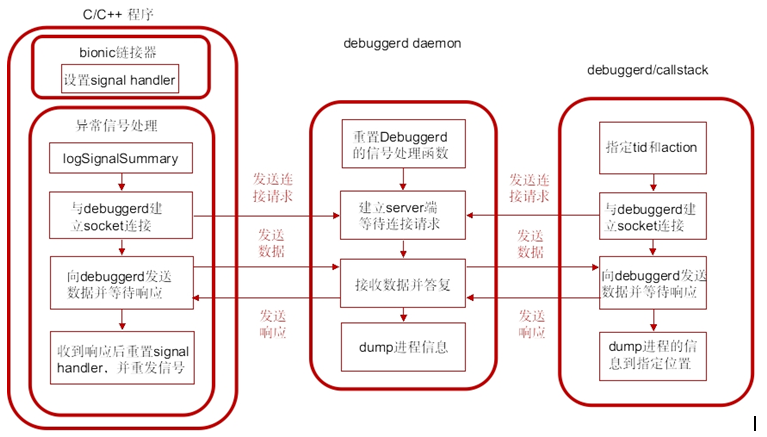
Debuggerd creates a socket named "Android:debuggerd", which serves as a server to wait for the connection of other client-side processes. It receives the TID and action information sent by client-side processes, which will be run by the process specified by tid. According to the action dump specified by action, it can be used as debuggerd in the file or console. There are several main processes on the client side:
1. Exceptional C/C++ program
This program is installed by linker of bionic. When the program generates abnormal signal, it enters the signal processing function and is established with debuggerd.
2. debuggerd program
Debuggerd can be started in the console with the command debuggerd-b [<tid>] and then connected to debuggerd daemon. In this way, debuggerd can dump the process information specified by TID without interrupting the process execution.
3. dumpstate
The command dumpstate is run in the console and the necessary parameters are specified. The command calls dump_backtrace_to_file to interact with debuggerd.
Use of debuggerd
After the C/C++ program which generates abnormal signals is connected with debuggerd, debuggerd saves the process information dump into tombstone_XX file to / data/tombstone/folder. The stack information of the exception process can be analyzed by viewing tombstone_XX.
Start in the console with the command debuggerd-b [<tid>]. If the - b parameter is added, the process information specified by TID will dump to the console, otherwise dump to the tombstone file. The command callstack/dumpstate is run in the console, and the process information is written to the files specified by the two commands.
Application exception handling process
Application portals are part of the bionic implementation and are valid for all android applications. After the application entry address _start, _linker_init calls debugger_init() function to register exception signal handler to intercept several singal: SIGILL,SIGABRT, SIGBUS, SIGFPE,SIGSEGV and SIGPIPE:
linker/arch/arm/begin.S
-
start:
-
mov r0, sp
-
mov r1, #0
-
bl __linker_init
bionic\linker\ Linker.cpp
-
extern "C" Elf32_Addr __linker_init(void* raw_args) {
-
...
-
Elf32_Addr start_address = __linker_init_post_relocation(args, linker_addr);
-
set_soinfo_pool_protection(PROT_READ);
-
-
return start_address;
-
}
-
static Elf32_Addr __linker_init_post_relocation(KernelArgumentBlock& args, Elf32_Addr linker_base) {
-
...
-
debuggerd_init();
-
...
-
}
bionic\linker\Debugger.c
-
void debugger_init()
-
{
-
struct sigaction act;
-
memset(&act, 0, sizeof(act));
-
act.sa_sigaction = debugger_signal_handler;
-
act.sa_flags = SA_RESTART | SA_SIGINFO;
-
sigemptyset(&act.sa_mask);
-
sigaction(SIGILL, &act, NULL);
-
sigaction(SIGABRT, &act, NULL);
-
sigaction(SIGBUS, &act, NULL);
-
sigaction(SIGFPE, &act, NULL);
-
sigaction(SIGSEGV, &act, NULL);
-
sigaction(SIGSTKFLT, &act, NULL);
-
sigaction(SIGPIPE, &act, NULL);
-
}
The linker in the bionic library sets Handler(debugger_signal_handler) for the following seven signals:
- SIGILL (Illegal Instruction Exception)
- SIGABRT(abort exit exception)
- SIGBUS (hardware access exception)
- SIGFPE (Floating Point Abnormal)
- SIGSEGV (memory access exception)
- SIGSTKFLT (Coprocessor Stack Exception)
- SIGPIPE (Pipeline Abnormality)
The meaning of act.sa_flags = SA_RESTART | SA_SIGINFO in debugger_init:
1) SA_RESTART
If this parameter is specified, it means that if the signal interrupts a system call of the process, the system automatically starts the system call. If this parameter is not specified, the interrupted system call fails to return with the error code EINTR. This flag bit is only used to handle slow system calls (system calls that may be blocked). For example, calling write system call to write a device is blocked, when the process captures a signal and enters the corresponding signal processing function to return, the system call may return ENINTR error. When this parameter is specified, the system call is restarted, and the completion of the write operation can be guaranteed by using the RETRY_ON_EINTR macro.
2) SA_SIGINFO
If this parameter is specified, the parameter (siginfo_t structure) that represents the signal can be transferred to the signal processing function.
When the C/C++ program linked to the bionic library crashes, the kernel sends the corresponding signal, and when the process receives the abnormal signal, it transfers to the debugger_signal_handler function for processing.
-
void debugger_signal_handler(int n, siginfo_t* info, void* unused)
-
{
-
char msgbuf[128];
-
unsigned tid;
-
int s;
-
-
logSignalSummary(n, info);
-
-
tid = gettid();
-
-
s = socket_abstract_client(DEBUGGER_SOCKET_NAME, SOCK_STREAM);
-
-
if (s >= 0) {
-
-
-
-
-
-
int ret;
-
debugger_msg_t msg;
-
msg.action = DEBUGGER_ACTION_CRASH;
-
msg.tid = tid;
-
RETRY_ON_EINTR(ret, write(s, &msg, sizeof(msg)));
-
if (ret == sizeof(msg)) {
-
-
-
RETRY_ON_EINTR(ret, read(s, &tid, 1));
-
int savedErrno = errno;
-
notify_gdb_of_libraries();
-
errno = savedErrno;
-
}
-
-
if (ret < 0) {
-
-
format_buffer(msgbuf, sizeof(msgbuf),
-
"Failed while talking to debuggerd: %s", strerror(errno));
-
__libc_android_log_write(ANDROID_LOG_FATAL, "libc", msgbuf);
-
}
-
-
close(s);
-
} else {
-
-
format_buffer(msgbuf, sizeof(msgbuf),
-
"Unable to open connection to debuggerd: %s", strerror(errno));
-
__libc_android_log_write(ANDROID_LOG_FATAL, "libc", msgbuf);
-
}
-
-
-
signal(n, SIG_DFL);
-
-
-
-
-
-
-
-
-
switch (n) {
-
case SIGABRT:
-
case SIGFPE:
-
case SIGPIPE:
-
case SIGSTKFLT:
-
(void) tgkill(getpid(), gettid(), n);
-
break;
-
default:
-
break;
-
}
-
}
debugger_signal_handler function processing flow:
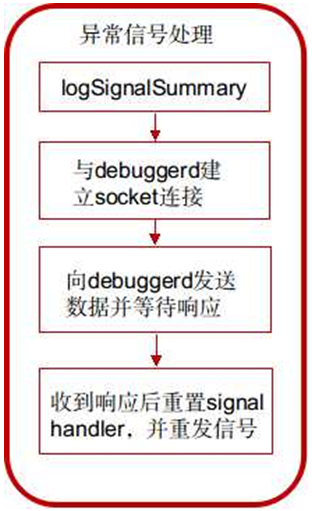
1) Call logSignalSummary to write the signal information to the file;
-
static void logSignalSummary(int signum, const siginfo_t* info)
-
{
-
char buffer[128];
-
char threadname[MAX_TASK_NAME_LEN + 1];
-
char* signame;
-
switch (signum) {
-
case SIGILL: signame = "SIGILL"; break;
-
case SIGABRT: signame = "SIGABRT"; break;
-
case SIGBUS: signame = "SIGBUS"; break;
-
case SIGFPE: signame = "SIGFPE"; break;
-
case SIGSEGV: signame = "SIGSEGV"; break;
-
case SIGSTKFLT: signame = "SIGSTKFLT"; break;
-
case SIGPIPE: signame = "SIGPIPE"; break;
-
default: signame = "???"; break;
-
}
-
-
if (prctl(PR_GET_NAME, (unsigned long)threadname, 0, 0, 0) != 0) {
-
strcpy(threadname, "<name unknown>");
-
} else {
-
-
-
threadname[MAX_TASK_NAME_LEN] = 0;
-
}
-
format_buffer(buffer, sizeof(buffer),
-
"Fatal signal %d (%s) at 0x%08x (code=%d), thread %d (%s)",
-
signum, signame, info->si_addr, info->si_code, gettid(), threadname);
-
-
__libc_android_log_write(ANDROID_LOG_FATAL, "libc", buffer);
-
}
Get the name of the exception signal and the thread name, and format the string. Call the function _libc_android_log_write to write in "/dev/log/main".
2) Call socket_abstract_client function to establish socket connection with debuggerd.
-
s = socket_abstract_client(DEBUGGER_SOCKET_NAME, SOCK_STREAM);
3) If the connection is successfully established, the debugger_msg_t structure is set up and sent to debuggerd.
-
msg.action = DEBUGGER_ACTION_CRASH;
-
msg.tid = tid;
-
RETRY_ON_EINTR(ret, write(s, &msg, sizeof(msg)));
4) Waiting for debuggerd's reply, blocking the call below, and then executing the following process after receiving the reply;
-
RETRY_ON_EINTR(ret, read(s, &tid, 1));
5) To reset the signal processing function to SIG_DFL, that is, to take the default action;
6) Re-send the signal. When the process returns from the current signal processing function, it will process the signal and perform the default signal processing action, i.e. interrupt the process.
Source code analysis of debuggerd
1. Start in deamon mode in init process, in init.rc
-
service debuggerd /system/bin/debuggerd
-
class main
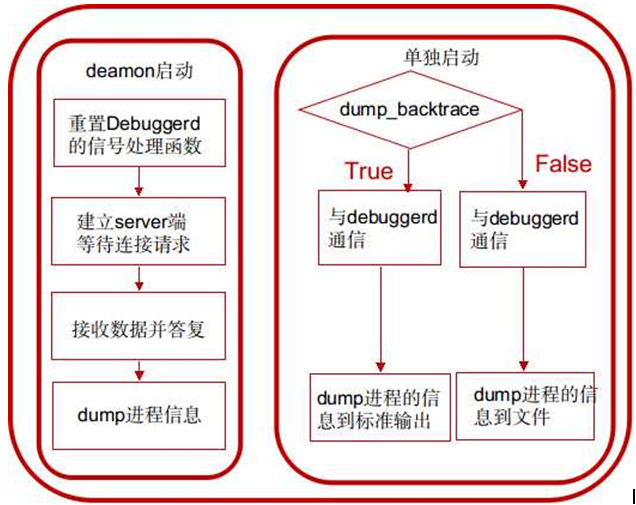
If started in this way, after entering the main function, the do_server function will be invoked as a service to provide dump process information for other processes on the server side.
2. To run the system/bin/debuggerd executable directly, you need to specify parameters.
Starting in this way, after entering the main function, the do_explicit_dump function is called to communicate with debuggerd daemon, and the information of the specified process is dump to the file or console.
Service startup mode
-
int main(int argc, char** argv) {
-
if (argc == 1) {
-
return do_server();
-
}
-
}
When the number of parameters passed by the debuggerd process is 1, the debuggerd started at this time will be used as a background service process, which receives the application abnormal exit message and generates tombstone.
-
static int do_server() {
-
int s;
-
struct sigaction act;
-
int logsocket = -1;
-
-
-
-
-
-
signal(SIGILL, SIG_DFL);
-
signal(SIGABRT, SIG_DFL);
-
signal(SIGBUS, SIG_DFL);
-
signal(SIGFPE, SIG_DFL);
-
signal(SIGSEGV, SIG_DFL);
-
signal(SIGPIPE, SIG_IGN);
-
signal(SIGSTKFLT, SIG_DFL);
-
-
logsocket = socket_local_client("logd",
-
ANDROID_SOCKET_NAMESPACE_ABSTRACT, SOCK_DGRAM);
-
if(logsocket < 0) {
-
logsocket = -1;
-
} else {
-
fcntl(logsocket, F_SETFD, FD_CLOEXEC);
-
}
-
-
act.sa_handler = SIG_DFL;
-
sigemptyset(&act.sa_mask);
-
sigaddset(&act.sa_mask,SIGCHLD);
-
act.sa_flags = SA_NOCLDWAIT;
-
sigaction(SIGCHLD, &act, 0);
-
-
s = socket_local_server(DEBUGGER_SOCKET_NAME,
-
ANDROID_SOCKET_NAMESPACE_ABSTRACT, SOCK_STREAM);
-
if(s < 0) return 1;
-
fcntl(s, F_SETFD, FD_CLOEXEC);
-
-
LOG("debuggerd: " __DATE__ " " __TIME__ "\n");
-
-
-
(void)check_corefile_limit();
-
-
for(;;) {
-
struct sockaddr addr;
-
socklen_t alen;
-
int fd;
-
alen = sizeof(addr);
-
XLOG("waiting for connection\n");
-
fd = accept(s, &addr, &alen);
-
if(fd < 0) {
-
XLOG("accept failed: %s\n", strerror(errno));
-
continue;
-
}
-
-
fcntl(fd, F_SETFD, FD_CLOEXEC);
-
-
handle_request(fd);
-
}
-
return 0;
-
}
1. Ignore debuggerd's own crash processing;
2. Establish server side of socket communication;
3. Enter an infinite loop, wait for and receive client process connection requests, and process requests through handle_request() function;
handle_request
-
static void handle_request(int fd) {
-
XLOG("handle_request(%d)\n", fd);
-
-
debugger_request_t request;
-
int status = read_request(fd, &request);
-
if (!status) {
-
XLOG("BOOM: pid=%d uid=%d gid=%d tid=%d\n",
-
request.pid, request.uid, request.gid, request.tid);
-
-
-
-
-
-
-
-
-
-
-
-
-
if (ptrace(PTRACE_ATTACH, request.tid, 0, 0)) {
-
LOG("ptrace attach failed: %s\n", strerror(errno));
-
} else {
-
bool detach_failed = false;
-
bool attach_gdb = should_attach_gdb(&request);
-
if (TEMP_FAILURE_RETRY(write(fd, "\0", 1)) != 1) {
-
LOG("failed responding to client: %s\n", strerror(errno));
-
} else {
-
char* tombstone_path = NULL;
-
-
if (request.action == DEBUGGER_ACTION_CRASH) {
-
close(fd);
-
fd = -1;
-
}
-
-
int total_sleep_time_usec = 0;
-
for (;;) {
-
int signal = wait_for_signal(request.tid, &total_sleep_time_usec);
-
if (signal < 0) {
-
break;
-
}
-
-
switch (signal) {
-
case SIGSTOP:
-
if (request.action == DEBUGGER_ACTION_DUMP_TOMBSTONE) {
-
XLOG("stopped -- dumping to tombstone\n");
-
tombstone_path = engrave_tombstone(request.pid, request.tid,
-
signal, true, true, &detach_failed,
-
&total_sleep_time_usec);
-
} else if (request.action == DEBUGGER_ACTION_DUMP_BACKTRACE) {
-
XLOG("stopped -- dumping to fd\n");
-
dump_backtrace(fd, request.pid, request.tid, &detach_failed,
-
&total_sleep_time_usec);
-
} else {
-
XLOG("stopped -- continuing\n");
-
status = ptrace(PTRACE_CONT, request.tid, 0, 0);
-
if (status) {
-
LOG("ptrace continue failed: %s\n", strerror(errno));
-
}
-
continue;
-
}
-
break;
-
-
case SIGILL:
-
case SIGABRT:
-
case SIGBUS:
-
case SIGFPE:
-
case SIGSEGV:
-
case SIGSTKFLT: {
-
XLOG("stopped -- fatal signal\n");
-
-
-
-
-
-
-
kill(request.pid, SIGSTOP);
-
-
-
tombstone_path = engrave_tombstone(request.pid, request.tid,
-
signal, !attach_gdb, false, &detach_failed,
-
&total_sleep_time_usec);
-
break;
-
}
-
-
case SIGPIPE:
-
LOG("socket-client process stopped due to SIGPIPE! \n");
-
break;
-
-
default:
-
XLOG("stopped -- unexpected signal\n");
-
LOG("process stopped due to unexpected signal %d\n", signal);
-
break;
-
}
-
break;
-
}
-
-
if (request.action == DEBUGGER_ACTION_DUMP_TOMBSTONE) {
-
if (tombstone_path) {
-
write(fd, tombstone_path, strlen(tombstone_path));
-
}
-
close(fd);
-
fd = -1;
-
}
-
free(tombstone_path);
-
}
-
-
XLOG("detaching\n");
-
if (attach_gdb) {
-
-
kill(request.pid, SIGSTOP);
-
-
-
if (ptrace(PTRACE_DETACH, request.tid, 0, 0)) {
-
LOG("ptrace detach from %d failed: %s\n", request.tid, strerror(errno));
-
detach_failed = true;
-
}
-
-
-
-
-
-
-
-
wait_for_user_action(request.pid);
-
} else {
-
-
if (ptrace(PTRACE_DETACH, request.tid, 0, 0)) {
-
LOG("ptrace detach from %d failed: %s\n", request.tid, strerror(errno));
-
detach_failed = true;
-
}
-
}
-
-
-
kill(request.pid, SIGCONT);
-
-
-
-
-
if (detach_failed) {
-
LOG("debuggerd committing suicide to free the zombie!\n");
-
kill(getpid(), SIGKILL);
-
}
-
}
-
-
}
-
if (fd >= 0) {
-
close(fd);
-
}
-
}
1) Call the read_request function to read the data sent by the client-side process:
-
static int read_request(int fd, debugger_request_t* out_request) {
-
struct ucred cr;
-
int len = sizeof(cr);
-
int status = getsockopt(fd, SOL_SOCKET, SO_PEERCRED, &cr, &len);
-
if (status != 0) {
-
LOG("cannot get credentials\n");
-
return -1;
-
}
-
-
XLOG("reading tid\n");
-
fcntl(fd, F_SETFL, O_NONBLOCK);
-
-
struct pollfd pollfds[1];
-
pollfds[0].fd = fd;
-
pollfds[0].events = POLLIN;
-
pollfds[0].revents = 0;
-
status = TEMP_FAILURE_RETRY(poll(pollfds, 1, 3000));
-
if (status != 1) {
-
LOG("timed out reading tid\n");
-
return -1;
-
}
-
-
debugger_msg_t msg;
-
status = TEMP_FAILURE_RETRY(read(fd, &msg, sizeof(msg)));
-
if (status < 0) {
-
LOG("read failure? %s\n", strerror(errno));
-
return -1;
-
}
-
if (status != sizeof(msg)) {
-
LOG("invalid crash request of size %d\n", status);
-
return -1;
-
}
-
-
out_request->action = msg.action;
-
out_request->tid = msg.tid;
-
out_request->pid = cr.pid;
-
out_request->uid = cr.uid;
-
out_request->gid = cr.gid;
-
-
if (msg.action == DEBUGGER_ACTION_CRASH) {
-
-
char buf[64];
-
struct stat s;
-
snprintf(buf, sizeof buf, "/proc/%d/task/%d", out_request->pid, out_request->tid);
-
if(stat(buf, &s)) {
-
LOG("tid %d does not exist in pid %d. ignoring debug request\n",
-
out_request->tid, out_request->pid);
-
return -1;
-
}
-
} else if (cr.uid == 0
-
|| (cr.uid == AID_SYSTEM && msg.action == DEBUGGER_ACTION_DUMP_BACKTRACE)) {
-
-
-
status = get_process_info(out_request->tid, &out_request->pid,
-
&out_request->uid, &out_request->gid);
-
if (status < 0) {
-
LOG("tid %d does not exist. ignoring explicit dump request\n",
-
out_request->tid);
-
return -1;
-
}
-
} else {
-
-
return -1;
-
}
-
return 0;
-
}
Read pid uid gid of client process from socket
-
getsockopt(fd, SOL_SOCKET, SO_PEERCRED, &cr, &len);
Polling socket handle
-
struct pollfd pollfds[1];
-
pollfds[0].fd = fd;
-
pollfds[0].events = POLLIN;
-
pollfds[0].revents = 0;
-
status = TEMP_FAILURE_RETRY(poll(pollfds, 1, 3000));
Read debugger_msg_t structure from socket
-
debugger_msg_t msg;
-
status = TEMP_FAILURE_RETRY(read(fd, &msg, sizeof(msg)));
-
if (status < 0) {
-
LOG("read failure? %s\n", strerror(errno));
-
return -1;
-
}
-
if (status != sizeof(msg)) {
-
LOG("invalid crash request of size %d\n", status);
-
return -1;
-
}
-
out_request->action = msg.action;
-
out_request->tid = msg.tid;
-
out_request->pid = cr.pid;
-
out_request->uid = cr.uid;
-
out_request->gid = cr.gid;
If the action set in debugger_msg_t is DEBUGGER_ACTION_CRASH, which indicates that it is a request from crash C/C++ process, then judge whether the incoming tid e is valid.
-
if (msg.action == DEBUGGER_ACTION_CRASH) {
-
-
char buf[64];
-
struct stat s;
-
snprintf(buf, sizeof buf, "/proc/%d/task/%d", out_request->pid, out_request->tid);
-
if(stat(buf, &s)) {
-
LOG("tid %d does not exist in pid %d. ignoring debug request\n",
-
out_request->tid, out_request->pid);
-
return -1;
-
}
-
}
If the action set in debugger_msg_t is DEBUGGER_ACTION_DUMP_BACKTRACE which indicates that it is a request sent by other means (debuggerd), the request must be root or system permissions, and then the effectiveness of the Ted can be judged.
2) After returning from read_request, the ptrace function is called to attach to the process specified by tid, at which time debuggerd becomes the parent of the attache d process, and then the ptrace function sends SIGSTOP signals to the child process to stop the child process. At this point, the parent process has the opportunity to check the value of the child process core image and register.
-
ptrace(PTRACE_ATTACH, request.tid, 0, 0)
3) Call the following statement to reply the message to the client terminal process so that the process on the client terminal can return from the read call.
-
TEMP_FAILURE_RETRY(write(fd, "\0", 1)
4) Wait for the child process to stop in the for loop.
-
int signal = wait_for_signal(request.tid, &total_sleep_time_usec);
5) Subprocesses perform different processing according to different signals and action s received
-
switch (signal) {
-
case SIGSTOP:
-
if (request.action == DEBUGGER_ACTION_DUMP_TOMBSTONE) {
-
XLOG("stopped -- dumping to tombstone\n");
-
tombstone_path = engrave_tombstone(request.pid, request.tid,
-
signal, true, true, &detach_failed,
-
&total_sleep_time_usec);
-
} else if (request.action == DEBUGGER_ACTION_DUMP_BACKTRACE) {
-
XLOG("stopped -- dumping to fd\n");
-
dump_backtrace(fd, request.pid, request.tid, &detach_failed,
-
&total_sleep_time_usec);
-
} else {
-
XLOG("stopped -- continuing\n");
-
status = ptrace(PTRACE_CONT, request.tid, 0, 0);
-
if (status) {
-
LOG("ptrace continue failed: %s\n", strerror(errno));
-
}
-
continue;
-
}
-
break;
-
case SIGILL:
-
case SIGABRT:
-
case SIGBUS:
-
case SIGFPE:
-
case SIGSEGV:
-
case SIGSTKFLT: {
-
XLOG("stopped -- fatal signal\n");
-
kill(request.pid, SIGSTOP);
-
tombstone_path = engrave_tombstone(request.pid, request.tid,
-
signal, !attach_gdb, false, &detach_failed,
-
&total_sleep_time_usec);
-
break;
-
}
-
case SIGPIPE:
-
LOG("socket-client process stopped due to SIGPIPE! \n");
-
break;
-
default:
-
XLOG("stopped -- unexpected signal\n");
-
LOG("process stopped due to unexpected signal %d\n", signal);
-
break;
-
}
Subprocess receives SIGSTOP to indicate that crash does not occur in the process and writes process information to tombstone file according to action.
The sub-process receives seven abnormal signals indicating that the process crash and calls engrave_tombstone to write dump information directly to tombstone.
6) Call ptrace(PTRACE_DETACH, request.tid, 0, 0) to unlock the tracing of child processes;
-
if (attach_gdb) {
-
kill(request.pid, SIGSTOP);
-
if (ptrace(PTRACE_DETACH, request.tid, 0, 0)) {
-
LOG("ptrace detach from %d failed: %s\n", request.tid, strerror(errno));
-
detach_failed = true;
-
}
-
wait_for_user_action(request.pid);
-
} else {
-
if (ptrace(PTRACE_DETACH, request.tid, 0, 0)) {
-
LOG("ptrace detach from %d failed: %s\n", request.tid, strerror(errno));
-
detach_failed = true;
-
}
-
}
If the following instructions are run: adb shell setprop debug.db.uid 10000; then attach_gdb is true when crash occurs for all processes with uid < 10000, the crash process will be stopped, and ptrace(PTRACE_DETACH, request.tid, 0, 0) will be called to unlock the crash process and wait for the GDB connection.
adb forward tcp:5039 tcp:5039
adb shell gdbserver :5039 --attach pid &
By pressing the HOME or VOLUME DOWN button, the user can make the process continue and crash naturally.
When attach_gdb is false, tracing of child processes is only released.
7) Call kill(request.pid, SIGCONT) to restore the stopped child process and let it terminate naturally;
engrave_tombstone
-
char* engrave_tombstone(pid_t pid, pid_t tid, int signal,
-
bool dump_sibling_threads, bool quiet, bool* detach_failed,
-
int* total_sleep_time_usec) {
-
mkdir(TOMBSTONE_DIR, 0755);
-
chown(TOMBSTONE_DIR, AID_SYSTEM, AID_SYSTEM);
-
-
-
dump_creash_maps(pid);
-
-
int fd;
-
char* path = find_and_open_tombstone(&fd);
-
if (!path) {
-
*detach_failed = false;
-
return NULL;
-
}
-
-
log_t log;
-
log.tfd = fd;
-
log.quiet = quiet;
-
*detach_failed = dump_crash(&log, pid, tid, signal, dump_sibling_threads,
-
total_sleep_time_usec);
-
-
close(fd);
-
return path;
-
}
For crash C/C++ process, dump process information is mainly through this function.
1. Create "/ data/tombstones" folder and modify permissions
2. Call function find_and_open_tombstone, tombstone_XX file up to 10, more than the earliest coverage
3. Call dump_crash to dump all information to tombstone file:
☞ dump_build_info(log);
☞ dump_thread_info(log, pid, tid, true);
☞ dump_fault_addr(log, tid, signal);
Dump_thread (context, log, tid, true, total_sleep_time_usec) Context information for dump processes
☞ dump_logs(log, pid, true);
☞ dump_sibling_thread_report(context, log, pid, tid, total_sleep_time_usec);
dump_backtrace
-
void dump_backtrace(int fd, pid_t pid, pid_t tid, bool* detach_failed,
-
int* total_sleep_time_usec) {
-
log_t log;
-
log.tfd = fd;
-
log.quiet = true;
-
-
ptrace_context_t* context = load_ptrace_context(tid);
-
dump_process_header(&log, pid);
-
dump_thread(&log, tid, context, true, detach_failed, total_sleep_time_usec);
-
-
char task_path[64];
-
snprintf(task_path, sizeof(task_path), "/proc/%d/task", pid);
-
DIR* d = opendir(task_path);
-
if (d) {
-
struct dirent debuf;
-
struct dirent *de;
-
while (!readdir_r(d, &debuf, &de) && de) {
-
if (!strcmp(de->d_name, ".") || !strcmp(de->d_name, "..")) {
-
continue;
-
}
-
-
char* end;
-
pid_t new_tid = strtoul(de->d_name, &end, 10);
-
if (*end || new_tid == tid) {
-
continue;
-
}
-
-
dump_thread(&log, new_tid, context, false, detach_failed, total_sleep_time_usec);
-
}
-
closedir(d);
-
}
-
-
dump_process_footer(&log, pid);
-
free_ptrace_context(context);
-
}
☞ dump_process_header(&log, pid);
☞ dump_thread(&log, tid, context, true, detach_failed, total_sleep_time_usec);
☞ dump_process_footer(&log, pid);
Debugging Tools
-
int main(int argc, char** argv) {
-
bool dump_backtrace = false;
-
bool have_tid = false;
-
pid_t tid = 0;
-
for (int i = 1; i < argc; i++) {
-
if (!strcmp(argv[i], "-b")) {
-
dump_backtrace = true;
-
} else if (!have_tid) {
-
tid = atoi(argv[i]);
-
have_tid = true;
-
} else {
-
usage();
-
return 1;
-
}
-
}
-
if (!have_tid) {
-
usage();
-
return 1;
-
}
-
return do_explicit_dump(tid, dump_backtrace);
-
}
Through do_explicit_dump function dump, the stack information of the specified process can be obtained.
-
static int do_explicit_dump(pid_t tid, bool dump_backtrace) {
-
fprintf(stdout, "Sending request to dump task %d.\n", tid);
-
-
if (dump_backtrace) {
-
fflush(stdout);
-
if (dump_backtrace_to_file(tid, fileno(stdout)) < 0) {
-
fputs("Error dumping backtrace.\n", stderr);
-
return 1;
-
}
-
} else {
-
char tombstone_path[PATH_MAX];
-
if (dump_tombstone(tid, tombstone_path, sizeof(tombstone_path)) < 0) {
-
fputs("Error dumping tombstone.\n", stderr);
-
return 1;
-
}
-
fprintf(stderr, "Tombstone written to: %s\n", tombstone_path);
-
}
-
return 0;
-
}
☞ dump_backtrace_to_file(tid, fileno(stdout))
☞ dump_tombstone(tid, tombstone_path, sizeof(tombstone_path))