For Android developers, it is often not enough to understand basic application development skills, because developers need to know a lot of performance optimization, whether in work or interview, which is very important to improve the application experience. For Android development, performance optimization mainly focuses on the following aspects: startup optimization, rendering optimization, memory optimization, network optimization, carton detection and optimization, power consumption optimization, installation package volume optimization, security issues, etc.
1. Start optimization
The startup speed of an application can directly affect the user's experience. If it starts slowly, it may cause the user to uninstall and abandon the application.
1.1 optimization of cold start, hot start and warm start
1.1. 1 Concept
Android applications can be divided into cold startup, hot startup and warm startup according to the startup mode.
- Cold start: when there is no app process in the system (such as the app is started for the first time or the app is completely killed), starting the app is called cold start.
- Hot start: press the Home key or in other cases, the app will be switched to the background and start the app again.
- Warm start: warm start includes some operations of cold start, but the App process still exists, which means that it has more overhead than hot start.
It can be seen that hot start is the fastest start, and warm start is a start mode between cold start and hot start. Cold start is the slowest because it involves the creation of many processes. The following is the task flow related to cold start: 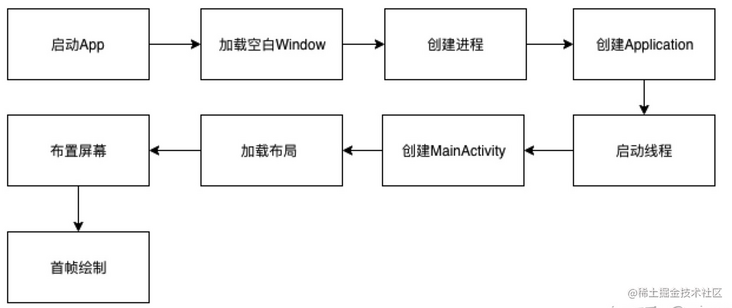
1.1. 2 visual optimization
In cold start mode, the system will start three tasks:
- Load and start the application.
- A blank startup window for the application is displayed immediately after startup.
- Create an application process.
Once the system creates the application process, the application process will enter the next stage and complete some of the following things.
- Create app object
- Start main thread
- Create the Activity object of the application entry
- Fill load layout View
- Execute the drawing process of View on the screen measure -> layout -> draw
After the application process completes the first drawing, the system process will exchange the currently displayed background window and replace it as the main activity. At this point, the user can start using the application. Because the creation process of App application process is determined by the software and hardware of mobile phone, we can only make some visual optimization in this creation process.
1.1. 3 start theme optimization
In cold start, when the Application process is created, you need to set the theme of the startup window. At present, most applications will enter a launchactivity to display Application information at the startup meeting. If other third-party services are initialized in the Application, there will be a white screen problem at startup.
In order to more smoothly and seamlessly connect our flash page, you can set the flash page picture in the Theme of the startup Activity, so that the picture of the startup window will be the flash page picture, not the white screen.
    <style name="AppTheme" parent="Theme.AppCompat.Light.NoActionBar">
        <item name="android:windowBackground">@drawable/lunch</item>  //Flash page picture
        <item name="android:windowFullscreen">true</item>
        <item name="android:windowDrawsSystemBarBackgrounds">false</item>
    </style>
1.2 code optimization
The theme setting method can only be applied to scenes with low requirements, and this optimization solves the symptoms rather than the root cause. The key lies in code optimization. In order to optimize, we need to master some basic data.
1.2. 1. Statistics of cold start time
ADB command mode: enter the following command in the Terminal of Android Studio to view the startup time of the page. The command is as follows:
adb shell am start -W packagename/[packagename].First screen Activity
After execution, the following information will be output on the console:
Starting: Intent { act=android.intent.action.MAIN cat=[android.intent.category.LAUNCHER] cmp=com.optimize.performance/.MainActivity }
Status: ok
Activity: com.optimize.performance/.MainActivity
ThisTime: 563
TotalTime: 563
WaitTime: 575
Complete
In the above log, there are three field information, namely ThisTime, TotalTime and WaitTime.
- ThisTime: it takes time for the last Activity to start
- TotalTime: it takes time for all activities to start
- WaitTime: the total time taken by AMS to start the Activity
The log embedding method is another way to count online time. This method records the start time and end time, and then takes the difference between them. First, you need to define a tool class for time statistics:
class LaunchRecord {
companion object {
private var sStart: Long = 0
fun startRecord() {
sStart = System.currentTimeMillis()
}
fun endRecord() {
endRecord("")
}
fun endRecord(postion: String) {
val cost = System.currentTimeMillis() - sStart
println("===$postion===$cost")
}
}
}
When starting, we directly manage points in the attachBaseContext of the Application. So where should we start at the end? It is suggested to end the embedding point by displaying the data on the page. The following methods can be used:
class MainActivity : AppCompatActivity() {
override fun onCreate(savedInstanceState: Bundle?) {
super.onCreate(savedInstanceState)
setContentView(R.layout.activity_main)
mTextView.viewTreeObserver.addOnDrawListener {
LaunchRecord.endRecord("onDraw")
}
}
override fun onWindowFocusChanged(hasFocus: Boolean) {
super.onWindowFocusChanged(hasFocus)
LaunchRecord.endRecord("onWindowFocusChanged")
}
}
1.2. 2 optimize testing tools
When doing startup optimization, we can use three-party tools to help us clarify the methods or threads at each stage, CPU execution time, etc. The following two tools, TraceView and SysTrace, are mainly introduced here.
TraceView
TraceView displays the execution time, call stack and other information in graphical form. The information is comprehensive and includes all threads, as shown in the following figure. 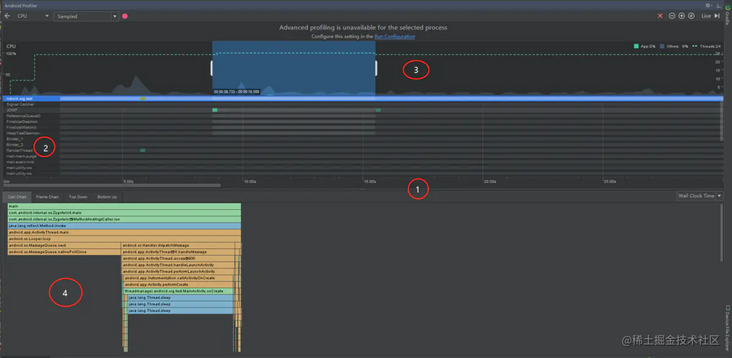 Use traceview to detect the generated results. The generated results will be placed in the Andrid/data/packagename/files path. Because the information collected by traceview is relatively comprehensive, it will lead to serious operation overhead and slow down the operation of the overall APP. Therefore, we can't distinguish whether traceview affects our startup time.
SysTrace Systrace generates an HTML report by combining Android kernel data. From the report, we can see the execution time of each thread, method time and CPU execution time.
 For API versions above 18, you can directly use TraceCompat to grab data because it is a compatible API.
Start: TraceCompat.beginSection("tag ")
end: TraceCompat.endSection()
Then, execute the following script.
python systrace.py -b 32768 -t 10 -a packagename -o outputfile.html sched gfx view wm am app
Here we can popularize the meaning of each word:
- b: Size of collected data
- t: Time
- a: Application package name monitored
- o: Name of the build file
Systrace is a lightweight tool with low overhead, and can directly reflect the CPU utilization.
2. UI rendering optimization
The Android system redraws the Activity every 16ms. Therefore, our application must complete all logical operations of screen refresh within 16ms, and each frame can only stay for 16ms, otherwise the frame will fall. Whether the Android application is stuck or not is directly related to UI rendering.
2.1CPU,GPU
For most mobile phones, the screen refresh rate is 60hz, that is, if the task of this frame is not completed within 1000/60=16.67ms, frame loss will occur. Frame loss is the direct cause of interface jamming. Rendering operation usually depends on two core components: CPU and GPU. The CPU is responsible for calculation operations such as Measure and Layout, and the GPU is responsible for Rasterization.
The so-called rasterization is the process of converting vector graphics into bitmaps. The display on the mobile phone is displayed according to pixels. For example, a Button, TextView and other components are split into pixels and displayed on the mobile phone screen. The purpose of UI rendering optimization is to reduce the pressure of CPU and GPU, remove unnecessary operations, and ensure that all CPU and GPU calculations, rendering, rendering and other operations are processed within 16ms per frame, so that the UI can be displayed smoothly and smoothly.
2.2 over drawing
The first step in UI rendering optimization is to find Overdraw (over drawing), that is, a pixel on the screen is drawn many times in the same frame. In the overlapping UI layout, if the invisible UI is also drawing or the latter control blocks the previous control, some pixel areas will be drawn many times, which increases the pressure on CPU and GPU.
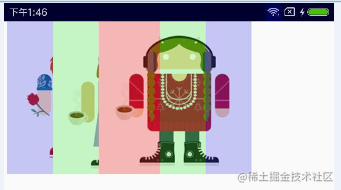
So how to find the place of Overdraw in the layout? Very simply, you can turn on the developer option in the mobile phone, and then turn on the switch for debugging GPU over drawing, and then you can see whether the application layout is Overdraw, as shown in the following figure. 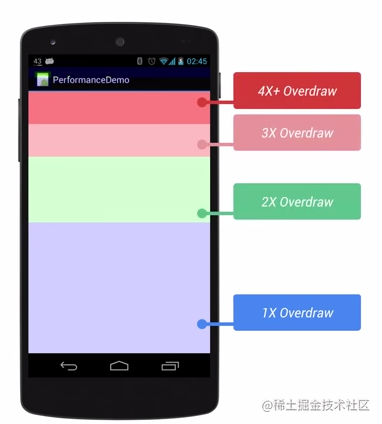 Blue, light green, light red and crimson represent four different degrees of Overdraw. 1X, 2x, 3x and 4x respectively represent that the same frame on the same pixel has been drawn many times in time. 1x represents one time (the most ideal situation), 4x represents four times (the worst situation), and 3x and 4x need to be eliminated.
2.3 solve the OverDraw of custom View
We know that the onDraw method is sometimes rewritten when customizing the View, but the Android system can't detect what operations will be performed in onDraw, so the system can't do some optimization for us. In this way, the requirements for programmers are high. If the View has a lot of overlap, it will waste CPU and GPU resources. At this time, we can use canvas Cliprect() to help the system identify those visible areas.
This method can specify a rectangular area. Only in this area will it be drawn, and other areas will be ignored. Next, we further illustrate the use of OverDraw through a small Demo provided by Google. 
In the following code, the DroidCard class encapsulates the card information. The code is as follows.
public class DroidCard {

public int x;//Left draw start point
public int width;
public int height;
public Bitmap bitmap;

public DroidCard(Resources res,int resId,int x){
this.bitmap = BitmapFactory.decodeResource(res,resId);
this.x = x;
this.width = this.bitmap.getWidth();
this.height = this.bitmap.getHeight();
 }
}
The custom View code is as follows:
public class DroidCardsView extends View {
//Spacing between pictures
private int mCardSpacing = 150;
//Record of the distance between the picture and the left
private int mCardLeft = 10;

private List<DroidCard> mDroidCards = new ArrayList<DroidCard>();

private Paint paint = new Paint();

public DroidCardsView(Context context) {
super(context);
initCards();
}

public DroidCardsView(Context context, AttributeSet attrs) {
super(context, attrs);
initCards();
}
/**
* Initialize card set
*/
protected void initCards(){
Resources res = getResources();
mDroidCards.add(new DroidCard(res,R.drawable.alex,mCardLeft));

mCardLeft+=mCardSpacing;
mDroidCards.add(new DroidCard(res,R.drawable.claire,mCardLeft));

mCardLeft+=mCardSpacing;
mDroidCards.add(new DroidCard(res,R.drawable.kathryn,mCardLeft));
}

@Override
protected void onDraw(Canvas canvas) {
super.onDraw(canvas);
for (DroidCard c : mDroidCards){
drawDroidCard(canvas, c);
}
invalidate();
}

/**
* Draw a DroidCard
*/
private void drawDroidCard(Canvas canvas, DroidCard c) {
canvas.drawBitmap(c.bitmap,c.x,0f,paint);
}
}
Then, we run the code and turn on the overdraw switch of the mobile phone. The effect is as follows:
It can be seen that the light red area is obviously drawn three times because of the overlap of the pictures. How to solve this problem? In fact, it can be found from the analysis that only one third of the bottom picture needs to be drawn, and only one third of the top picture needs to be fully drawn to ensure that the bottom two pictures only need a receipt. The optimized code is as follows:
public class DroidCardsView extends View {

//Spacing between pictures
private int mCardSpacing = 150;
//Record of the distance between the picture and the left
private int mCardLeft = 10;

private List<DroidCard> mDroidCards = new ArrayList<DroidCard>();

private Paint paint = new Paint();

public DroidCardsView(Context context) {
super(context);
initCards();
}

public DroidCardsView(Context context, AttributeSet attrs) {
super(context, attrs);
initCards();
}
/**
* Initialize card set
*/
protected void initCards(){
Resources res = getResources();
mDroidCards.add(new DroidCard(res, R.drawable.alex,mCardLeft));

mCardLeft+=mCardSpacing;
mDroidCards.add(new DroidCard(res, R.drawable.claire,mCardLeft));

mCardLeft+=mCardSpacing;
mDroidCards.add(new DroidCard(res, R.drawable.kathryn,mCardLeft));
}

@Override
protected void onDraw(Canvas canvas) {
super.onDraw(canvas);
for (int i = 0; i < mDroidCards.size() - 1; i++){
drawDroidCard(canvas, mDroidCards,i);
}
drawLastDroidCard(canvas,mDroidCards.get(mDroidCards.size()-1));
invalidate();
}

/**
* Draw the last DroidCard
* @param canvas
* @param c
*/
private void drawLastDroidCard(Canvas canvas,DroidCard c) {
canvas.drawBitmap(c.bitmap,c.x,0f,paint);
}

/**
* Draw a DroidCard
* @param canvas
* @param mDroidCards
* @param i
*/
private void drawDroidCard(Canvas canvas,List<DroidCard> mDroidCards,int i) {
DroidCard c = mDroidCards.get(i);
canvas.save();
canvas.clipRect((float)c.x,0f,(float)(mDroidCards.get(i+1).x),(float)c.height);
canvas.drawBitmap(c.bitmap,c.x,0f,paint);
canvas.restore();
 }
}
In the above code, we use the clipRect method of Canvas to cut out an area before drawing, so that when drawing, we only draw in this area, and the excess part will not be drawn. Rerun the above code, and the effect is shown in the figure below.

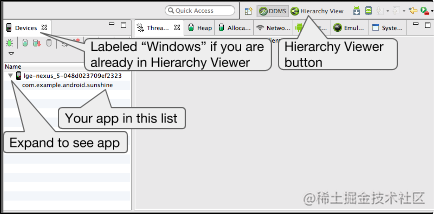
2.4 Hierarchy Viewer
Hierarchy Viewer is a built-in tool in Android Device Monitor, which allows developers to Measure the Layout speed of each view in the Layout hierarchy and help developers find performance bottlenecks caused by the view hierarchy. The Hierarchy Viewer can distinguish the relative performance of Measure, Layout and Executive of the Distribution Bureau by three different colors: red, yellow and green.
open
- Connect the device to the computer. If a dialog box appears on the device prompting you to allow USB debugging?, Please click OK.
- Open your project in Android Studio, build and run the project on your device.
- Start Android Device Monitor. Android Studio may display the Disable adb integration dialog box because only one process can connect to the device through adb at a time, and Android Device Monitor is requesting a connection. So click Yes.
- In the menu bar, select Window > open perspective, and then click Hierarchy View.
- Double click the applied package name in the Windows tab on the left. This populates the relevant panes with the applied view hierarchy.
The key to improving layout performance is to keep the layout level as flat as possible and avoid repeated nested layouts. If the layout level we write is deep, it will seriously increase the burden of CPU and cause serious performance jam.
2.5 memory jitter
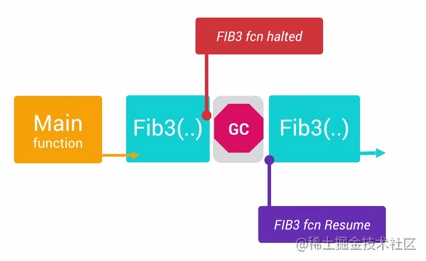
After optimizing the tree structure and overview of the view, we may still feel that our app has problems such as jamming, frame loss, or slow sliding. We need to check whether there is memory jitter. Memory jitter refers to the frequent blocking of UI threads caused by frequent memory creation and GC.
Android has a mechanism to automatically manage memory, but improper use of memory is still easy to cause serious performance problems. Creating too many objects in the same frame requires special attention. Creating a large number of objects in the same frame may cause the GC to operate continuously. When executing the GC operation, any operation of all threads will need to be suspended until the GC operation is completed. A large number of non-stop GC operations will significantly occupy the frame interval. If too many GC operations are done in the frame interval, the page will get stuck.
In Android development, there are two main reasons for frequent GC operations:
- Memory jitter means that a large number of objects are generated in a short time and released immediately in a short time.
- If a large number of objects are generated in a short time, exceeding the threshold and insufficient memory, the GC operation will also be triggered.
Android memory jitter can be detected using the Profiler of Android Studio.
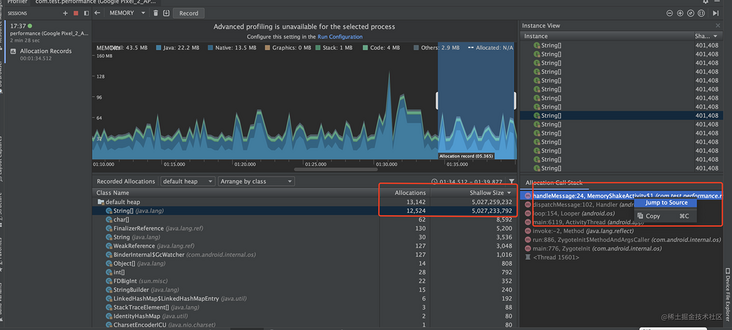
Then, click record to record the memory information and find the location where the memory jitter occurs. Of course, you can also directly locate the code location through Jump to Source.

In order to avoid memory jitter, we need to avoid allocating objects in the for loop to occupy memory. We need to try to move the creation of objects outside the loop body. Attention should also be paid to the onDraw method in the custom View. The onDraw method will be called every time the screen is drawn and the animation is executed, so as to avoid complex operations in the onDraw method, Avoid creating objects. For those cases where it is unavoidable to create objects, we can consider the object pool model to solve the problem of frequent creation and destruction through the object pool. However, it should be noted that after use, the objects in the object pool need to be released manually.
3. Memory optimization
3.1 memory management
In the previous basic links of Java, we also made a basic introduction to the memory management model of Java.
3.1. 1 memory area
In the Java memory model, the memory area is divided into five areas: method area, heap, program counter, local method stack and virtual machine stack, as shown in the following figure.
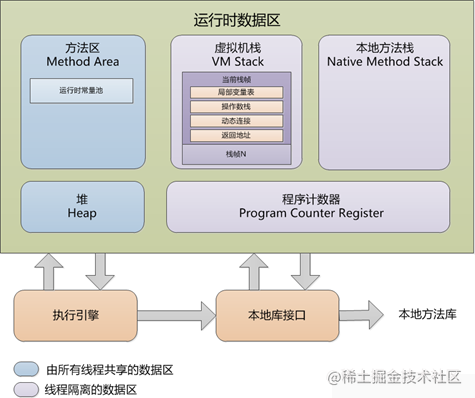
Method area
- The thread sharing area is used to store class information, static variables, constants, and code data compiled by the real-time compiler.
- OOM occurs when memory allocation requirements cannot be met.
heap
- The thread sharing area is the largest piece of memory managed by the JAVA virtual machine and is created when the virtual machine is started.
- Store object instances. Almost all object instances are allocated on the heap, which is the main area managed by GC.
VM Stack
- Thread private area. Each java method will create a stack frame during execution to store local variable table, operand stack, dynamic link, method exit and other information. The process from the beginning to the end of method execution is the process of stack frame in and out of the virtual machine stack.
- The local variable table stores the basic data types, object references, and returnAddress types known during compilation. The required memory space will be allocated during compilation. When entering a method, the space of the local variable table in the frame is completely determined and does not need to be changed at run time.
- If the stack depth requested by the thread is greater than the maximum depth allowed by the virtual machine, a SatckOverFlowError error error will be thrown.
- During dynamic expansion of the virtual machine, if enough memory cannot be requested, an OutOfMemoryError error will be thrown.
Native Method Stack
- It serves the Native method in the virtual machine. There are no mandatory provisions on the language, data structure and use mode used in the local method stack. The virtual machine can implement it by itself.
- The size of the occupied memory area is not fixed and can be expanded dynamically as needed.
Program counter
- A small memory space, thread private, which stores the bytecode line number indicator executed by the current thread.
- Bytecode interpreter selects the next bytecode instruction to be executed by changing the value of this counter: branch, loop, jump, etc.
- Each thread has a separate program counter
- The only area that will not OOM in the java virtual machine
3.1. 2 waste recycling
Mark removal algorithm mark removal algorithm is mainly divided into two stages. First, mark the objects that need to be recycled, and then uniformly recycle all marked objects after marking; Disadvantages:
- Efficiency problem: both marking and clearing processes are not efficient.
- Space problem: after the mark is cleared, many discontinuous memory fragments will be caused, which will lead to the problem that GC has to be triggered because sufficient continuous space cannot be found when large objects need to be allocated.
The copy algorithm divides the available memory into two small blocks of the same size according to the space, and only one of them is used each time. When this memory is used up, the surviving objects are copied to another memory, and then the objects in this memory area are cleared as a whole. Each time the memory of the whole half area is recycled, it will not lead to fragmentation, and the implementation is simple and efficient. Disadvantages: the memory needs to be reduced to half of the original, and the space cost is too high.
Tag collation algorithmtag collation AlgorithmThe tag process is the same as the tag cleanup algorithm, but the cleanup process does not directly clean up recyclable objects, but moves all living objects like one end, and then cleans up the memory outside the end boundary.
Generational collection algorithm contemporary virtual machine garbage collection algorithms use generational collection algorithm to collect, divide the memory into new generation and old generation according to different object life cycle, and then adopt the most appropriate collection algorithm according to the characteristics of each age.
- There are few surviving objects in the new generation, and a large number of objects die in each garbage collection. Generally, the replication algorithm is adopted, and garbage collection can be realized by paying the cost of replicating a small number of surviving objects;
- There are many surviving objects in the elderly generation and there is no additional space for allocation guarantee, so we must use mark removal algorithm and mark sorting algorithm for recycling;
3.2 memory leakage
The so-called memory leak refers to the useless and unrecoverable objects in memory. The phenomenon is that it will lead to memory jitter and reduce available memory, resulting in frequent GC, jamming and OOM.
The following is a code that simulates a memory leak:
/**
 * Activity simulating memory leak
 */
public class MemoryLeakActivity extends AppCompatActivity implements CallBack{
    @Override
    protected void onCreate(@Nullable Bundle savedInstanceState) {
        super.onCreate(savedInstanceState);
        setContentView(R.layout.activity_memoryleak);
        ImageView imageView = findViewById(R.id.iv_memoryleak);
        Bitmap bitmap = BitmapFactory.decodeResource(getResources(), R.mipmap.splash);
        imageView.setImageBitmap(bitmap);

        // Add static class reference
        CallBackManager.addCallBack(this);
    }
    @Override
    protected void onDestroy() {
        super.onDestroy();
//        CallBackManager.removeCallBack(this);
    }
    @Override
    public void dpOperate() {
        // do sth
    }
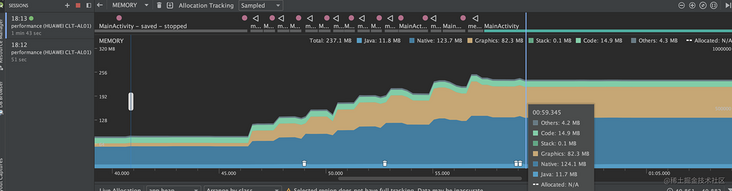
When we use the Memory Profiler tool to view the memory curve, we find that there is a continuous rise in memory, as shown in the figure below.
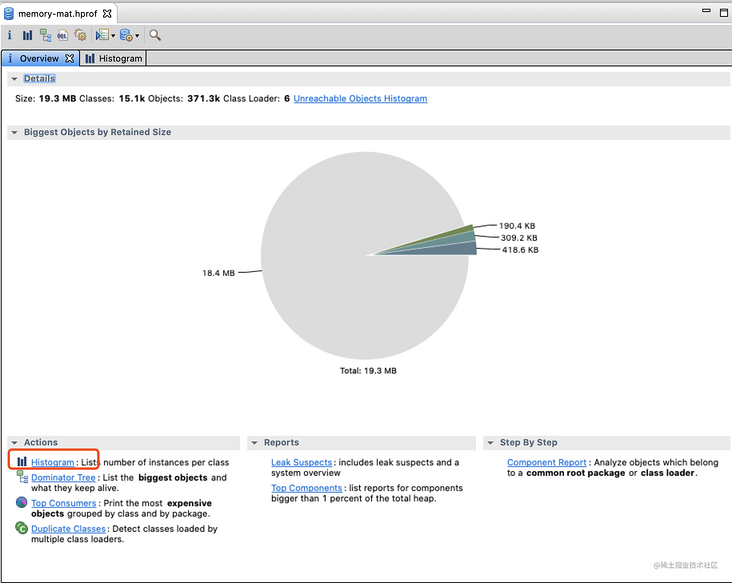
If we want to analyze and locate the specific location of memory leakage, we can use MAT tool. First, use the MAT tool to generate an hprof file. Click dump to convert the current memory information into an hprof file. The generated file needs to be converted into a MAT readable file. Execute the conversion command to complete the conversion, and the generated file is located in the Android / SDK / platform tools path.
hprof-conv Just generated hprof file memory-mat.hprof
Open the hprof file just converted using mat, and then open the hprof file using Android Studio, as shown in the following figure.
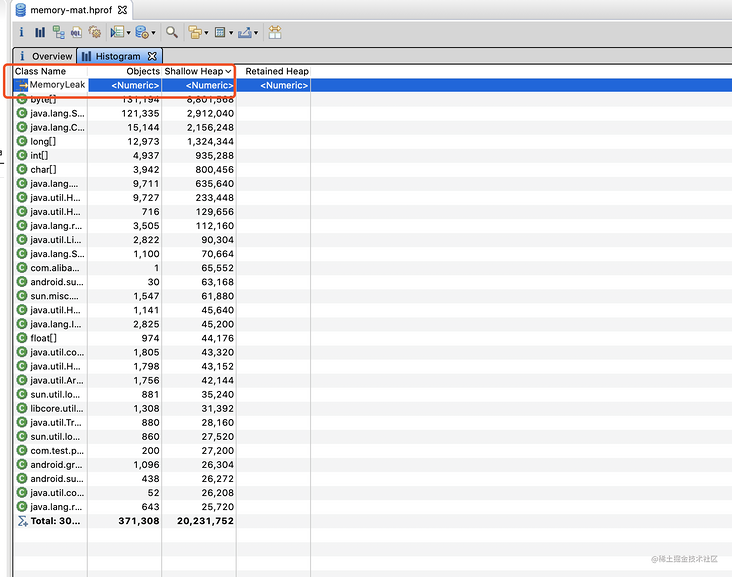
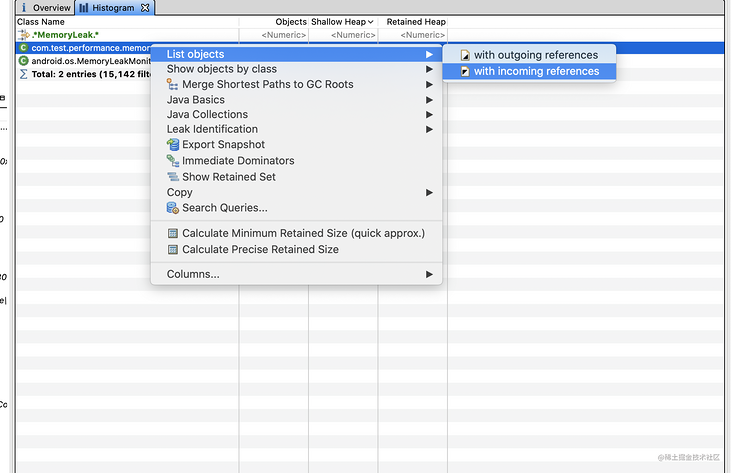
Then click [Historygram] on the panel and search MemoryLeakActivity to view the relevant information of the corresponding leaked file.
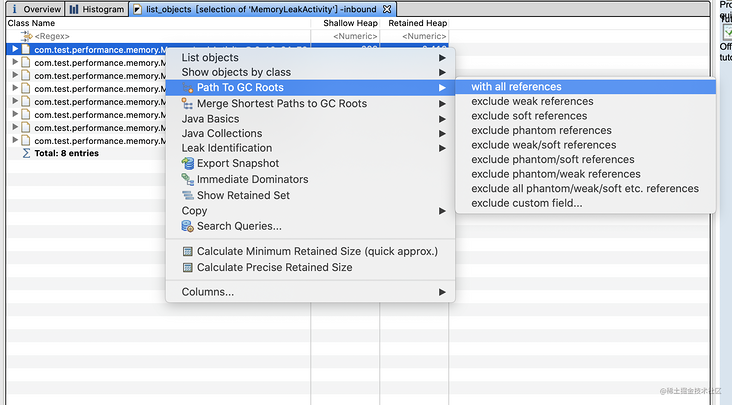
Then, view all reference objects and get the relevant reference chain, as shown in the following figure.
You can see that GC Roots are CallBackManager
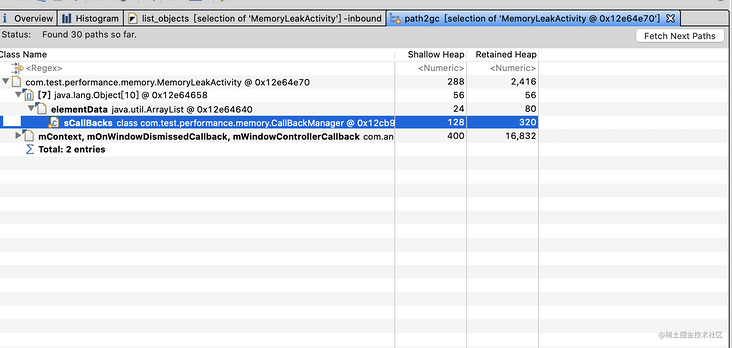
Therefore, we can remove the CallBackManager reference when the Activity is destroyed.
@Override
protected void onDestroy() {
    super.onDestroy();
    CallBackManager.removeCallBack(this);
}
Of course, the above is just an example of the use of MAT analysis tool. Other memory leaks can be solved with the help of MAT analysis tool.
3.3 large image memory optimization
In Android development, we often encounter the problem of memory leakage caused by loading large images. For this scenario, there is a general solution, that is, use Artbook to detect unreasonable images. We know that there are two main ways to obtain the memory occupied by Bitmap:
- Through the getByteCount method, but it needs to be obtained at run time
- width * height * memory occupied by one pixel * compression ratio of the resource directory where the picture is located
The Artbook method can gracefully obtain unreasonable pictures with low invasiveness, but it is generally used offline because of compatibility problems. Using Artbook requires the following dependencies to be installed:
implementation 'me.weishu:epic:0.3.6'
Then customize the Hook method, as shown below.
public class CheckBitmapHook extends XC_MethodHook {
    @Override protected void afterHookedMethod(MethodHookParam param) throws Throwable {
        super.afterHookedMethod(param);
        ImageView imageView = (ImageView)param.thisObject;
        checkBitmap(imageView,imageView.getDrawable());
    }
    private static void checkBitmap(Object o,Drawable drawable) {
        if(drawable instanceof BitmapDrawable && o instanceof View) {
            final Bitmap bitmap = ((BitmapDrawable) drawable).getBitmap();
            if(bitmap != null) {
                final View view = (View)o;
                int width = view.getWidth();
                int height = view.getHeight();
                if(width > 0 && height > 0) {
                    if(bitmap.getWidth() > (width <<1) && bitmap.getHeight() > (height << 1)) {
                        warn(bitmap.getWidth(),bitmap.getHeight(),width,height,
                                new RuntimeException("Bitmap size is too large"));
                    }
                } else {
                    final Throwable stacktrace = new RuntimeException();
                    view.getViewTreeObserver().addOnPreDrawListener(
                            new ViewTreeObserver.OnPreDrawListener() {
                                @Override public boolean onPreDraw() {
                                    int w = view.getWidth();
                                    int h = view.getHeight();
                                    if(w > 0 && h > 0) {
                                        if (bitmap.getWidth() >= (w << 1)
                                                && bitmap.getHeight() >= (h << 1)) {
                                            warn(bitmap.getWidth(), bitmap.getHeight(), w, h, stacktrace);
                                        }
                                        view.getViewTreeObserver().removeOnPreDrawListener(this);
                                    }
                                    return true;
                                }
                            });
                }
            }
        }
    }
    private static void warn(int bitmapWidth, int bitmapHeight, int viewWidth, int viewHeight, Throwable t) {
        String warnInfo = new StringBuilder("Bitmap size too large: ")
                .append("\n real size: (").append(bitmapWidth).append(',').append(bitmapHeight).append(')')
                .append("\n desired size: (").append(viewWidth).append(',').append(viewHeight).append(')')
                .append("\n call stack trace: \n").append(Log.getStackTraceString(t)).append('\n')
                .toString();
        LogUtils.i(warnInfo);
Finally, inject Hook during Application initialization.
DexposedBridge.hookAllConstructors(ImageView.class, new XC_MethodHook() {
    @Override protected void afterHookedMethod(MethodHookParam param) throws Throwable {
        super.afterHookedMethod(param);
        DexposedBridge.findAndHookMethod(ImageView.class,"setImageBitmap", Bitmap.class,
                new CheckBitmapHook());
    }
});
3.4 online monitoring
3.4. 1 conventional scheme
Scheme 1 obtains the current memory size in a specific scenario. If the current memory size exceeds 80% of the maximum memory of the system, Dump the current memory (Debug.dumpHprofData()), select an appropriate time to upload the hprof file, and then manually analyze the file through the MAT tool.
Disadvantages:
- Dump file is relatively large, which is positively related to user use time and object tree.
- Large files lead to high upload failure rate and difficult analysis.
Scheme 2 brings leakcanary online, adds preset doubt points, monitors the memory leakage of the doubt points, and sends the memory leakage back to the server.
Disadvantages:
- It has low universality and needs to preset doubt points, which can not be monitored where there are no preset doubt points.
- LeakCanary analysis is time-consuming and memory consuming, and OOM may occur.
3.4. 2. Leakcanal reconstruction
The transformation mainly involves the following points:
- Change the need to preset doubt points to automatically find doubt points, and automatically set doubt points in object classes with large memory in front memory.
- LeakCanary is slow to analyze the leakage link, so it is transformed to analyze only objects with large retention size.
- The analysis process will OOM because all the analysis objects will be loaded into memory during leakcanal analysis. We can record the number and occupied size of the analysis objects, cut the analysis objects, and do not load them into memory.
The transformation steps are as follows:
- Monitor general indicators: standby memory, memory occupied by key modules and OOM rate
- Monitor the number and time of GC in one life cycle of APP and the life cycle of key module interface
- Bring the customized LeakCanary online to automatically analyze the online memory leakage
4. Network optimization
4.1 impact of network optimization
App network connection has a lot of impact on users, and in most cases, it is very intuitive, which directly affects users' experience of this app Some important points: traffic: app traffic consumption is sensitive to users. After all, traffic costs money Now most people have installed traffic monitoring tool app on their mobile phones to monitor app traffic usage If our app is not well controlled, it will give users a bad experience. Power: the power is not so obvious relative to the user Ordinary users may not pay much attention However, as in power optimization, radio is a factor that has a great impact on power So we should also pay attention. User waiting: that is, user experience. Good user experience is the first step for us to retain users If the waiting time for app requests is long, it will give users the feeling of slow response to network cards and applications. If there are comparisons and substitutes, our app is likely to be ruthlessly abandoned by users.
4.2 network analysis tools
Tools for network analysis include Monitor and agent tools.
4.2.1 Network Monitor
The built-in Monitor tool in Android Studio provides a Network Monitor to help developers conduct network analysis. The following is a typical schematic diagram of Network Monitor.
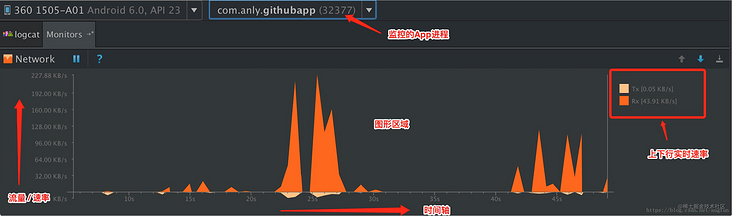
- Rx --- R(ecive) indicates downlink traffic, that is, Download reception.
- Tx --- T(ransmit) indicates uplink traffic, that is, upload and send.
Network Monitor tracks data requests from selected applications in real time. We can connect the mobile phone, select the debugging application process, and then operate the page requests we need to analyze on the App.
4.2. 2 agent tools
The network agent tool has two functions: one is to intercept the network request response packet and analyze the network request; Another is to set up a proxy network, which is generally used to test different network environments in mobile App development, such as Wifi/4G/3G / weak network, etc.
Now, there are many proxy tools available, such as Wireshark, Fiddler, Charles, etc.
4.3 network optimization scheme
For network optimization, it is mainly carried out from two aspects:
- Reduce active time: reduce the frequency of network data acquisition, so as to reduce the power consumption of radio and control the power consumption.
- Compressed packet size: compressed packets can reduce traffic consumption and make each request faster.
Based on the above solutions, the following common solutions can be obtained:
4.3. 1 interface design
1. API design the API design between App and server should consider the frequency of network requests, resource status, etc. So that App can complete the presentation of business requirements and interfaces with less requests.
For example, register to log in Normally, there are two APIs, registration and login, but when designing the API, we should include an implicit login for the registration interface To avoid that the App has to request a login interface after registration.
2. Use Gzip compression
Gzip is used to compress the request and response to reduce the amount of data transmitted, so as to reduce traffic consumption. Gzip compression is performed by default when network requests are made using network request frameworks such as Retrofit.
3. Before using Protocol Buffer, we used XML to transmit data. Later, we used JSON instead of XML, largely for readability and reducing the amount of data. In game development, in order to ensure the accuracy and timeliness of data, Google launched Protocol Buffer data exchange format.
4. Obtain pictures with different resolutions according to the network conditions. When we use Taobao or JD, we will see that the application will obtain pictures with different resolutions according to the network conditions, so as to avoid traffic waste and improve the user experience.
4.3. 2. Make rational use of network cache
Using cache properly can not only make our application look faster, but also avoid some unnecessary traffic consumption and bring a better user experience.
1. Package network request
When the interface design cannot meet our business requirements. For example, one interface may need to request multiple interfaces, or the network is good, and we want to obtain more data when we are in Wifi state. At this time, you can package some network requests, such as the request list, and obtain the detailed data of the item item with high Header click through rate.
2. Monitor device status in order to improve the user experience, we can monitor the use status of the device, and then execute the network request in combination with the JobScheduler. For example, Splash screen advertising pictures can be downloaded and cached locally when connected to Wifi; News apps can be cached offline under charging and Wifi status.
4.3. 3 weak network test & Optimization
1. There are several ways to simulate weak network test:
Android Emulator usually, we can set the network speed and delay by creating and starting the Android Emulator, as shown in the figure below.
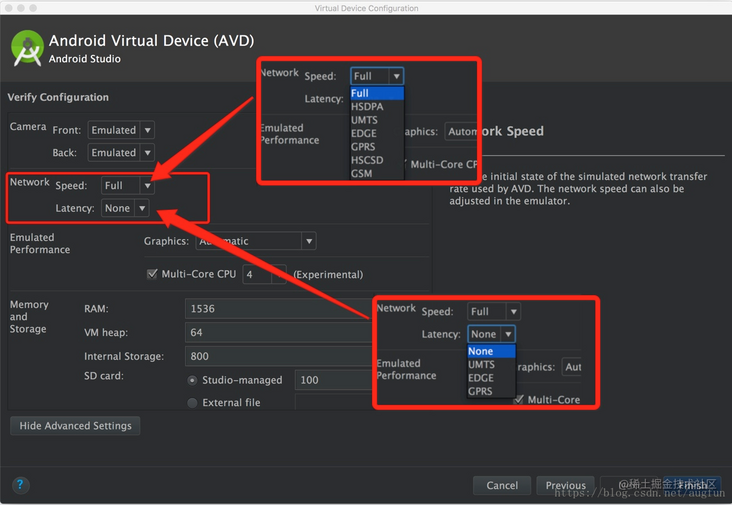
Then, the emulator command we use at startup is as follows.
$emulator -netdelay gprs -netspeed gsm -avd Nexus_5_API_22
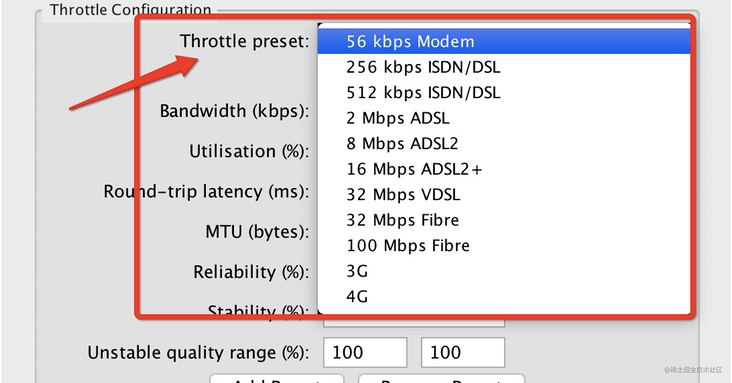
2. Network agent tool the network agent tool can also simulate the network situation. Take Charles as an example, keep the mobile phone and PC in the same LAN, set the proxy mode to manual in the advanced settings of wifi settings on the mobile phone, fill in the ip address of the PC for the proxy ip, and the port number is 8888 by default.
5. Power consumption optimization
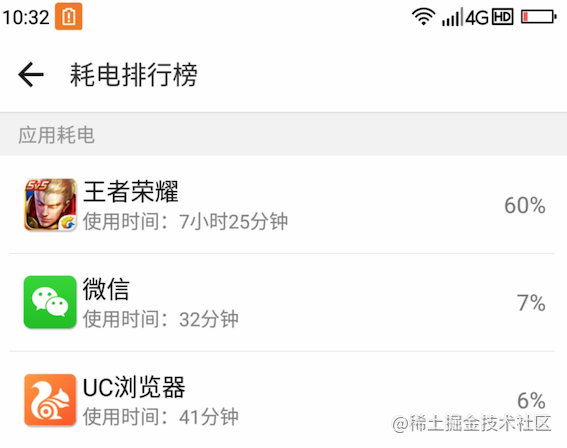
In fact, if our application needs to play video, obtain GPS information, or game applications, the power consumption is relatively serious. How to determine which power consumption can be avoided or need to be optimized? We can open the power consumption ranking of the mobile phone and find that the "King glory" has been used for more than 7 hours. At this time, users have expectations for the power consumption of the "King glory".
5.1 optimization direction
If it is found that an application does not use much at all, but consumes a lot of power, it will be ruthlessly killed by the system. Therefore, the first direction of power consumption optimization is to optimize the background power consumption of applications.
Knowing how the system calculates the power consumption, we can also know what the application should not do in the background, such as obtaining WakeLock, WiFi and Bluetooth scanning for a long time, as well as background services. Why do we say that the first direction of power consumption optimization is to optimize the power consumption of the application background, because the most stringent requirements for pre installed projects of most manufacturers are the standby power consumption of the application background.
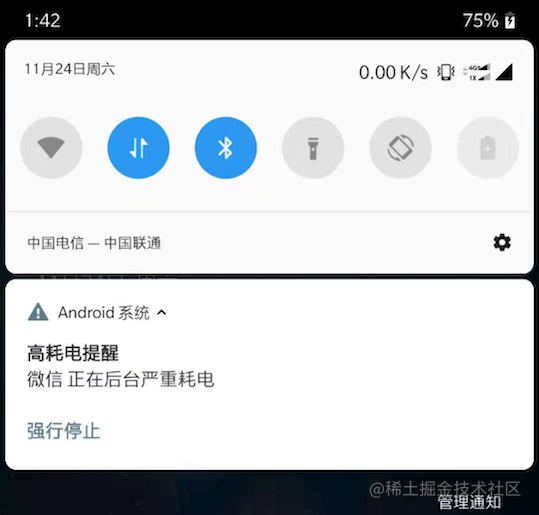
Of course, we won't completely ignore the front desk power consumption, but the standard will be relaxed a lot. Let's take a look at the following figure. If the system pops up this dialog box for your application, it may be tolerable for wechat users, but for most other applications, many users may directly add you to the list of background restrictions.
The second direction of power consumption optimization is to comply with the rules of the system and make the system think that your power consumption is normal.
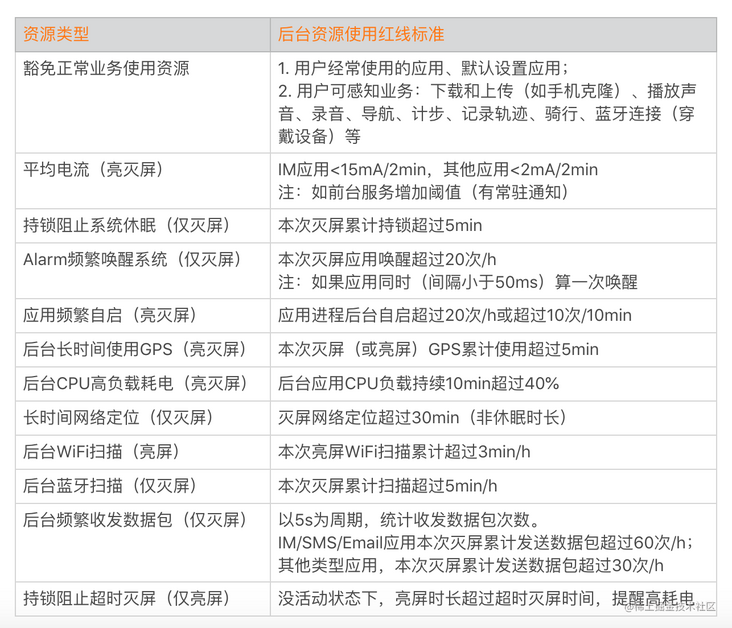
Android P and above monitor the background power consumption through Android Vitals, so we need to comply with the rules of Android Vitals. At present, its specific rules are as follows. 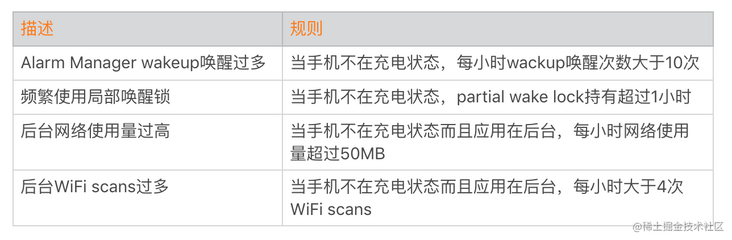 It can be seen that the Android system is more concerned about the background Alarm wake-up, background network, background WiFi scanning and some long-time WakeLock to prevent the system from sleeping in the background, because these may lead to power consumption problems.
5.2 power consumption monitoring
5.2.1 Android Vitals
Several power monitoring schemes and rules of Android Vitals can help us monitor power consumption.
- Too many alarm manager wakeups
- Frequent use of local wake-up lock
- Background network usage is too high
- Too many background WiFi Scans
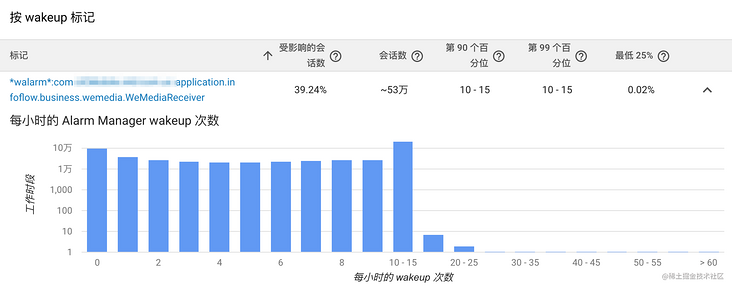
After using it for a period of time, I found that it is not so easy to use. Take Alarm wakeup as an example. Vitals takes more than 10 times per hour as the rule. Because this rule cannot be modified, many times we may want to make a more detailed distinction between different system versions. Secondly, like the Battery Historian, we can only get the components marked with wakeup, not the application stack, whether the mobile phone was charging, remaining power and other information. The following figure shows the information obtained by wakeup.
The same is true for networks, WiFi scans and WakeLock. Although Vitals helped us narrow down the scope of investigation, we still couldn't confirm the specific cause of the problem.
5.3 how to monitor power consumption
As mentioned earlier, Android Vitals is not so easy to use, and it can't be used for domestic applications. What should our power consumption monitoring system monitor and what should we do? First, let's take a look at power consumption monitoring. What should we do?
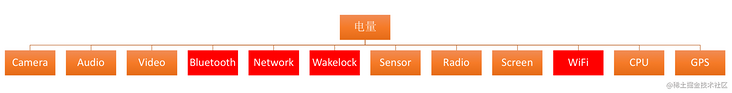
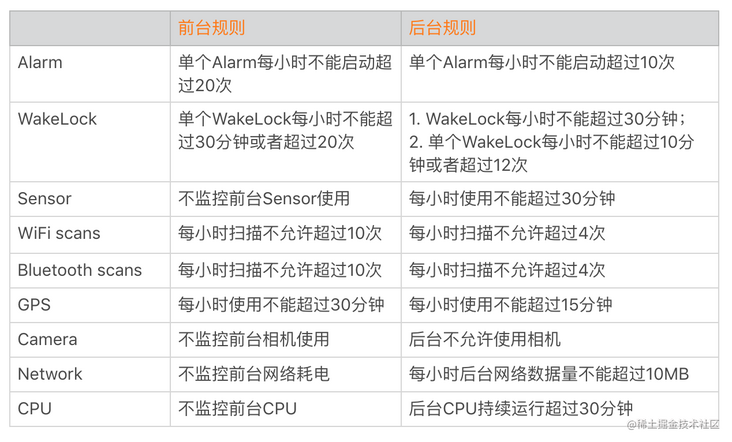
- Monitoring information: in short, we monitor what the system cares about, and we should focus on the power consumption monitoring of the back station. Similar to Alarm wakeup, WakeLock, WiFi scans and Network are required. Others can be based on the actual situation of the application. If it is a map application, it is allowed to obtain GPS in the background; If it is a pedometer application, there is no big problem in obtaining sensors in the background.
- Field information: the monitoring system hopes to obtain complete stack information, such as which line of code initiated WiFi scans, which line of code applied for WakeLock, etc. In addition, some information such as whether the mobile phone was charging, the power level of the mobile phone, application foreground and background time, CPU status and so on can also help us troubleshoot some problems.
- Refining rules: finally, we need to abstract the monitoring content into rules. Of course, the items or parameters monitored by different applications are different. Since the specific conditions of each application are different, simple rules can be used for reference.
5.3.2 Hook scheme
After clarifying what we need to monitor and the specific rules, let's take a look at the technical scheme of power monitoring. Let's first look at the Hook scheme. The advantage of Hook scheme is that the user access is very simple, there is no need to modify the code, and the access cost is relatively low. Let me take several common rules as examples to see how to use Java Hook to achieve the purpose of monitoring.
1. WakeLock WakeLock is used to prevent the CPU, screen and even keyboard from sleeping. Similarly, Alarm and JobService will also apply for WakeLock to complete background CPU operations. The core control code of WakeLock is in PowerManagerService. The implementation method is very simple, as shown below.
// Agent PowerManagerService
ProxyHook().proxyHook(context.getSystemService(Context.POWER_SERVICE), "mService", this);

@Override
public void beforeInvoke(Method method, Object[] args) {
    // Apply for Wakelock
    if (method.getName().equals("acquireWakeLock")) {
        if (isAppBackground()) {
            // Application background logic, obtaining application stack, etc
         } else {
            // Apply foreground logic, get application stack, etc
         }
    // Release Wakelock
    } else if (method.getName().equals("releaseWakeLock")) {
       // Logic of release
    }
}
2. Alarm Alarm is used to perform regular repetitive tasks. It has four types, including ELAPSED\_REALTIME\_WAKEUP and RTC\_WAKEUP wakes up the device. Similarly, the core control logic of alarm is implemented in AlarmManagerService as follows.
// Agent AlarmManagerService
new ProxyHook().proxyHook(context.getSystemService
(Context.ALARM_SERVICE), "mService", this);

public void beforeInvoke(Method method, Object[] args) {
    // Set Alarm
    if (method.getName().equals("set")) {
        // Adaptation of parameter types of different versions, obtaining application stack, etc
    // Clear Alarm
    } else if (method.getName().equals("remove")) {
        // Clear logic
    }
}
In addition to WakeLock and Alarm, we can use the methods related to Caton monitoring for the background CPU; For the background network, we can also monitor relevant methods through the network; For GPS monitoring, we can use Hook agent LOCATION\_SERVICE; For sensors, we use Hook Sensor\_ "mSensorListeners" in service can get some information.
Finally, we save the stack information of the requested resource. When we trigger a rule to report a problem, we can upload the collected stack information, whether the battery is charged, CPU information, application front and background time and other auxiliary information to the background.
5.3. 3. Pile insertion method
Although using Hook is simple, some rules may not be easy to find suitable Hook points, and many Hook points are not supported after Android P. For compatibility, the first thing I think of is the pile insertion method. Take WakeLock as an example:
public class WakelockMetrics {
    // Wakelock application
    public void acquire(PowerManager.WakeLock wakelock) {
        wakeLock.acquire();
        // Add Wakelock application monitoring logic here
    }
    // Wakelock release
    public void release(PowerManager.WakeLock wakelock, int flags) {
        wakelock.release();
        // Wakelock release monitoring logic is added here
    }
}
If you study power consumption, you must know the Open-Source Library battery metrics of Facebook's power consumption monitoring. It monitors a wide range of data, including Alarm, WakeLock, Camera, CPU, Network, etc., and also collects information such as power charging status and power level. However, unfortunately, battery metrics only provides a series of basic classes, and developers still need to modify a large number of source codes in actual use.
6. Installation package optimization
App s on the market now range from tens of m to hundreds of M. The smaller the installation package is, the less traffic is saved during downloading, and the better the user experience, the faster the downloading and installation. So what can we do to optimize the installation package?
6.1 common optimization strategies
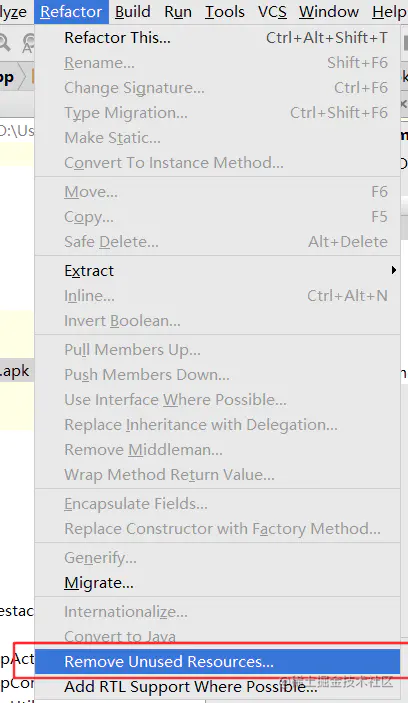
1. Clean up useless resources in the android packaging process, if the code has references involving resources and codes, it will be packaged into the App. In order to prevent these abandoned codes and resources from being packaged into the App, we need to clean up these useless codes and resources in time to reduce the size of the App. The cleaning method is to click Refactor - > Remove unused Resource in android Studio, as shown in the following figure.
2. Use Lint tool
Lint tool is still very useful. It gives us the points that need to be optimized:
- Detect useless layouts and delete them
- Delete unused resources
- Suggested string Some unused characters in XML are also deleted
3. Open shrinkResources to remove useless resources in build shrinkResources true is configured in gradle, and useless resources will be automatically removed when packaging. However, experiments show that the package will not, but will replace some useless resources with smaller things. Note that "useless" here means that calling all the parent functions of the picture is ultimately obsolete code, and shrinkResources true can only remove the situation that there are no parent function calls.
    android {
        buildTypes {
            release {
                shrinkResources true
            }
        }
    }
In addition, most applications do not need to support internationalization of dozens of languages, and language support files can also be deleted.
6.2 resource compression
In android development, there are many built-in pictures, which occupy a lot of volume. Therefore, in order to reduce the volume of the package, we can compress the resources. Common methods are:
- Use compressed images: using compressed images can effectively reduce the volume of the App.
- Only one set of pictures: for most apps, only one set of design drawings is enough.
- Use jpg images without alpha value: for non transparent large images, JPG will have a significant advantage over png. Although it is not absolute, it will usually be reduced to more than half.
- Using tinypng lossy compression: it supports uploading PNG pictures to the official website for compression, then downloading and saving. Under the condition of maintaining the alpha channel, the compression of PNG can reach within 1 / 3, and the compression loss can not be distinguished by the naked eye.
- Use webp format: webp supports transparency, compression ratio and smaller volume than JPG images. Native support from Android 4.0 +, but including transparency is not supported until Android 4.2 1 + only supports the display of webp with transparency. Pay special attention when using it.
- Using svg: vector graph is composed of points and lines. Unlike bitmap, it can maintain clarity even when zoomed in. Moreover, using vector graph can save 30 ~ 40% space than bitmap design scheme.
- Compress the packaged pictures: use 7zip compression method to compress the pictures. You can directly use the wechat open source AndResGuard compression scheme.
    apply plugin: 'AndResGuard'
    buildscript {
        dependencies {
            classpath 'com.tencent.mm:AndResGuard-gradle-plugin:1.1.7'
        }
    }
    andResGuard {
        mappingFile = null
        use7zip = true
        useSign = true
        keepRoot = false
        // add <your_application_id>.R.drawable.icon into whitelist.
        // because the launcher will get thgge icon with his name
        def packageName = <your_application_id>
                whiteList = [
        //for your icon
        packageName + ".R.drawable.icon",
                //for fabric
                packageName + ".R.string.com.crashlytics.*",
                //for umeng update
                packageName + ".R.string.umeng*",
                packageName + ".R.string.UM*",
                packageName + ".R.string.tb_*",
                packageName + ".R.layout.umeng*",
                packageName + ".R.layout.tb_*",
                packageName + ".R.drawable.umeng*",
                packageName + ".R.drawable.tb_*",
                packageName + ".R.anim.umeng*",
                packageName + ".R.color.umeng*",
                packageName + ".R.color.tb_*",
                packageName + ".R.style.*UM*",
                packageName + ".R.style.umeng*",
                packageName + ".R.id.umeng*"
        ]
        compressFilePattern = [
        "*.png",
                "*.jpg",
                "*.jpeg",
                "*.gif",
                "resources.arsc"
        ]
        sevenzip {
            artifact = 'com.tencent.mm:SevenZip:1.1.7'
            //path = "/usr/local/bin/7za"
        }
    }
6.3 resource dynamic loading
In front-end development, dynamically loading resources can effectively reduce the volume of APK. In addition, it only supports mainstream architectures, such as arm. mips and x86 architectures can be considered unsupported, which can greatly reduce the volume of APK.
Of course, in addition to the optimization scenarios mentioned above, the optimization of Android App also includes storage optimization, multithreading optimization and crash processing.
Video:
Android Performance Optimization: memory optimization / startup optimization / power consumption optimization / apk slimming / screen adaptation
Preparing for 2022 Android interview: detailed analysis of high-frequency interview questions of BAT front-line large factories
Original text: https://juejin.cn/post/6970613873040687141