Performance monitoring and testing is an important part of advanced technology in Android development, and it is a necessary skill for infrastructure development. As the saying goes, if you want to do a good job, you must first sharpen your tools. First, you should master the use of various tools officially provided by Android. Further, we should develop our own performance testing tools by exploring their principles.
Test index and test method
| index | Tools or methods | remarks |
|---|---|---|
| Start time | adb am | - |
| Memory occupation | Memory Profiler | |
| Caton analysis | SysTrace, Looper monitoring, dumpsys | |
| UI layout | LayoutInspector | |
| ANR | ANR-WatchDog | |
| Network speed detection | ||
| Power consumption | Battery Historian |
In addition, there are some online / offline performance testing tools:
UI performance
When an xml layout is loaded into activity/fragment for the first time, it needs to experience:
Due to the caching mechanism of class objects, performance bottlenecks usually occur when they are loaded for the first time. We should try to reduce the nesting depth of xml layout by reconstructing xml [1], but the optimization effect of this method is very limited. At this time, if thorough optimization is needed, we should consider using AsyncLayoutInflator [2] to load the layout asynchronously, so as to completely solve the main process Caton problem.
Using asynchronous loading layout does not really solve the problem of time-consuming layout loading. We recall that the root of this Caton is that the xml loading mechanism must involve IO and reflection. If you use pure code to write layout, there will be no such problem. At present, some geeks think of using annotation processor to convert xml directly into Java code in the compiler, X2C [3] That's it. Open source projects. However, this is not a perfect solution. For example, when the xml attribute has no corresponding setXXX method (ProgressBar, SeekBar, etc.), the generated Java code will have problems.
network optimization
- Optimize DNS: use HttpDNS
- Connection reuse: enable keep alive, which is enabled by default
- Data compression: enable gzip compression
- Resource classification: download pictures with different definition according to network conditions
Network request policy:
- If there is no network, no network request will be initiated;
- Give priority to WiFi;
- Non important network requests such as statistical logs are sent after the WiFi environment;
Battery Improve
- Reuse of common services such as location services and message push services;
- The front desk does not apply for WakeLock or uses the method with timeout, and uses FLAG_KEEP_SCREEN_ON keep the screen always on;
SysTrace
sysTrace It is an old version of CLI tool for system tracking, which is implemented based on python 2.7,. The generated report is an HTML file. Open it with a browser, and its interface is roughly as follows:
Screenshot of Systrace HTML report showing 5 seconds of interaction with an application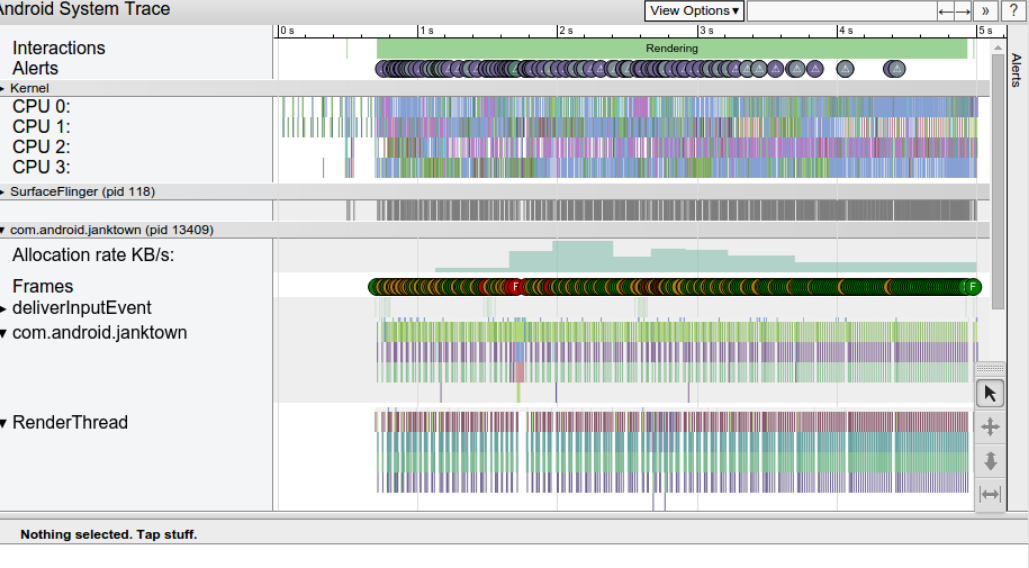
The so-called "system tracking" is to capture and record the activity of the equipment in a certain period of time (including but not limited to CPU utilization, thread activity, disk activity, etc.), and generate tracking files (Perfetto or Systrace format, according to specific tools). These files can be used to generate system reports (html or other display forms);
Generate report
CLI command generation
python systrace.py -a com.example.myapp -b 16384 \
-o my_systrace_report.html sched freq idle am wm gfx view binder_driver hal \
dalvik camera input res
- -a: Specify the process name, usually the package name;
- -b: Specify the buffer size;
- -o: Specify the file path of the output report;
- -t: Track device activity for N seconds. If you do not specify this option, systrace will prompt you to press Enter on the command line to end the trace;
- -e: Specify equipment serial number;
- categories: specify the information to be tracked, including sched, freq, idle, am, wm, gfx, system process of rendering graphics, view and binder_driver, hal, dalvik, camera, input, res, etc. you can view the list of services available for connected devices through systrace -l;
- After actual test, systrace Py only supports python 2.7 and cannot be used in Python 3.0 X, which needs attention;
- The real-time capture also supports the generation of HTML reports by specifying trace files;
android.os.Debug generation
Can be used to generate trace file, which is used to import analysis in Systrace or CPU Profiler. Use examples are as follows:
public class XXXActivity extends BaseActivity {

    @Override
    protected void onCreate(@Nullable Bundle savedInstanceState) {
        // Generated The trace file is located in: sdcard/Android/data/package_name/files/XXXActivity_1111.trace
        Debug.startMethodTracing("XXXActivity_"+ System.currentTimeMillis());
        ...
    }

    @Override
    protected void onDestroy() {
        super.onDestroy();
        Debug.stopMethodTracing();
    }
}
Then use ADB to pull to the development machine and import it into Profiler, or directly use AS's Device File Explorer to double-click to open it:
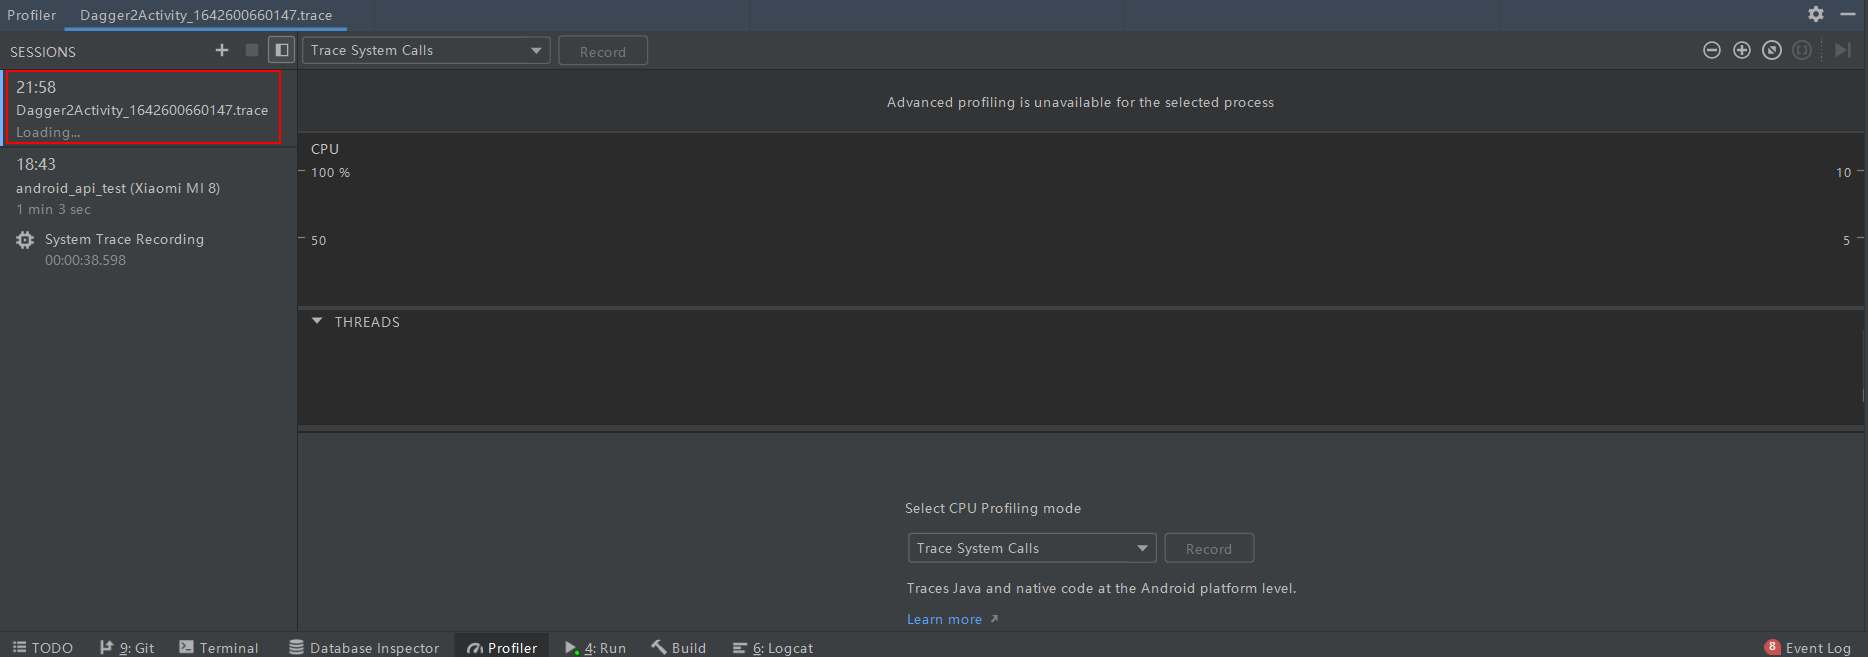
It should be noted that:
- After the profiling function is enabled, the running speed of the application will slow down;
- trace files with the same name will overwrite each other, so the file name should be unique;
Read the report
from Introduction to the official website of Systrace Report We can learn that we usually focus on the Yellow Frames in Frames. By clicking the corresponding yellow dots, we can view the call stack to locate the problem points.
Custom event
android. os. As an auxiliary API tool provided by the SDK, trace can help us realize the statistics of custom events. according to Introduction to official website , use examples are as follows:
- Demo Java layer new definition custom event
list_item.setOnItemClickListener((parent, view, position, id) -> {
    // Track the time consumption of list item click events
    Trace.beginSection("OnListItemClick");
    try {
        ......
    } finally {
        // To ensure trace Endsection is executed. It is recommended to put it in the finally block
        Trace.endSection();
    }
});
- Demonstrate adding and defining custom events in native layer
//1. Define the function pointer of the ATrace function used to capture custom events in the game
#include <android/trace.h>
#include <dlfcn.h>

void *(*ATrace_beginSection) (const char* sectionName);
void *(*ATrace_endSection) (void);

typedef void *(*fp_ATrace_beginSection) (const char* sectionName);
typedef void *(*fp_ATrace_endSection) (void);

//2. Load the ATrace symbol at runtime, as shown in the following code snippet. This procedure is typically performed in the object constructor
// Retrieve a handle to libandroid.
void *lib = dlopen("libandroid.so", RTLD_NOW || RTLD_LOCAL);

// Access the native tracing functions.
if (lib != NULL) {
    // Use dlsym() to prevent crashes on devices running Android 5.1
    // (API level 22) or lower.
    ATrace_beginSection = reinterpret_cast<fp_ATrace_beginSection>(
        dlsym(lib, "ATrace_beginSection"));
    ATrace_endSEction = reinterpret_cast<fp_ATrace_endSection>(
        dlsym(lib, "ATrace_endSection"));
}


//3. Call atrace at the beginning and end of the custom event respectively_ Beginsection() and ATrace_endSection()
#include <android/trace.h>

char *customEventName = new char[32];
sprintf(customEventName, "User tapped %s button", buttonName);

ATrace_beginSection(customEventName);
// Your app or game's response to the button being pressed.
ATrace_endSection();
Then run the APP, click the operation list item, and the colleague enables the CPU Profiler of AS to record the process. After recording, the corresponding custom event will be seen in the analysis report:
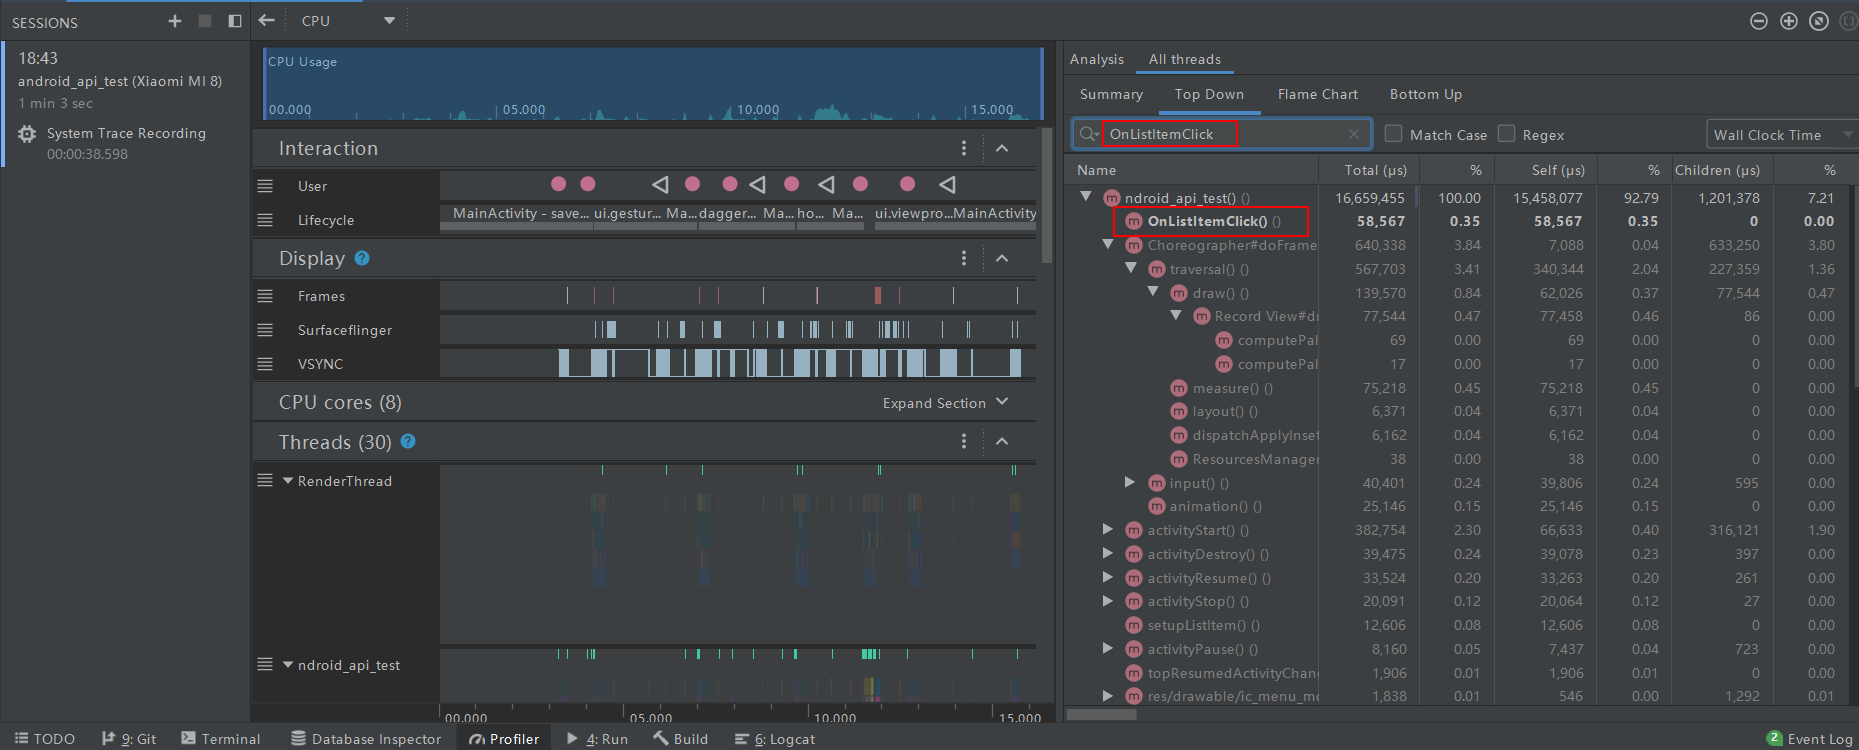
System Tracing
A terminal tool running on Android 9 (API level 28) or higher. Its function is similar to systrace. It is used to directly obtain tracking data on mobile phones and generate Perfetto trace [new system, open with Perfetto] / ctrace [old system, generate report with systrace] file.
Specific usage reference: Capture system trace records on devices
TraceView
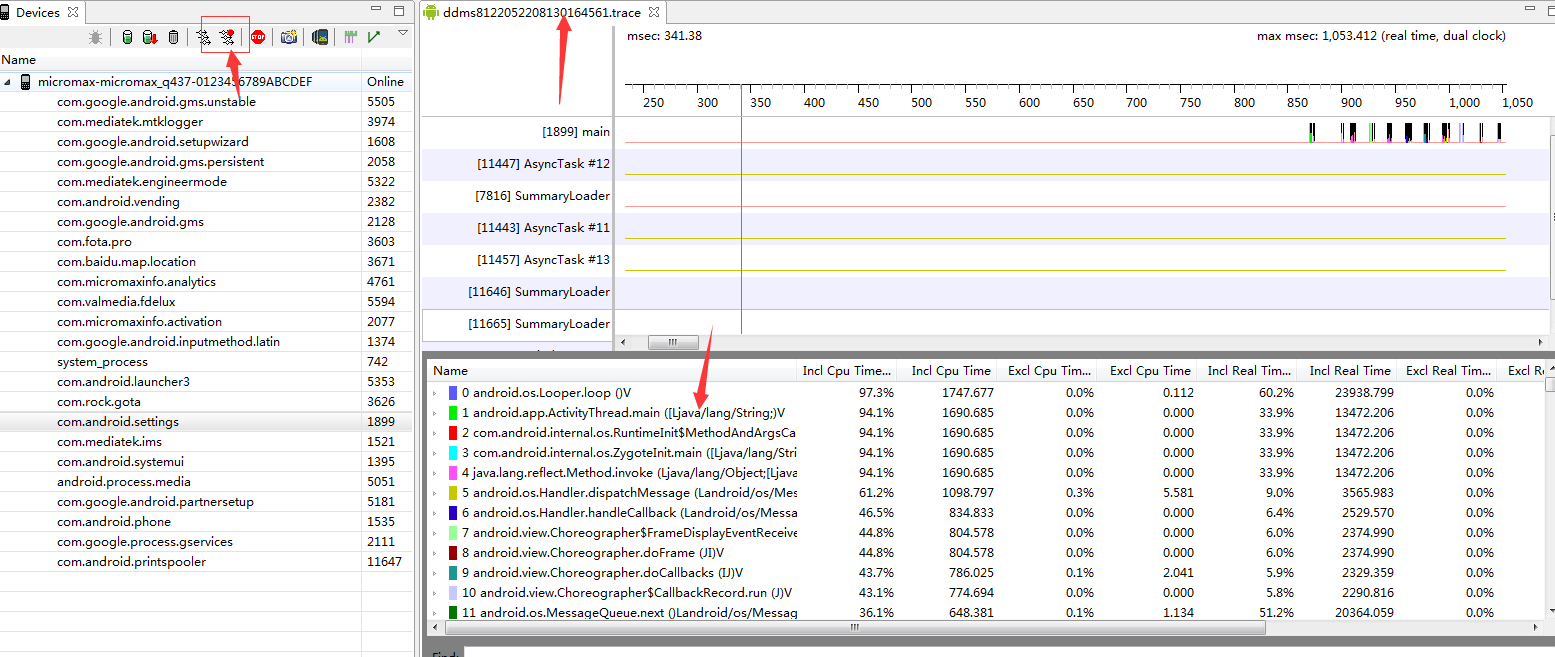
A graphical log viewing tool with Android Device Monitor, which can open the log generated by Systrace trace. The screenshot is as follows:
LayoutInspector
The layout detection tool of AS can view the detailed tree structure of the currently running activity layout.
Profiler
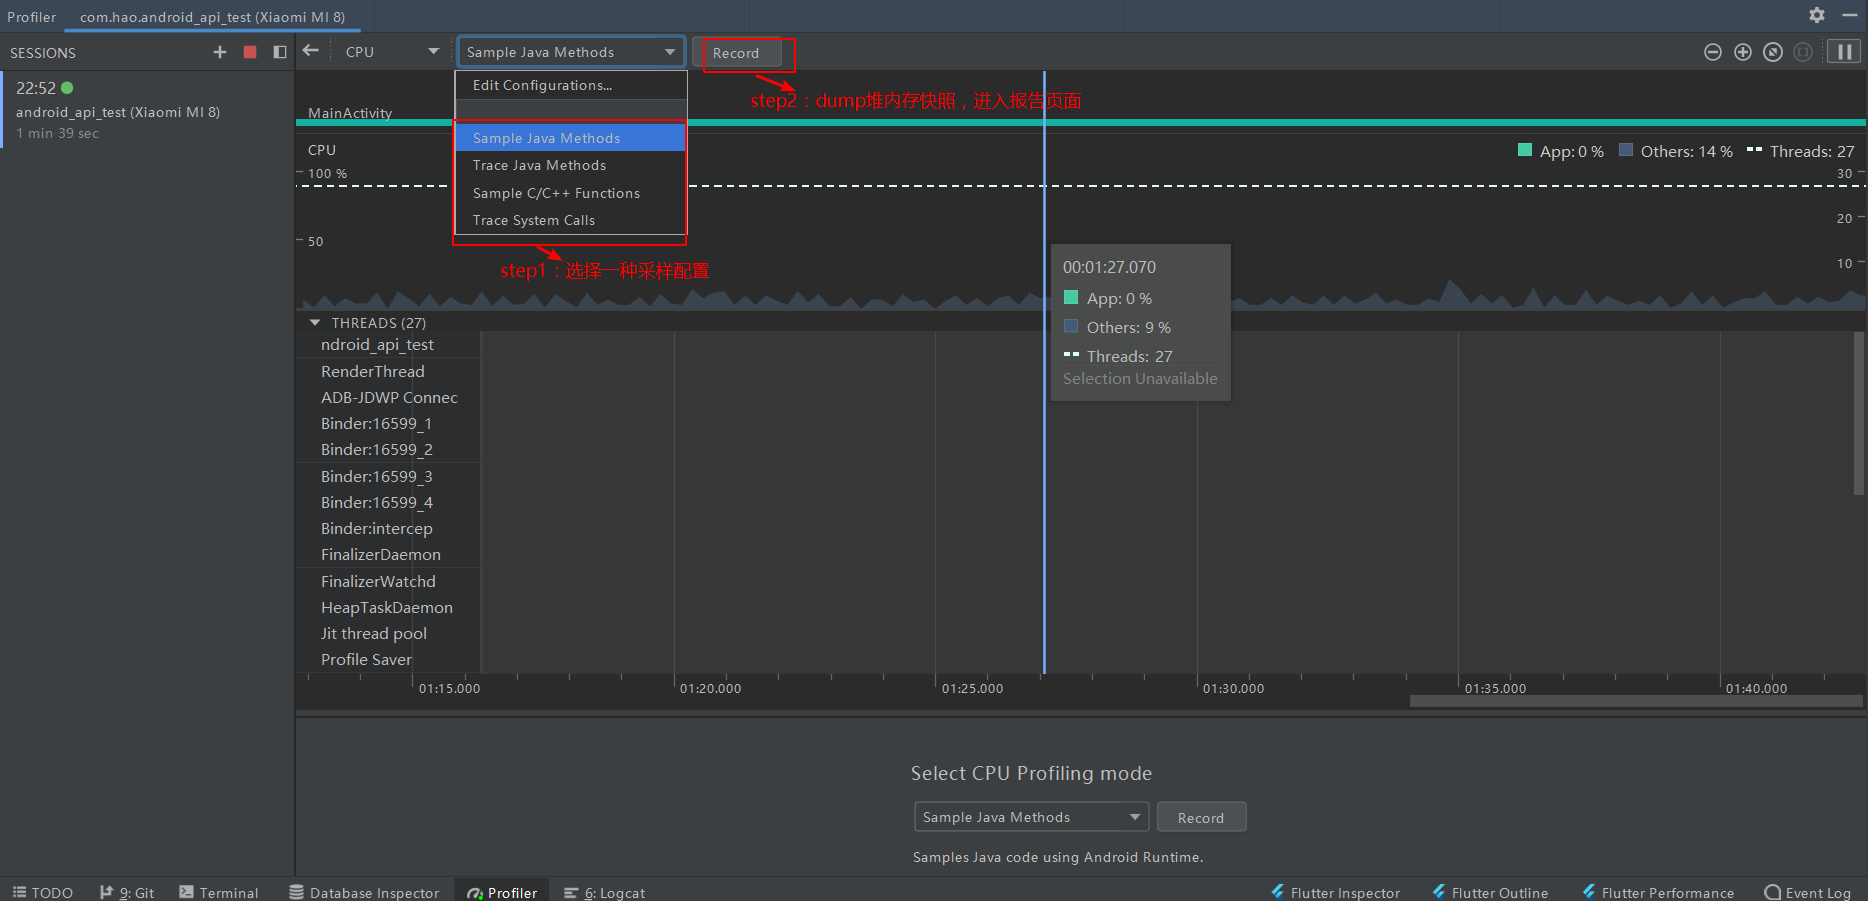
CPU Profiler
Official instructions for AS CPU Profiler

Memory Profiler
To be continued
Network Profiler
To be continued
Energy Profiler
To be continued
code detection
Looper monitor
Why does the code of the main thread end up in looper Execute in loop()?
After the APP is started, the main thread ActivityThread is blocked in the loop queue most of the time In the nativePollOnce() method in next (), thanks to the Linux pipe/epoll mechanism, the mainline will not occupy CPU resources like the thread blocking caused by exclusive lock in our daily multi-threaded development. At this time, the main thread will release CPU resources and enter the sleep state until the next message arrives or a transaction occurs. Write data to the write end of the pipe to wake up the main thread.
Who wakes up the main thread after it hibernates? The answer is messages from other threads in the same process. For example, when we start an activity, we actually execute the following IPC communication process:
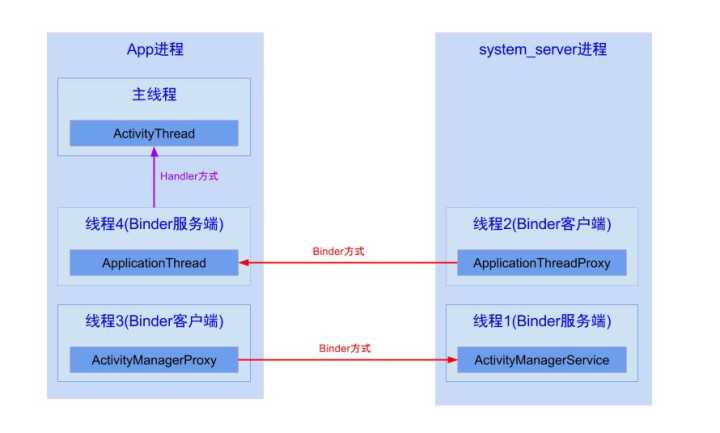
After receiving the message, thread 4 (ApplcaitionThread) passes through ActivityThread The H instance sends a message to the main thread, and then triggers the ActivityThread in the main thread (ActivityThread) H. Handlemessage () method, from the corresponding three component life cycle methods of executing AMS.
So far, we can understand that the code logic we write is finally transformed into messages in MessageQueue and displayed in MSG target. dispatchMessage (MSG) is executed. Therefore, it is obvious to detect the jamming. As long as the time-consuming time of this method can be used to judge whether the jamming has occurred. As it happens, Looper#mLogging prints log messages before and after the execution of dispatchMessage, which allows us to judge whether the method is completed or not by detecting the contents printed before and after the log.
- Threads 1, 2, 3 and 4 in the above figure refer to the threads in the Binder thread pool. Because Binder methods are all running in this thread pool, although ApplcaitionThread and AcitvityThread run in APP processes, they are different threads, so they still need to communicate with the Handler;
- Handler is a bridge for communication between different threads in the same process. Although this is common sense, it should be emphasized.
- Looper. In the loop () method, the Trace#traceBegin/Trace#traceEnd method is also executed before and after the dispatchMessage, which is the implementation principle of Systrace.
Code implementation example
private void check() {
    Looper.getMainLooper().setMessageLogging(new Printer() {
        private final String START = ">>>>> Dispatching to";
        private final String END = "<<<<< Finished to";

        @Override
        public void println(String s) {
            if (s.startsWith(START)) {
                mCheckTask.start();
            } else if (s.startsWith(END)) {
                mCheckTask.end();
            }
        }
    });
}

private class CheckTask {
    private HandlerThread mHandlerThread = new HandlerThread("Caton test");
    private Handler mHandler;

    private final int THREAD_HOLD = 1000;

    public CheckTask() {
        mHandlerThread.start();
        mHandler = new Handler(mHandlerThread.getLooper());
    }

    private Runnable mRunnable = new Runnable() {
        @Override
        public void run() {
            log();
        }
    };

    public void start() {
        mHandler.postDelayed(mRunnable, THREAD_HOLD);
    }

    public void end() {
        mHandler.removeCallbacks(mRunnable);
    }
}


/**
* Output the current exception or error stack information.
*/
private void log() {
    StringBuilder sb = new StringBuilder();
    StackTraceElement[] stackTrace = Looper.getMainLooper().getThread().getStackTrace();
    for (StackTraceElement s : stackTrace) {
        sb.append(s + "\n");
    }

    Log.w(TAG, sb.toString());
}
Related open source libraries
Choreographer
The tool class provided by the Android SDK is used to obtain the FPS data drawn on the current screen in real time.
Related open source libraries
In fact, Google's official website also introduces relevant methods for detecting UI drawing frame rate: Test interface performance , the adb dumpsys tool is used. You can have a look at it if you are interested.
LayoutInflaterCompat.setFactory2
The hook entry provided by layoutinflator, which can be used to count the loading time of each View.
Debug
android. os. The debug tool class provides many functions related to debugging and performance detection, such as:
-
startMethodTracing/stopMethodTracing
Call these two methods before and after the user method to generate trace file. -
dumpHprofData(String fileName)
Save a memory snapshot to a local file, which may be very large and cannot be used in a production environment.