1. Introduction to unidbg
unidbg is a reverse tool based on unicorn to simulate the execution of binary programs. It allows security researchers to run android or ios dynamic library files directly on PC and call their methods to see the functions supported by the tool.
The supported functions are as follows:
- Supports simulated execution of JNI call API so that JNI can be called_ OnLoad
- Support JavaVM, JNIEnv
- Supports simulating syscalls calls calls
- Support ARM32 and ARM64
- Implementation of inline hook based on HookZz
- import hook based on xHook implementation
- Support iOS fishhook, substrate and whale hook
- Support simple console debugger, gdb, IDA, android debugger server, instruction tracking and memory read / write tracking.
- Supports iOS objc and Swift
2. Installation of unidbg
2.1. Download the unidbg tool
Download address: unidbg
2.2. Import IDEA
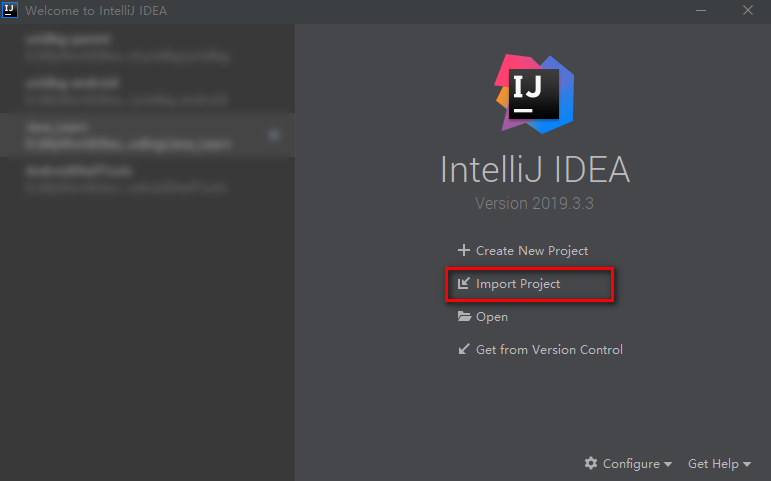
Open IDEA and click the Import Project button.
It should be noted here that once some partners open the IDEA, it is not the following page, but the previous project page. In this case, click Project from Existing Sources... Under file - > New in the IDEA tool to enter the next page.
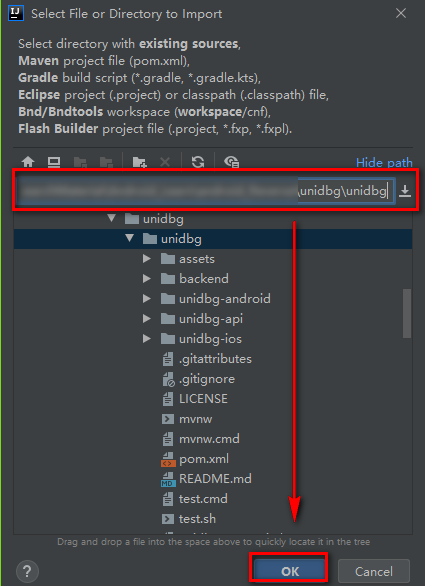
After entering this page, fill in the previously downloaded unidbg source code path and click OK.
Then the following page will pop up. Let's select the project type and Maven project. After clicking the Finish button, the IDEA will start importing.
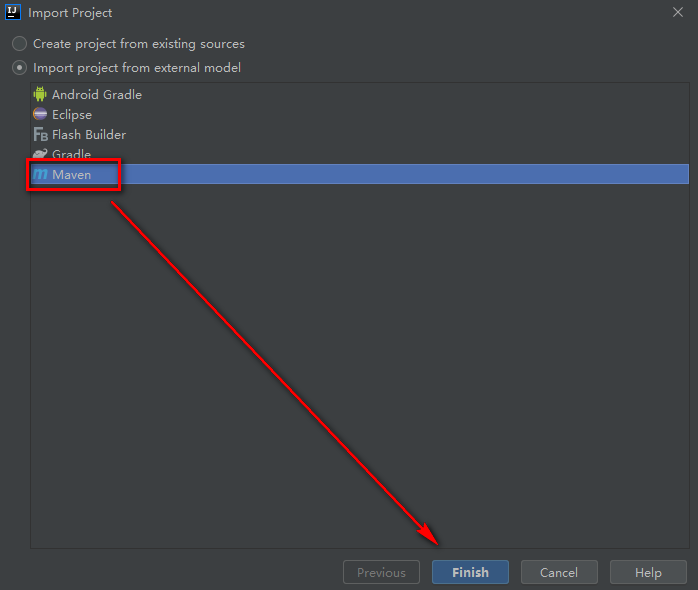
At this time, you may need to wait for a while. IDEA will download some dependencies when importing the project. Remember to keep the network unobstructed, and then it will be finished.
2.3. Verify that the import was successful
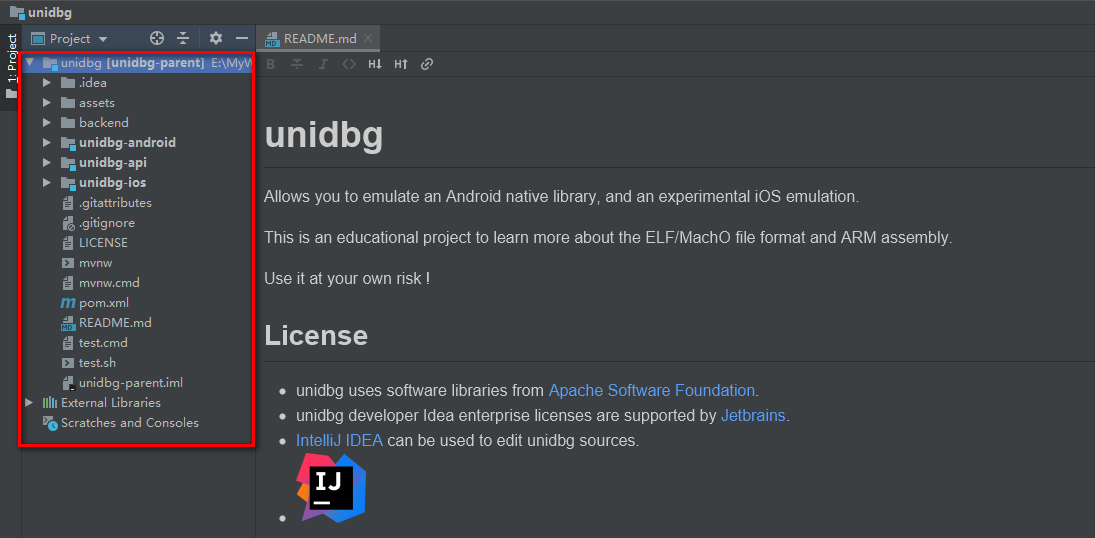
After the IDEA imports the whole project, you can see a page similar to the following figure. Mainly look at the contents in the red box on the left. This is the view of the whole project. You can see that the whole unidbg project includes three sub projects: unidbg Android, unidbg API and unidbg IOS.
In the unidbg Android subproject, we find the test class "com. Byedance. Frameworks. Core. Encrypt" provided by the author, and then click Run ttencrypt Main method.
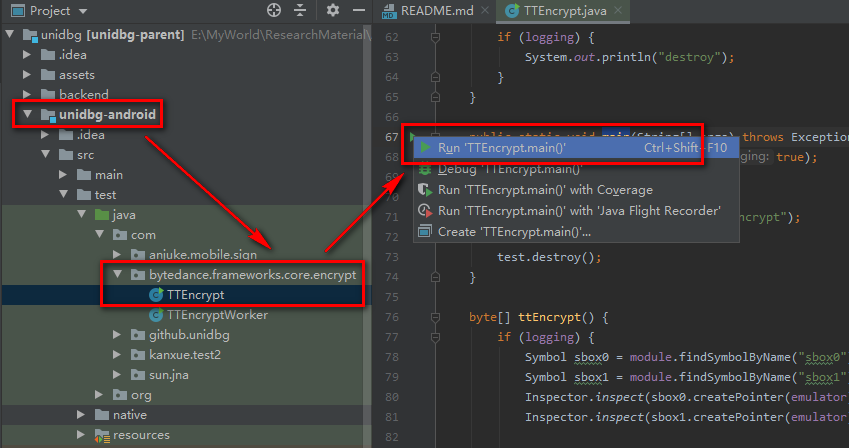
If the running result is as follows, the whole project is imported successfully.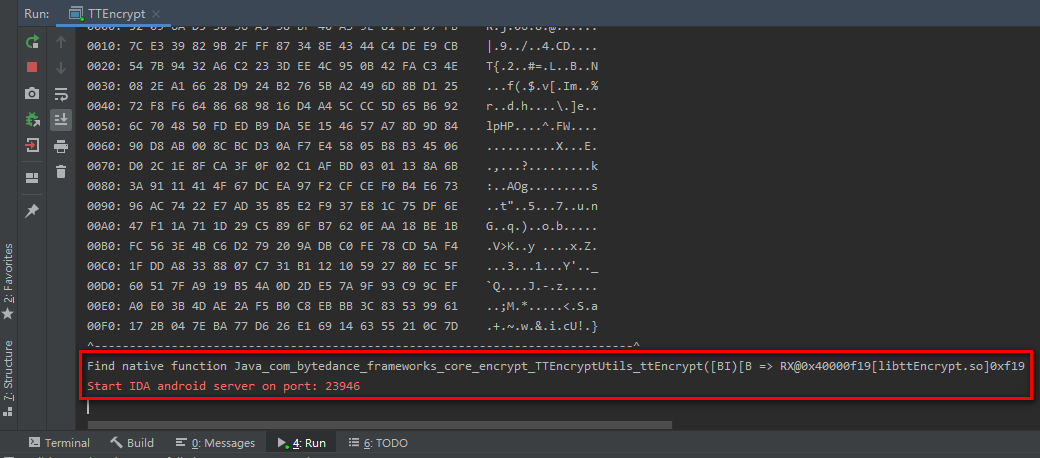
Then we began our formal analysis.
3. Use of unidbg
3.1. Static analysis of target method
After successfully testing the examples given by the author, we can find some examples to simply learn the use of unidbg, which can be used directly here White dragon boss The example in the blog (liboasis score. So).
First, take a look at the target method to be called this time. The target method is in target In the DEX file, this file is shelled by the white dragon boss. If you are interested in shelling, you can try shelling. It has been said before that common shelling methods are used“ Actual sign analysis - XX partner_ v4. zero point nine"
Sample APK: Oasis_ v3. five point eight
Here we will directly target Drop DEX into JEB tool and locate com weibo. xvideo. Nativeapi class, which is a class full of native methods. The method to be simulated this time is a native method named s, which contains two parameters. Parameter 1 is a byte array and parameter 2 is a boolean variable.
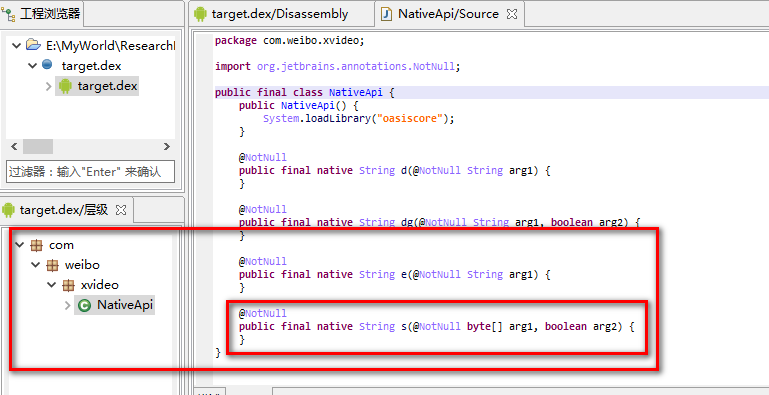
Now we have the target method, but we don't know where this method is implemented, so we need to find the implementation address of this method so that we can use unidbg to simulate execution.
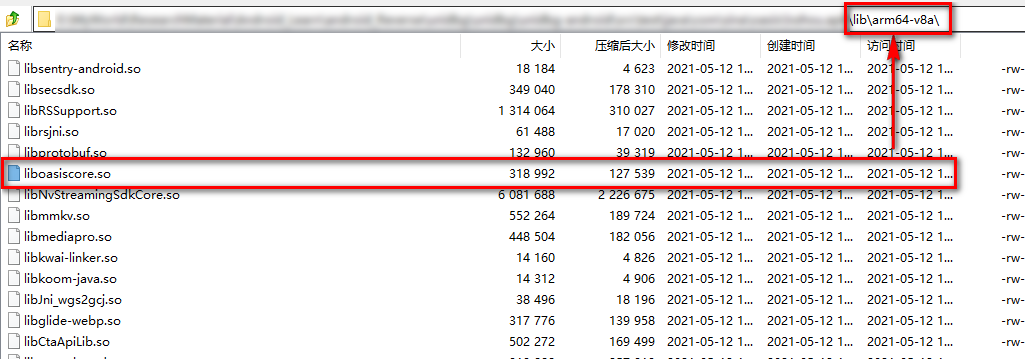
According to system. In the NativeApi constructor Loadlibrary knows that these native methods are in liboasis score The so file can be found in the following directory in the original apk using the decompression software.
Here, you need to pay attention to the number of bits of your own testing machine. I have a 64 bit system here, so I choose so in the arm64-v8a directory.
After finding the so of the target method, you can use IDA tool to statically analyze the so to get the address of the target method.
However, the address of the target method can not be obtained directly by simply using IDA static analysis. Generally, if the native method uses static binding, you can locate the target method by searching java and other keywords in the function window of IDA. This is mainly due to the fact that the method name of static binding needs to follow a fixed format, while the target method adopts dynamic binding, Dynamic binding does not have such a limitation that it must be named according to a fixed format, so you need to find the location of the dynamic binding target method in so before you can locate the location of the target method code implementation.
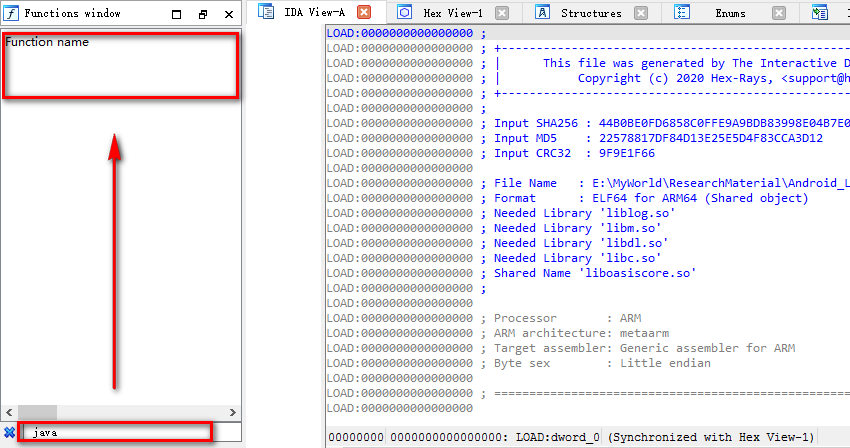
Generally so, the implementation of dynamic binding of native methods is put in JNI_ In the onload method, first locate JNI_OnLoad method, and then find the implementation of dynamic binding.
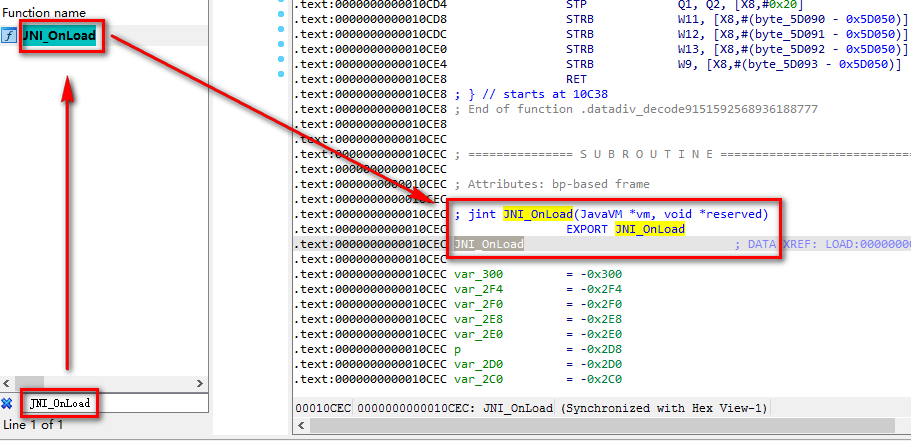
Find JNI_ After the onload method, it is found that this method has actually been confused by OLLVM. In this way, it seems unrealistic to find the location of the target method through static analysis. This is the end of our static analysis. Let's start our dynamic analysis process.
The previous dynamic analysis used Frida framework to hook some key methods in the application. This time, another way is used to realize dynamic analysis - simulation execution.
3.2. Simulation execution target method
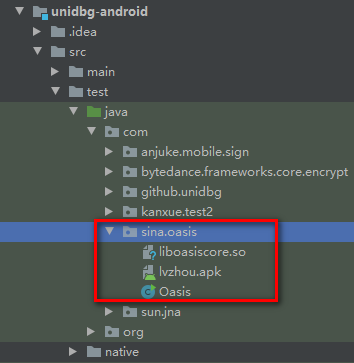
Open the previously configured unidbg project, and create a com. Com in the src/test/java / directory of the unidbg Android subproject of the project sina. oasis. Oasis class and inherits from AbstractJni class. It is mainly used to write the code for our simulation to execute so, and the target so file liboasis score So and the original apk are also placed in this directory.
After the whole framework is ready, start on COM sina. oasis. Write code that simulates execution in the oasis class.
Because the target method s is in JNI_ The onload method implements dynamic binding, so you need to implement JNI first_ Simulation execution of the onload method.
JNI_ The onload method is simulated as follows:
package com.sina.oasis;

import com.github.unidbg.AndroidEmulator;
import com.github.unidbg.Module;
import com.github.unidbg.linux.android.AndroidEmulatorBuilder;
import com.github.unidbg.linux.android.AndroidResolver;
import com.github.unidbg.linux.android.dvm.AbstractJni;
import com.github.unidbg.linux.android.dvm.DalvikModule;
import com.github.unidbg.linux.android.dvm.DalvikVM;
import com.github.unidbg.linux.android.dvm.VM;
import com.github.unidbg.linux.android.dvm.array.ByteArray;
import com.github.unidbg.memory.Memory;

import java.io.File;
import java.nio.charset.StandardCharsets;
import java.util.ArrayList;
import java.util.List;

public class Oasis extends AbstractJni {
    private final AndroidEmulator emulator;
    private final VM vm;
    private final Module module;

    Oasis(){
        // Create a simulator instance. It is recommended to fill in the process name according to the actual process name, which can avoid the verification of process name in some so
        emulator = AndroidEmulatorBuilder.for64Bit().setProcessName("com.sina.oasis").build();
        // Set the memory operation interface of the simulator
        final Memory memory = emulator.getMemory();
        // Set system class library resolution
        memory.setLibraryResolver(new AndroidResolver(23));
        // Create an Android virtual machine and pass in APK. Unidbg can do some signature verification for us
        vm = emulator.createDalvikVM(new File("unidbg-android/src/test/java/com/sina/oasis/lvzhou.apk"));
        // Load so into the virtual memory. The meaning of the second parameter indicates whether to execute the initialization code of the dynamic library
        DalvikModule dm = vm.loadLibrary(new File("unidbg-android/src/test/java/com/sina/oasis/liboasiscore.so"),true);
        // Gets the handle to the so module
        module = dm.getModule();
        // Set JNI
        vm.setJni(this);
        // Print log
        vm.setVerbose(true);
        // Call JNI method
        dm.callJNI_OnLoad(emulator);;   // Call JNI_OnLoad
    }

    public static void main(String[] args){
        Oasis oasis = new Oasis();
    }
}
The above code simulates the execution of the target so on the PC and calls JNI_ Functions of the onload method.
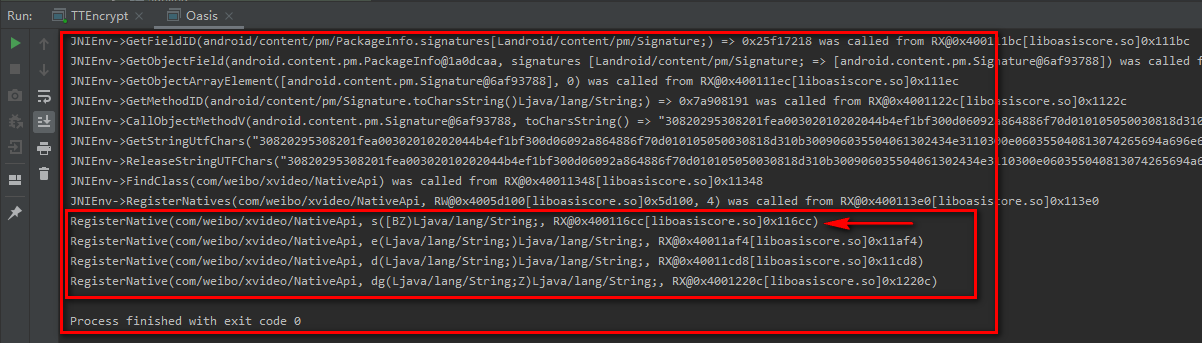
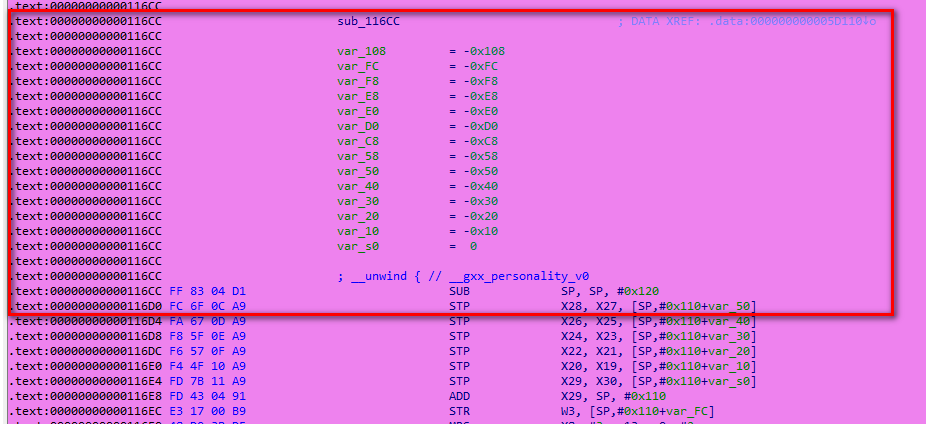
You can see JNI through the output log_ OnLoad methods are invoked in the process of execution. At the same time, we can also see the address of the memory where our target method is dynamically bound. unidbg also friendly to help us export the address 0x116CC of the method in so file.
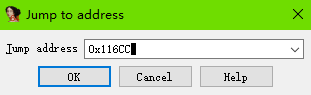
With this address, you can easily locate the location of the target method in IDA.
Use the IDA shortcut key G to quickly jump to the target address.
After having the address of the target method, the following begins to simulate the execution of the target method.
The simulation of the target method s is performed as follows:
package com.sina.oasis;
import com.github.unidbg.AndroidEmulator;
import com.github.unidbg.Module;
import com.github.unidbg.linux.android.AndroidEmulatorBuilder;
import com.github.unidbg.linux.android.AndroidResolver;
import com.github.unidbg.linux.android.dvm.AbstractJni;
import com.github.unidbg.linux.android.dvm.DalvikModule;
import com.github.unidbg.linux.android.dvm.DalvikVM;
import com.github.unidbg.linux.android.dvm.VM;
import com.github.unidbg.linux.android.dvm.array.ByteArray;
import com.github.unidbg.memory.Memory;
import java.io.File;
import java.nio.charset.StandardCharsets;
import java.util.ArrayList;
import java.util.List;
public class Oasis extends AbstractJni {
private final AndroidEmulator emulator;
private final VM vm;
private final Module module;
Oasis(){
// Create a simulator instance. It is recommended to fill in the process name according to the actual process name, which can avoid the verification of process name in some so
emulator = AndroidEmulatorBuilder.for64Bit().setProcessName("com.sina.oasis").build();
// Set the memory operation interface of the simulator
final Memory memory = emulator.getMemory();
// Set system class library resolution
memory.setLibraryResolver(new AndroidResolver(23));
// Create an Android virtual machine and pass in APK. Unidbg can do some signature verification for us
vm = emulator.createDalvikVM(new File("unidbg-android/src/test/java/com/sina/oasis/lvzhou.apk"));
// Load so into the virtual memory. The meaning of the second parameter indicates whether to execute the initialization code of the dynamic library
DalvikModule dm = vm.loadLibrary(new File("unidbg-android/src/test/java/com/sina/oasis/liboasiscore.so"),true);
// Gets the handle to the so module
module = dm.getModule();
// Set JNI
vm.setJni(this);
// Print log
vm.setVerbose(true);
}
public String call_native_s(){
// Parameters for constructing jni method
List<Object> arg_list = new ArrayList<>(10);
// Parameter 1: JNIEnv *env
arg_list.add(vm.getJNIEnv());
// Parameter 2: jobobject or jclass are generally not used. Just fill in 0
arg_list.add(0);
// Parameter 3: bytes
String input = "aid=01A-khBWIm48A079Pz_DMW6PyZR8" +
"uyTumcCNm4e8awxyC2ANU.&cfrom=28B529501" +
"0&cuid=5999578300&noncestr=46274W9279Hr1" +
"X49A5X058z7ZVz024&platform=ANDROID×tamp" +
"=1621437643609&ua=Xiaomi-MIX2S__oasis__3.5.8_" +
"_Android__Android10&version=3.5.8&vid=10190135" +
"94003&wm=20004_90024";
byte[] input_bytes = input.getBytes(StandardCharsets.UTF_8);
ByteArray input_byte_array = new ByteArray(vm,input_bytes);
arg_list.add(vm.addLocalObject(input_byte_array));
// Parameter 4: Boolean false fill in 0
arg_list.add(0);
// Call the target method when the parameter is ready
Number number = module.callFunction(emulator,0x116CC,arg_list.toArray())[0];
return vm.getObject(number.intValue()).getValue().toString();
}
public static void main(String[] args){
Oasis oasis = new Oasis();
System.out.println("Native Method return value:" + oasis.call_native_s());
}
}
Output log after running.
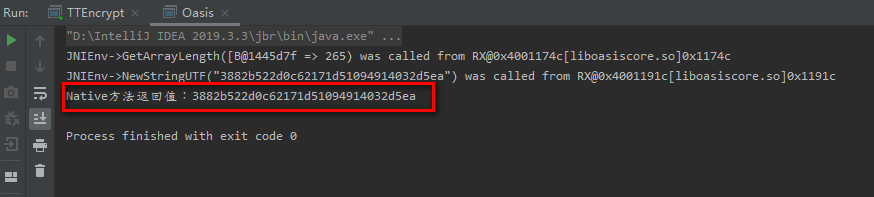
You can see that the result returned after the execution of the target method is a 32-bit string. Generally, the 32-bit may be the Hash algorithm. Let's analyze the algorithm used by the target method s.
3.3. algorithm analysis
Firstly, the findhash tool is used to detect the common Hash algorithms that may be used in the target so.
usage method
- download findhash
- Put findhash XML and findhash Py is placed in the plugins directory of IDA
- Use ida7 5 after loading so, click Edit - > plugin - > findcash in the IDA toolbar to run
The test results of findcash tool are as follows:
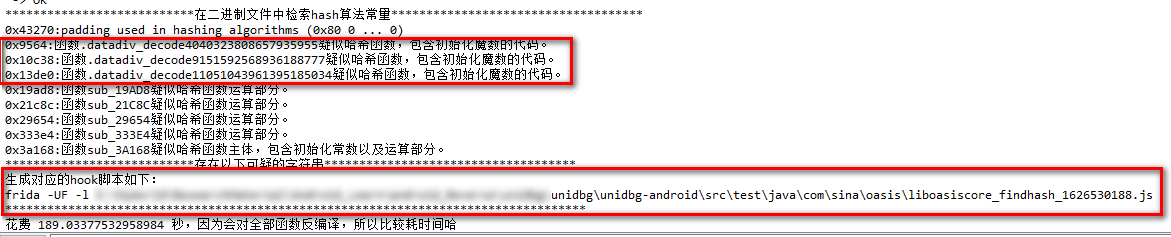
Tips: three suspected hash function codes are found. At the same time, it also friendly helps us generate the hook code based on frida. We use the generated code to verify the algorithm.
λ frida -U -f com.sina.oasis -l liboasiscore_findhash_1626530188.js --no-pause
     ____
    / _  |   Frida 14.2.2 - A world-class dynamic instrumentation toolkit
   | (_| |
    > _  |   Commands:
   /_/ |_|       help      -> Displays the help system
   . . . .       object?   -> Display information about 'object'
   . . . .       exit/quit -> Exit
   . . . .
   . . . .   More info at https://www.frida.re/docs/home/
Spawned `com.sina.oasis`. Resuming main thread!
TypeError: cannot read property 'add' of null
    at hook_suspected_function (/liboasiscore_findhash_1626530188.js:26)
    at main (/liboasiscore_findhash_1626530188.js:52)
    at apply (native)
    at <anonymous> (frida/runtime/core.js:45)
The first time we tried to report an error directly, the analysis found that the timing of the hook was wrong, because we started the hook when the program was started, and the target so had not been loaded into memory at this time, so an error would be reported.
Modification code:
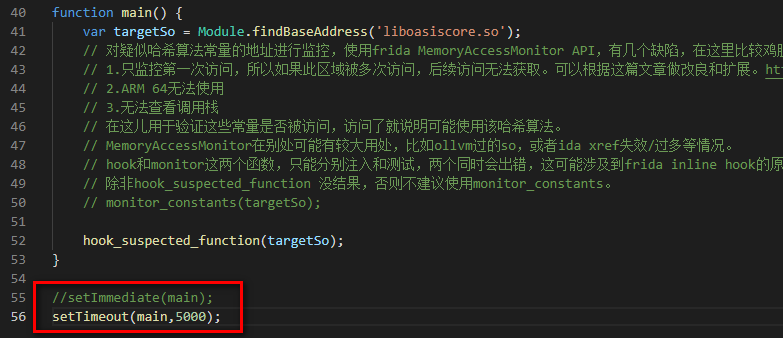
Automatically generated setImmediate(main) in js code; Change to setTimeout(main,5000); Call the main method immediately before turning it into 5 seconds and then call the main method, so that hook can be completed after the target so is loaded, and no previous error will be reported.
λ frida -U -f com.sina.oasis -l liboasiscore_findhash_1626530188.js --no-pause
     ____
    / _  |   Frida 14.2.2 - A world-class dynamic instrumentation toolkit
   | (_| |
    > _  |   Commands:
   /_/ |_|       help      -> Displays the help system
   . . . .       object?   -> Display information about 'object'
   . . . .       exit/quit -> Exit
   . . . .
   . . . .   More info at https://www.frida.re/docs/home/
Spawned `com.sina.oasis`. Resuming main thread!
[Nexus 5X::com.sina.oasis]->
It was found that although no error was reported, it was found that the application did not hit our hook code after a few random operations after startup. There are still some problems with using findcash script directly. The author also said that there are still some problems with arm64 adaptation. It seems that we can only analyze it manually.
3.3.1.OLLVM de confusion
According to the previous analysis, we know that the application adds OLLVM confusion to the methods in so. If it is analyzed manually, the first step is to remove the confusion, so that the analysis will not be lost in the ocean of code.
The idea of this use is as follows:
1. First, use unidbg to perform instruction level trace on the target method to get all the instruction addresses of the target method that will be executed;
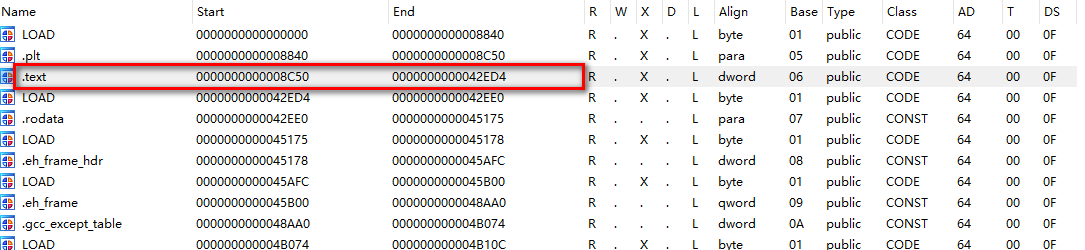
trace code: mainly in the original call_ native_ A monitoring callback for the execution of instructions within a certain range is added to the S () method. Here, we use the IDA shortcut "ctrl+s" to view the code segment of the target so, and take the start address (0x8C50) and end address (0x42ED4) of the whole code segment as the monitoring range. Remember to add so base address;
public String call_native_s(){
// Add an instruction set hook callback and output the offset address of the currently executed instruction in the so file
emulator.getBackend().hook_add_new(new CodeHook() {
@Override
public void onAttach(Unicorn.UnHook unHook) { }
@Override
public void detach() { }
@Override
public void hook(Backend backend, long address, int size, Object user) {
// Print the current instruction address. Note that you need to subtract the so base address from the actual address to get the offset of the code in the file
System.out.println(String.format("0x%x",address-module.base));
}
},module.base+0x8C50,module.base+0x42ED4,null); // Specify the monitoring start address and end address, and remember to add the so base address
// Parameters for constructing jni method
List<Object> arg_list = new ArrayList<>(10);
// Parameter 1: JNIEnv *env
arg_list.add(vm.getJNIEnv());
// Parameter 2: jobobject or jclass are generally not used. Just fill in 0
arg_list.add(0);
// Parameter 3: bytes
String input = "aid=01A1heTbypm4P4ovynAZcytJ3Af1fHFAV90gv3_mMmB6Ch9gQ.&cfrom=28B5295010&cuid=5226994080&filter_quick_replay=0&filter_rainbow=0&noncestr=H022wq318Kk508356jZXXl1317G8RS&platform=ANDROID×tamp=1626584839282&ua=LGE-Nexus5X__oasis__3.5.8__Android__Android8.1.0&version=3.5.8&vid=2003855943799&wm=20004_90024";
byte[] input_bytes = input.getBytes(StandardCharsets.UTF_8);
ByteArray input_byte_array = new ByteArray(vm,input_bytes);
arg_list.add(vm.addLocalObject(input_byte_array));
// Parameter 4: Boolean false fill in 0
arg_list.add(0);
// Call the target method when the parameter is ready
Number number = module.callFunction(emulator,0x116CC,arg_list.toArray())[0];
return vm.getObject(number.intValue()).getValue().toString();
}
Simulation execution results:
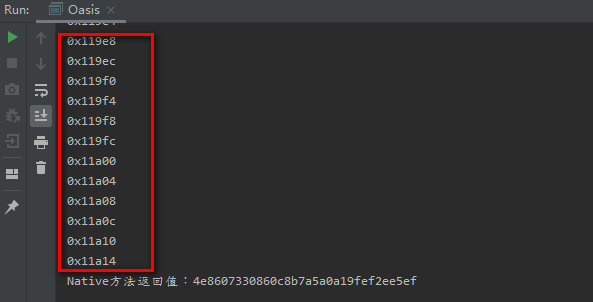
Then manually save these addresses as a unidbgtrace Log file.
2. Use IDAPython to mark the previously collected address in IDA;
After having the actual instruction addresses executed by the target method, use the IDAPython script to mark these addresses in IDA to represent valid instructions.
# -*- coding: utf-8 -*-
import sark
import sys

def do_ollvm_bcf():
    '''
    ollvm False control flow processing
    '''
    log_file = "unidbgTrace.log"
    trace_addrs = []
    # Read the address of the trace instruction into trace_addrs list
    with open(log_file, "r") as f:
        lines = f.readlines()
        for line in lines:
            trace_addrs.append(int(line.replace("\n", ""), 16))
    for addr in trace_addrs:
        line = sark.line.Line(addr)
        line.color = 0xEE82EE   # The executed instructions are marked by modifying the color.

if __name__ == "__main__":
    do_ollvm_bcf()
Ida loading IDA Python script: click file - > script file... In IDA toolbar, and then select the written Python script file in the pop-up file selection box to load.
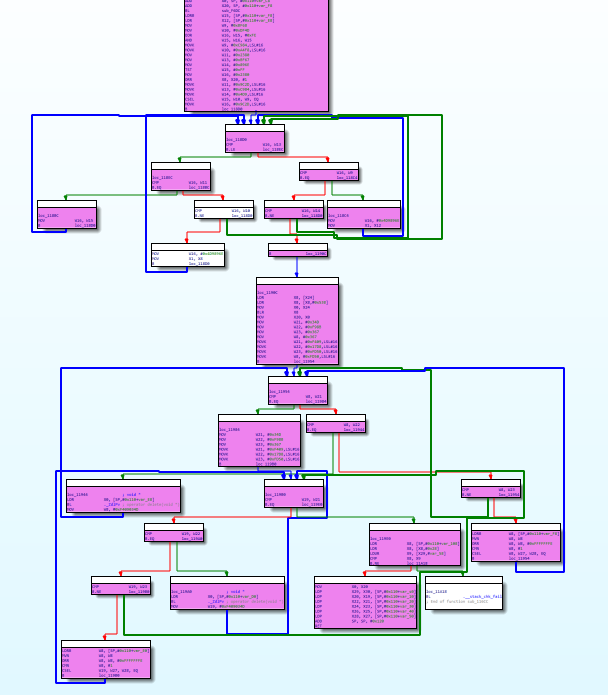
After execution, jump to the target address method 0x116CC. The effect is as follows:
The flow chart of the processed target method, in which the code marked in purple represents the code that is valid and will be executed;
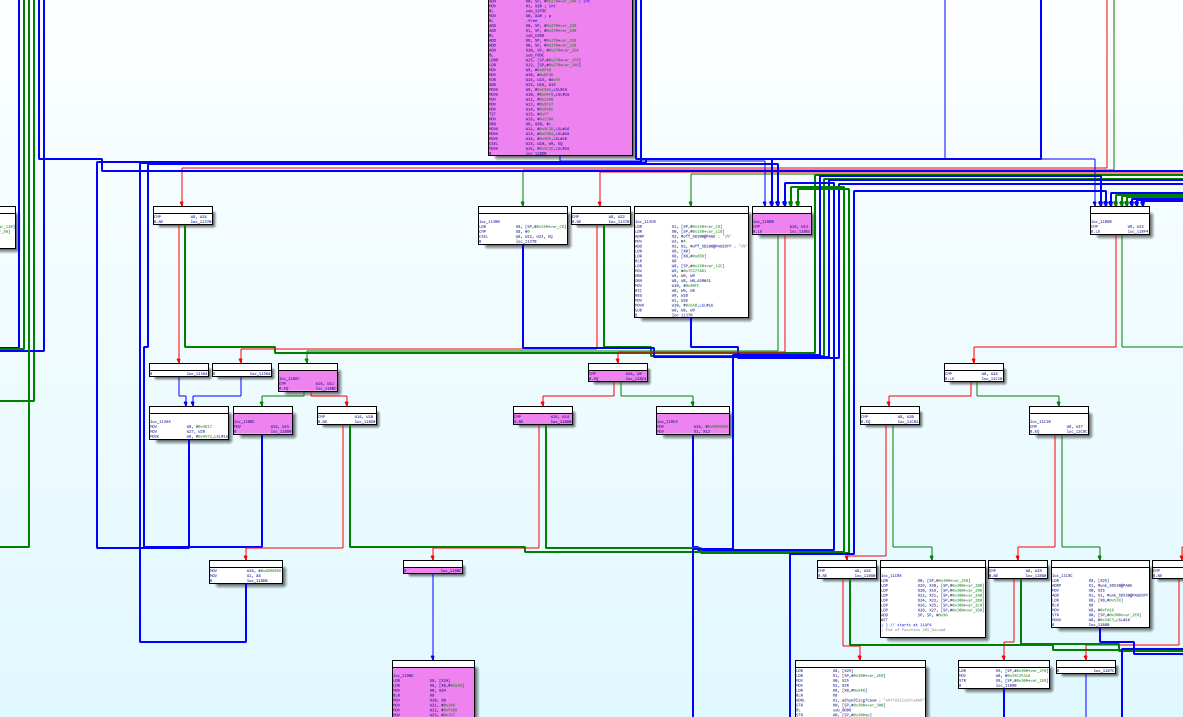
However, there is another problem. It can be seen from the above figure that the whole method still has many invalid code blocks, mainly because IDA parses the target method into JNI_ An analysis of the onload method, so the diagram seen here actually includes JNI_ The code of onload method and some other methods.
In this case, in JNI_ At the beginning of the onload method (0x10CEC), use the shortcut key "u" to cancel the definition of the whole method, and then jump to the beginning of the target method (0x116CC). Use the shortcut key "p" to parse the method from the current address. After processing, the effect is as follows:
Then you will find that there is no false control flow in this method-_-||
It's not a big problem. Anyway, it's learning. If a large number of false control flows are found sometimes, the instruction patch that will not be executed can also be nop according to the valid instructions. In this way, IDA will not parse the invalid instructions when decompiling the pseudo-C code, so as to reduce the interference of invalid instructions in pseudo-c.
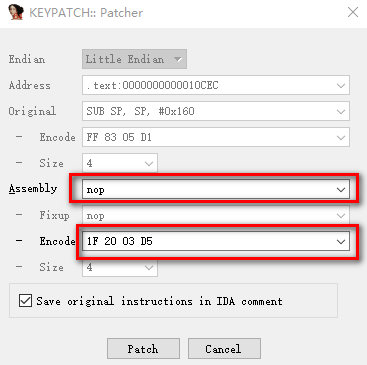
Use IDAPython to patch all unexecuted instructions in the method into nop instructions (0x1f, 0x20, 0x03, 0xd5);
How do I know the opcode of the nop instruction?
Use IDA plug-in patcher: on IDA toolbar, click Edit - > plugin - > keypatch Patcher
IDA shortcut:
- u: Cancel the definition of function, code and data
- p: Resolve to method from current address
The complete code is as follows:
# -*- coding: utf-8 -*-
import sark
import idc
import sys

def patch_nop(addr):
    '''
    Modify the byte of the specified address to nop
    '''
    nop_code = [0x1f, 0x20, 0x03, 0xd5]
    for i in range(len(nop_code)):
        idc.patch_byte(addr+i, nop_code[i])

def patch_code():
    # Set the start address and end address of the code to be processed, and obtain the addresses of all assembly instructions in the range
    s = 0x10CEC         # Destination method start address
    e = 0x10CEC+0xFEC   # Destination method end address
    funcLines = sark.lines(s, e)
    for line in funcLines:
        # Judge that if the color of this line of code is the color we marked, enter the patch logic and patch the code as a nop instruction.
        if line.type == "code":
            if line.color != 0xEE82EE:
                patch_nop(line.ea)

def do_ollvm_bcf():
    '''
    ollvm False control flow processing
    '''
    log_file = "unidbgTrace.log"
    trace_addrs = []
    # Read the address of the trace instruction into trace_addrs list
    with open(log_file, "r") as f:
        lines = f.readlines()
        for line in lines:
            trace_addrs.append(int(line.replace("\n", ""), 16))
    for addr in trace_addrs:
        line = sark.line.Line(addr)
        line.color = 0xEE82EE   # The executed instructions are marked by modifying the color.

if __name__ == "__main__":
    do_ollvm_bcf()
    # patch_code()
Although there are some control flow flattening problems after processing, this does not prevent us from fuck the fucking code.
F5 looks at the pseudo C code. Before analyzing, it first restores the entry parameters of the target method. The mouse selects the parameter 1, the IDA shortcut key "y" modifies the variable type, and the parameter 1 is restored to JNIEnv *a1, so the JNI method called in the method is automatically recognized.
__int64 __fastcall sub_116CC(JNIEnv *a1, __int64 a2, __int64 a3, char a4)
{
  // ...
  v35 = *(_QWORD *)(_ReadStatusReg(ARM64_SYSREG(3, 3, 13, 0, 2)) + 40);
  v6 = 0xFD500367;
  v7 = (*a1)->GetByteArrayElements(a1, a3, 0LL);
  v8 = (*a1)->GetArrayLength(a1, (jarray)a3);
  v9 = v8;
  v10 = v8 == -1;
  if ( v8 < -1 )
    v11 = -1LL;
  else
    v11 = v8 + 1;
  v12 = !v10;
  v13 = (char *)operator new[](v11);
  v14 = &v13[v9];
  memset(&v13[v9], 0, v12);
  v15 = v9;
  v16 = a1;
  memcpy(v13, v7, v15);
  *v14 = 0;
  (*a1)->ReleaseByteArrayElements(a1, (jbyteArray)a3, v7, 0LL);
  v17 = (const char **)&off_5D0A8;
  if ( a4 )
    v17 = (const char **)&off_5D0A0;
  v18 = *v17;
  v32[0] = 0LL;
  v32[1] = 0LL;
  v33 = 0LL;
  v19 = strlen(v18);
  sub_12C90((int)v32, (int)v18, v19);
  v20 = strlen(&byte_5D230);
  sub_12FDC((int)v32, (int)&byte_5D230, v20);
  v21 = strlen(v13);
  sub_12FDC((int)v32, (int)v13, v21);
  free(v13);
  sub_C688(v34, v32);
  sub_F6DC(v34);
  if ( ((v29 ^ 0xFE) & v29) != 0 )
    v23 = 0xC984BF68;
  else
    v23 = 0xA4F8DF4D;
  for ( i = 0x9C2D2380; ; i = 0x4D9896E ){
    while ( i <= (int)0xC984BF67 ){
      if ( i == 0x9C2D2380 ){
        i = v23;
      }else{
        i = 0x4D9896E;
        v22 = v30;
      }
    }
    if ( i != 0xC984BF68 )
      break;
    v22 = (char *)v31;
  }
  v25 = (__int64)(*v16)->NewStringUTF(v16, v22);
  v26 = 0xFD500367;
  while ( v26 != 0xF409034D ){
      // ...
  }
  while ( v6 != 0xF409034D ){
      // ...
  }
  return v25;
}
Check the general logic of the method. There are few codes. First, use V7 = (* A1) - > getbytearrayelements (A1, A3, 0ll); Method to get the string to be encrypted passed in from the Java layer, and then apply for a new memory to copy the string to be encrypted passed in from the Java layer.
Then, through the method sub_12C90(),sub_12FDC(), the two built-in strings ("YP1Vty&$Xm*kJkoR, Opk" and "") are spliced with the incoming encrypted strings of the Java layer, and the result is stored in the memory directed to variable v32(0x78b5752338). After that, free is called to release the previously requested memory.
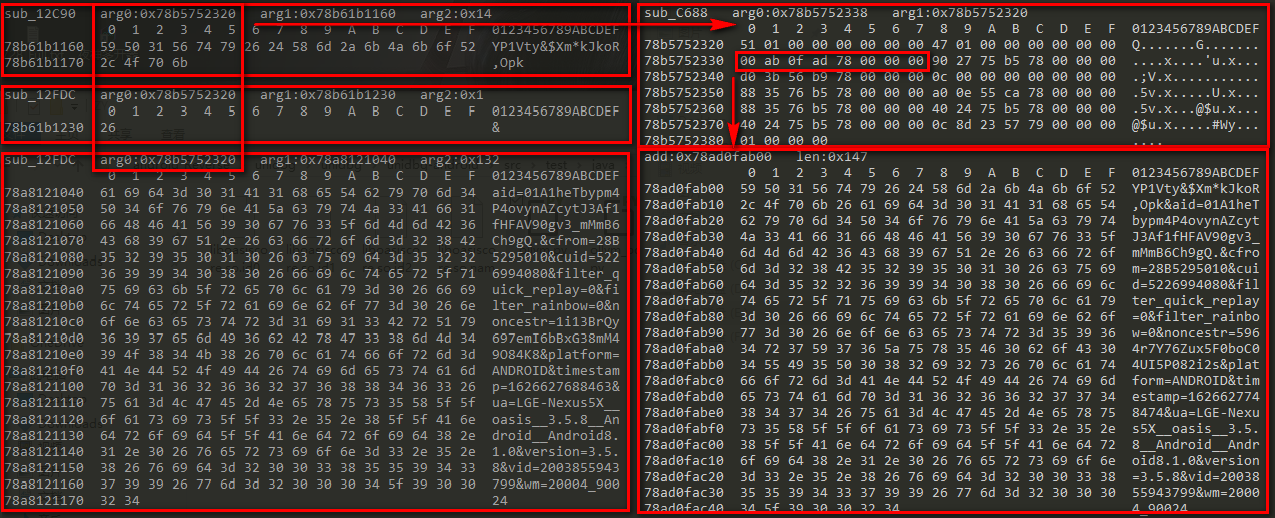
Method sub_C688,sub_F6DC mainly processes the spliced string, which should be the main encryption logic. However, after simple analysis, it is found that the two variables v34 and v32 related to these two methods are not referenced in the subsequent code, so it is impossible to further analyze. Therefore, in another direction, try to conduct reverse analysis according to the return value of the target method.
The idea is as follows:
- 1. Find the source of the return value
- 2. Monitor the change of return value source memory
Source of the return value of the target method: the return value is equal to v25. The data of v25 comes from "(* V16) - > newString UTF (V16, v22)", so the data comes from v22. There are two assignments in v22 in the code. According to the valid marks we typed, the actual source of v22 is v31. After arriving here, it is found that the data flow is broken again. Gan, look at the assembly directly.
Pseudo C code "v22 = (char *)v31;" corresponding assembly "MOV X1, X12", and then see that the source of X12 is equal to "LDR X12, [SP,#0x110+var_E8]".
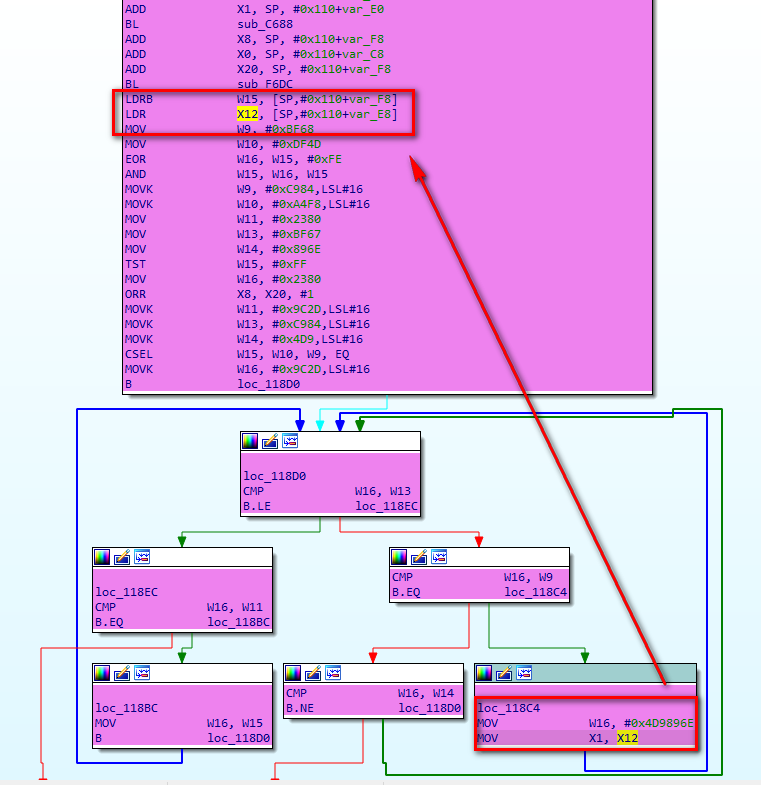 Now we have analyzed the data source of the whole return value. Let's use Frida's instruction level Hook to determine.
3.3.2. Instruction level Hook aided analysis
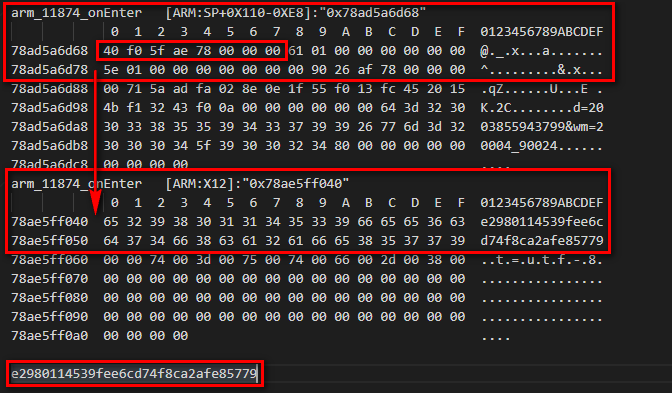
The address of "LDR X12, [SP,#0x110+var_E8]" instruction is 0x11870, but the address of the next instruction is 0x11874 when hook, so the value in X12 register is correct;
The code is as follows:
        // Instruction Hook
        let arm_11874 = targetSo.add(0x11874);
		Interceptor.attach(ptr(arm_11874),{
			onEnter:function () {
				// console.log(args[0]);
                var sp = new NativePointer(Number(this.context.sp) + Number(272 - 232));
                console.log("arm_11874_onLeave   [ARM:SP+0X110-0XE8]:"+JSON.stringify(sp));
                console.log(hexdump(sp,{length:100}));
                console.log("arm_11874_onLeave   [ARM:X12]:"+JSON.stringify(this.context.x12));
                var x12 = this.context.x12;
                console.log(hexdump(x12,{length:100}));
			},onLeave:function (retval){
                console.log("");
			}
		})
Get the values of "SP+0X110-0XE8" and X12 registers respectively;
Next, monitor the memory pointed to by "SP,#0x110+var_E8" to see where it was modified.
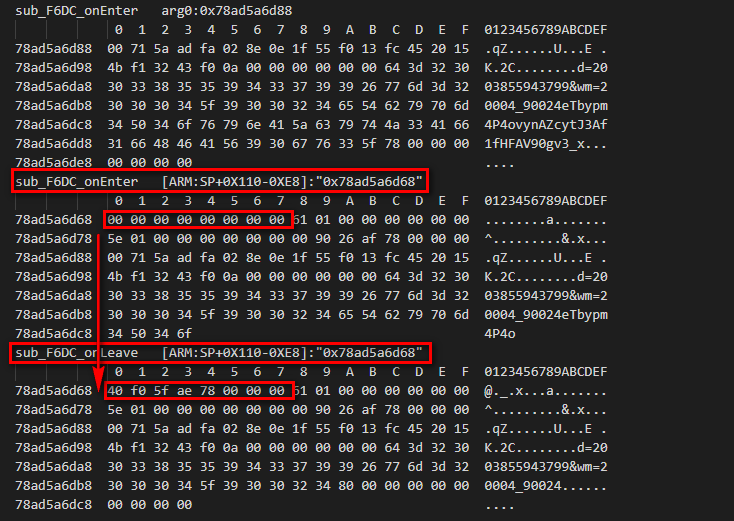
The target memory for debugging visible results is in sub_ The f6dc function is different before and after execution, so it should be modified here.
3.3.3. trace analysis of unidbg register
-----------------------All the above are wrong
The above methods are too troublesome, and there are simpler and more violent methods;
General idea: use the trace function to record all the changes of each assembly instruction and register value, and then analyze whether the value in the register has the key data of the standard algorithm.
As follows: here, the unidbg trace function is used to identify the Magic IV value of the standard MD5 algorithm. After locating these data, it is not far from the operation logic of the algorithm. This is actually a standard MD5 encryption.
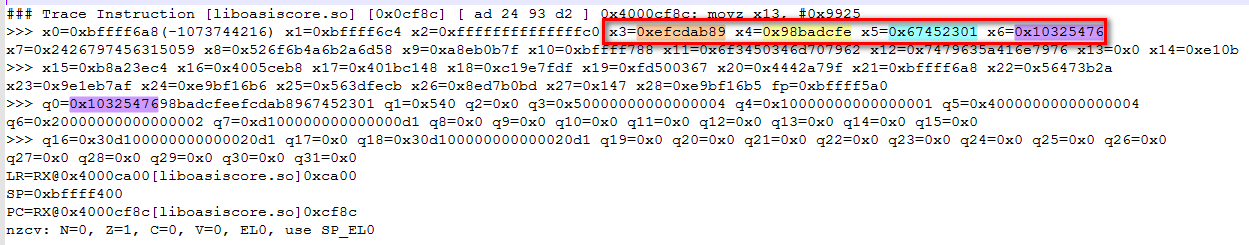
Or you can try the standard Hash algorithm one by one. ((:
A relatively complete encryption and decryption online tool CyberChef
4. Supplementary knowledge
4.1.JNIEnv,jobject,jclass
Generally, in JNI programming, the first parameter of the Native method generated by javah is always the JNIEnv pointer, and the second parameter is generally one of the jobobject or jclass.
4.1.2. What is the jnienv pointer?
JNIEnv, as the name suggests, refers to the Java Native Interface Environment. It is a JNI interface pointer that points to a function table of the local method. Each member in the function table points to a JNI function. The local method accesses the data structure in the JVM through the JNI function.
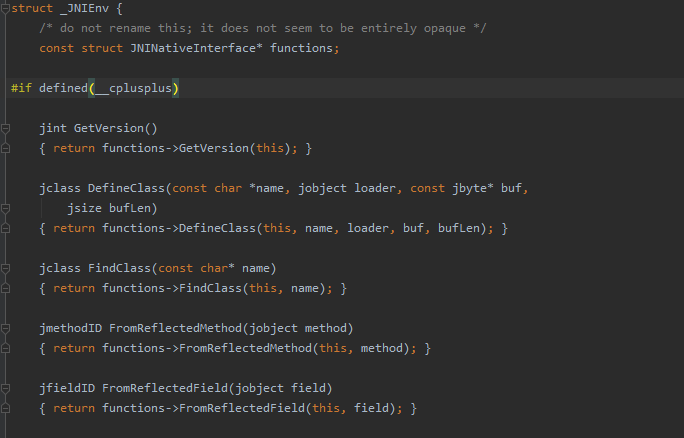
As you can see, JNIEnv contains many JNI function structures.
4.1.3. What's the difference between job and jclass?
Jobobject and jclass usually appear as the second parameter of JNI function. When the declared Native method is a static method, the corresponding parameter is jclass. Because the static method does not depend on the object instance, but on the class, a jclass class is passed in the parameter. Conversely, if the declared Native method is a non static method, the corresponding parameter is jobject. Therefore, in order to access classes and objects in java in the Native layer, jobject and jclass represent objects and classes respectively, and then access member methods and member variables.