This paper analyzes Android S(12)
When ANR occurs in app or watchdog is triggered by System, the System wants to generate a trace file to record the call stack information of each thread and the status information of some processes / threads. This file is usually stored in the / data/anr directory and is not available to app developers. However, starting from Android R(11), app can read the details of the file through the getHistoricalProcessExitReasons interface of AMS. The following is the content of a typical trace file.
----- pid 8331 at 2021-11-26 09:10:03 -----
Cmd line: com.hangl.test
Build fingerprint: xxx
ABI: 'arm64'
Build type: optimized
Zygote loaded classes=9118 post zygote classes=475
Dumping registered class loaders
#0 dalvik.system.PathClassLoader: [], parent #1
#1 java.lang.BootClassLoader: [], no parent
...
(Some states of the process as a whole, such as GC Statistics for)

suspend all histogram:	Sum: 161us 99% C.I. 2us-60us Avg: 16.100us Max: 60us
DALVIK THREADS (14):
"Signal Catcher" daemon prio=5 tid=7 Runnable
  | group="system" sCount=0 dsCount=0 flags=0 obj=0x14dc0298 self=0x7c4c962c00
  ...

"main" prio=5 tid=1 Native
  | group="main" sCount=1 dsCount=0 flags=1 obj=0x7263ee78 self=0x7c4c7dcc00
  | sysTid=8331 nice=-10 cgrp=default sched=0/0 handle=0x7c4dd45ed0
  | state=S schedstat=( 387029514 32429484 166 ) utm=28 stm=10 core=6 HZ=100
  | stack=0x7feacb5000-0x7feacb7000 stackSize=8192KB
  | held mutexes=
  native: #00 pc 00000000000d0f48  /apex/com.android.runtime/lib64/bionic/libc.so (__epoll_pwait+8)
  native: #01 pc 00000000000180bc  /system/lib64/libutils.so (android::Looper::pollInner(int)+144)
  native: #02 pc 0000000000017f8c  /system/lib64/libutils.so (android::Looper::pollOnce(int, int*, int*, void**)+56)
  native: #03 pc 000000000013b920  /system/lib64/libandroid_runtime.so (android::android_os_MessageQueue_nativePollOnce(_JNIEnv*, _jobject*, long, int)+44)
  at android.os.MessageQueue.nativePollOnce(Native method)
  at android.os.MessageQueue.next(MessageQueue.java:336)
  at android.os.Looper.loop(Looper.java:174)
  at android.app.ActivityThread.main(ActivityThread.java:7397)
  at java.lang.reflect.Method.invoke(Native method)
  at com.android.internal.os.RuntimeInit$MethodAndArgsCaller.run(RuntimeInit.java:492)
  at com.android.internal.os.ZygoteInit.main(ZygoteInit.java:935)

"Jit thread pool worker thread 0" daemon prio=5 tid=2 Native
  | group="main" sCount=1 dsCount=0 flags=1 obj=0x14dc0220 self=0x7bb9a05000
  ...
This article is not intended to discuss the trigger types of ANR, nor to show the generation order of each piece of content in a running account, because many articles have been written, and there are many fine works among them. In view of this, this paper will focus on the generation process of call stack, which will help us better understand trace information.
preface
No matter ANR or Watchdog, the generation process of trace is carried out in target process. Taking ANR as an example, its decision process takes place in system_server(AMS), while the generation process of trace takes place in APP. So how to make APP start this process? The answer is to send it sigquit (signal 3). This is because the ptrace scheme is usually used for cross process information collection, which requires the collector to either have special permissions or meet the parent-child relationship between processes, which is not convenient for in-process collection.
Therefore, the first step of the analysis is to check the processing mode of signal 3 in the process.
1. Signal Catcher thread
The "Signal Catcher" thread exists in every Java process. During normal operation, it will suspend waiting for the arrival of signal 3 (and signal 10). When the process receives signal 3, it will be handled by the "Signal Catcher" thread, and the processing function is HandleSigQuit.
void SignalCatcher::HandleSigQuit() {
  Runtime* runtime = Runtime::Current();
  std::ostringstream os;
  os << "\n"
      << "----- pid " << getpid() << " at " << GetIsoDate() << " -----\n";

  DumpCmdLine(os);

  // Note: The strings "Build fingerprint:" and "ABI:" are chosen to match the format used by
  // debuggerd. This allows, for example, the stack tool to work.
  std::string fingerprint = runtime->GetFingerprint();
  os << "Build fingerprint: '" << (fingerprint.empty() ? "unknown" : fingerprint) << "'\n";
  os << "ABI: '" << GetInstructionSetString(runtime->GetInstructionSet()) << "'\n";

  os << "Build type: " << (kIsDebugBuild ? "debug" : "optimized") << "\n";

  runtime->DumpForSigQuit(os);

  if ((false)) {
    std::string maps;
    if (android::base::ReadFileToString("/proc/self/maps", &maps)) {
      os << "/proc/self/maps:\n" << maps;
    }
  }
  os << "----- end " << getpid() << " -----\n";
  Output(os.str());
}
The jump process in the middle will not be shown, but directly enter the topic we care about: the collection process of call stack. Through the ThreadList::Dump function, we can collect the call stack information of all threads.
void ThreadList::Dump(std::ostream& os, bool dump_native_stack) {
  Thread* self = Thread::Current();
  {
    MutexLock mu(self, *Locks::thread_list_lock_);
    os << "DALVIK THREADS (" << list_.size() << "):\n";
  }
  if (self != nullptr) {
    DumpCheckpoint checkpoint(&os, dump_native_stack);
    size_t threads_running_checkpoint;
    {
      // Use SOA to prevent deadlocks if multiple threads are calling Dump() at the same time.
      ScopedObjectAccess soa(self);
      threads_running_checkpoint = RunCheckpoint(&checkpoint);
    }
    if (threads_running_checkpoint != 0) {
      checkpoint.WaitForThreadsToRunThroughCheckpoint(threads_running_checkpoint);
    }
  } else {
    DumpUnattachedThreads(os, dump_native_stack);
  }
}
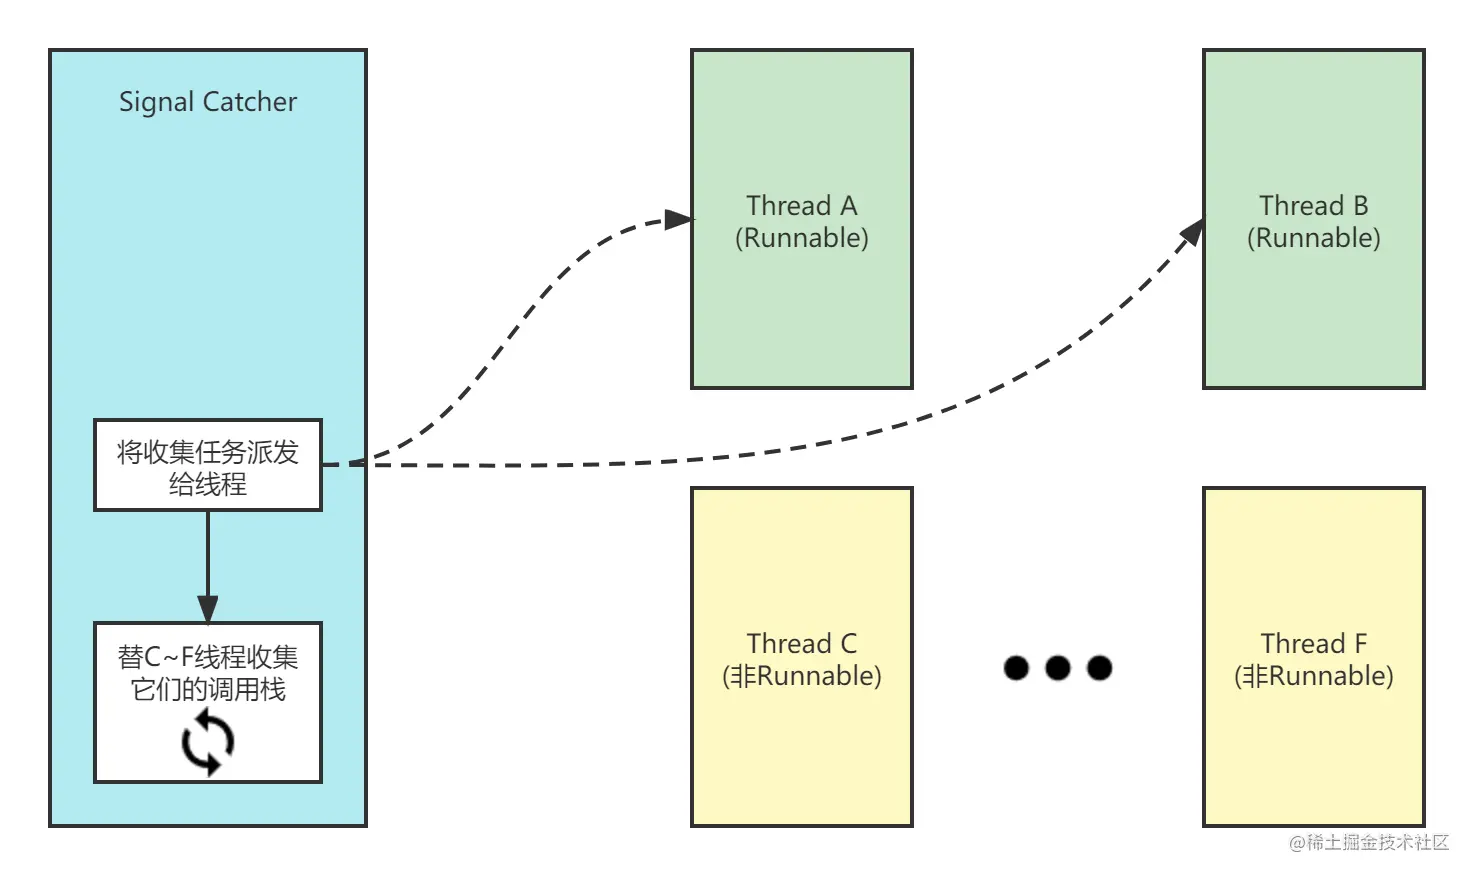
The key step is to execute the RunCheckpoint function. It divides the information collection of each thread into separate tasks: * * if the thread is in Runnable state (running java code), it will send the collected tasks to the thread for processing; if the thread is in other states, it will be completed by the "Signal Catcher" thread. * * Please remember this sentence, because the two different situations are analyzed in sections 2 and 3 below.
2. Checkpoint mechanism
The thread that sends the task to the Runnable state adopts the checkpoint mechanism, which is divided into two parts:
- The "Signal Catcher" thread calls RequestCheckpoint to change the internal data of the art::Thread object of the target thread. Specifically, the following two fields are changed.
   tls32_.state_and_flags.as_struct.flags |= kCheckpointRequest;
   tlsPtr_.checkpoint_function = function;
   (tls32_and tlsPtr_Both art::Thread Object's internal data)
- For ART virtual machine, the target thread will check the state at the beginning of each method and the jump position of the loop statement_ and_ Flags field. If the checkpoint bit is set, the corresponding checkpoint function will be executed. In this way, the placement of checkpoints can ensure that the thread can "handle the checkpoint task in time": because all forward executed (linear and conditional branches are counted) codes will be executed in a limited time, and the codes that may be executed for a long time are either loops or method calls. Therefore, the timeliness can be guaranteed as long as checkpoints are inserted in these two places. (refer to R Da Zhihu) answer)
As for the checkpoint of the target thread, I also want to give an example to let you really feel its existence.
Bytecode can be interpreted and executed in ART virtual machine or compiled into machine code for execution. After a method is compiled into machine code (as shown below), we can see the operation of detecting state_and_flags at the entrance of the function. When a flag bit is set, execute the pTestSuspend action.
CODE: (code_offset=0x003f9ae0 size=788)...
  0x003f9ae0: d1400bf0	sub x16, sp, #0x2000 (8192)
  0x003f9ae4: b940021f	ldr wzr, [x16]
    StackMap[0] (native_pc=0x3f9ae8, dex_pc=0x0, register_mask=0x0, stack_mask=0b)
  0x003f9ae8: f8180fe0	str x0, [sp, #-128]!
  0x003f9aec: a9035bf5	stp x21, x22, [sp, #48]
  0x003f9af0: a90463f7	stp x23, x24, [sp, #64]
  0x003f9af4: a9056bf9	stp x25, x26, [sp, #80]
  0x003f9af8: a90673fb	stp x27, x28, [sp, #96]
  0x003f9afc: a9077bfd	stp x29, lr, [sp, #112]
  0x003f9b00: b9008fe2	str w2, [sp, #140]
  0x003f9b04: 79400270	ldrh w16, [tr] ; state_and_flags
  0x003f9b08: 350016f0	cbnz w16, #+0x2dc (addr 0x3f9de4) / / if state_ and_ If flags is not 0, jump to 0x3f9de4
  ...
  0x003f9de4: 940e62c3	bl #+0x398b0c (addr 0x7928f0) ; pTestSuspend / / jump to pTestSuspend
After several jumps, pTestSuspend will eventually call the Thread::CheckSuspend function. When the checkpoint bit is set, the corresponding checkpoint function (runcheckpoint function) is executed.
inline void Thread::CheckSuspend() {
  DCHECK_EQ(Thread::Current(), this);
  for (;;) {
    if (ReadFlag(kCheckpointRequest)) {
      RunCheckpointFunction();
    } else if (ReadFlag(kSuspendRequest)) {
      FullSuspendCheck();
    } else if (ReadFlag(kEmptyCheckpointRequest)) {
      RunEmptyCheckpoint();
    } else {
      break;
    }
  }
}
The following is an example of the Runnable thread collecting the call stack itself. Line 2292 is just the first line of the writeNoException method, which is consistent with the above description of "inserting checkpoints at the beginning of each method".
"Binder:2278_C" prio=5 tid=97 Runnable
  | group="main" sCount=0 ucsCount=0 flags=0 obj=0x16104b20 self=0xb400007117c7afb0
  | sysTid=2890 nice=0 cgrp=foreground sched=0/0 handle=0x6eafe24cb0
  | state=R schedstat=( 47445156223 266433061959 175792 ) utm=1623 stm=3121 core=4 HZ=100
  | stack=0x6eafd2d000-0x6eafd2f000 stackSize=991KB
  | held mutexes= "mutator lock"(shared held)
  at android.os.Parcel.writeNoException(Parcel.java:2292)
  at android.os.IPowerManager$Stub.onTransact(IPowerManager.java:474)
  at android.os.Binder.execTransactInternal(Binder.java:1184)
  at android.os.Binder.execTransact(Binder.java:1143)
2291     public final void writeNoException() {
2292         AppOpsManager.prefixParcelWithAppOpsIfNeeded(this);
3. Suspend flag bit
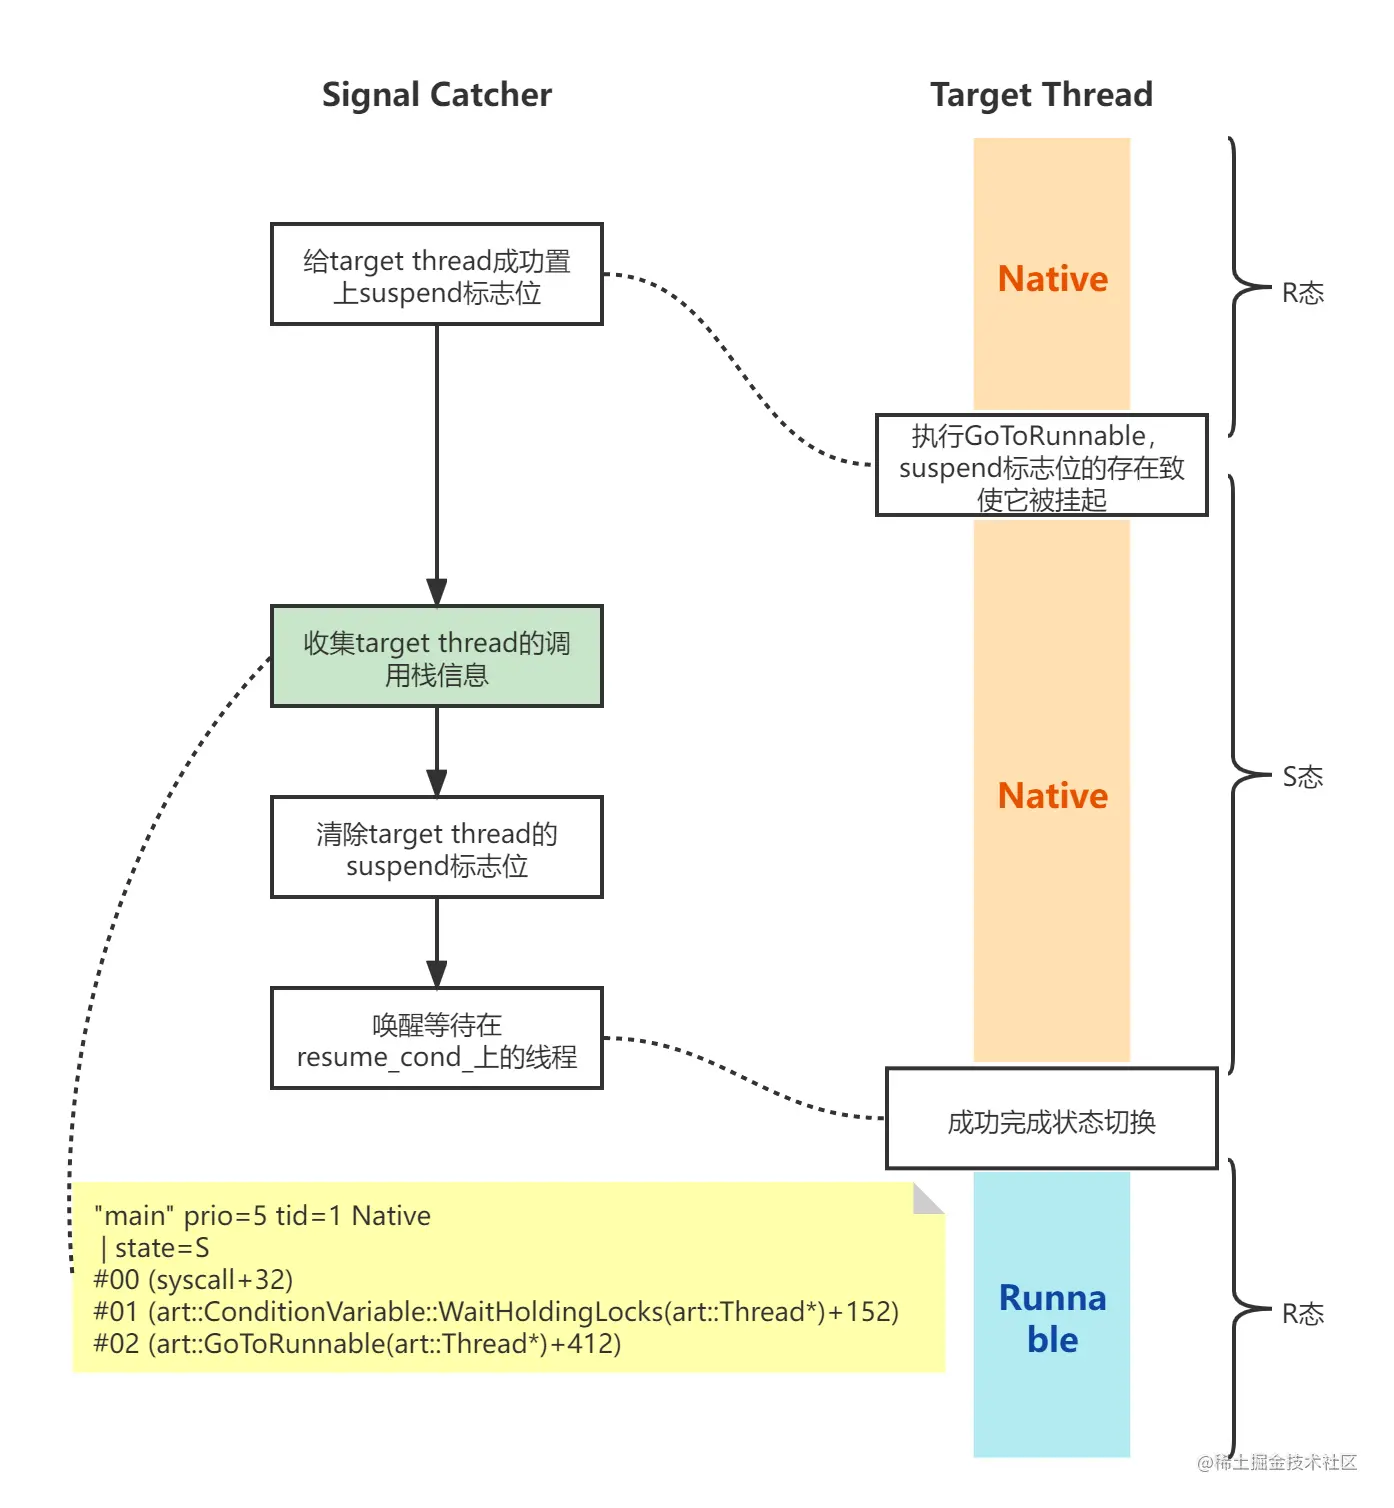
For those threads in non Runnable state, the collection work is completed by "Signal Catcher". Here I combed the "OEM" process for a single thread, which is divided into four steps.
thread->ModifySuspendCount(self, +1, nullptr, SuspendReason::kInternal);
checkpoint_function->Run(thread);
thread->ModifySuspendCount(self, -1, nullptr, SuspendReason::kInternal);
Thread::resume_cond_->Broadcast(self);
- Increase the suspend count(+1) of target thread and set the suspend flag bit.
- Run the corresponding function to collect information for target thread.
- Reduce the suspend count(-1) of target thread. If the suspend count is reduced to 0, clear the suspend flag bit.
- Call resume_cond_ Broadcast function of condition variable, which will wake up all threads waiting on it.
The process is always simple. The difficulty is to understand the reasons behind the process design. Let's analyze it in detail.
-
Why is it necessary to set the suspend flag on the target thread before performing information collection?
Before answering this question, we need to add some basic knowledge. Each java thread is essentially a pthread thread, and it corresponds to a task in the kernel_ Struct object, which is the basic unit of CPU scheduling. From the perspective of CPU, the thread can be R-state, S-state, D-state, etc. their meanings are as follows. However, another set of state is recorded for Java threads in the virtual machine, which reflects the state from the perspective of the virtual machine. The specific classification is as follows.
    R  running or runnable (on run queue)
    D  uninterruptible sleep (usually IO)
    S  interruptible sleep (waiting for an event to complete)
```
enum ThreadState {
  //                                   Java
  //                                   Thread.State   JDWP state
  kTerminated = 66,                 // TERMINATED     TS_ZOMBIE    Thread.run has returned, but Thread* still around
  kRunnable,                        // RUNNABLE       TS_RUNNING   runnable
  kTimedWaiting,                    // TIMED_WAITING  TS_WAIT      in Object.wait() with a timeout
  kSleeping,                        // TIMED_WAITING  TS_SLEEPING  in Thread.sleep()
  kBlocked,                         // BLOCKED        TS_MONITOR   blocked on a monitor
  kWaiting,                         // WAITING        TS_WAIT      in Object.wait()
  kWaitingForLockInflation,         // WAITING        TS_WAIT      blocked inflating a thin-lock
  kWaitingForTaskProcessor,         // WAITING        TS_WAIT      blocked waiting for taskProcessor
  kWaitingForGcToComplete,          // WAITING        TS_WAIT      blocked waiting for GC
  kWaitingForCheckPointsToRun,      // WAITING        TS_WAIT      GC waiting for checkpoints to run
  kWaitingPerformingGc,             // WAITING        TS_WAIT      performing GC
  kWaitingForDebuggerSend,          // WAITING        TS_WAIT      blocked waiting for events to be sent
  kWaitingForDebuggerToAttach,      // WAITING        TS_WAIT      blocked waiting for debugger to attach
  kWaitingInMainDebuggerLoop,       // WAITING        TS_WAIT      blocking/reading/processing debugger events
  kWaitingForDebuggerSuspension,    // WAITING        TS_WAIT      waiting for debugger suspend all
  kWaitingForJniOnLoad,             // WAITING        TS_WAIT      waiting for execution of dlopen and JNI on load code
  kWaitingForSignalCatcherOutput,   // WAITING        TS_WAIT      waiting for signal catcher IO to complete
  kWaitingInMainSignalCatcherLoop,  // WAITING        TS_WAIT      blocking/reading/processing signals
  kWaitingForDeoptimization,        // WAITING        TS_WAIT      waiting for deoptimization suspend all
  kWaitingForMethodTracingStart,    // WAITING        TS_WAIT      waiting for method tracing to start
  kWaitingForVisitObjects,          // WAITING        TS_WAIT      waiting for visiting objects
  kWaitingForGetObjectsAllocated,   // WAITING        TS_WAIT      waiting for getting the number of allocated objects
  kWaitingWeakGcRootRead,           // WAITING        TS_WAIT      waiting on the GC to read a weak root
  kWaitingForGcThreadFlip,          // WAITING        TS_WAIT      waiting on the GC thread flip (CC collector) to finish
  kNativeForAbort,                  // WAITING        TS_WAIT      checking other threads are not run on abort.
  kStarting,                        // NEW            TS_WAIT      native thread started, not yet ready to run managed code
  kNative,                          // RUNNABLE       TS_RUNNING   running in a JNI native method
  kSuspended,                       // RUNNABLE       TS_RUNNING   suspended by GC or debugger
};

```
A thread in R state indicates that it is logically running (due to scheduling, it may not be executed temporarily, but it will always be executed [within a certain period of time]), and its running code may be located in the kernel layer, native layer or java layer. The state recorded in the virtual machine is Runnable only when it is running in the java layer.
If the target thread is in a non Runnable state, it means that it is not in the java layer. But not being in the java layer doesn't mean it doesn't work. During the process of collecting target threads by the "Signal Catcher" agent, the target thread may return to the java layer at any time (ending the work of the native layer or initiating the call to java methods). Once the java layer is returned, the call stack shape of the java layer will be changed. In this way, there will be competition between "Signal Catcher" and target thread for the overall shape of the call stack.
Therefore, we need a solution to solve this competition.
All operations returning to the java layer require thread state switching, that is, call the transitionfromsuspended torunnable function. The function will internally determine the suspend flag bit. Once it is set, the target thread will wait for resume_cond_ On condition variables. Therefore, setting the suspend flag can ensure that the target thread cannot return to the java layer, that is, the call stack shape of the java layer cannot be changed. (it is worth noting that some comments on the internet think that setting the suspend flag is to pause the thread, which is actually a loose understanding. For threads that do not want to return to the java layer, setting the suspend flag does not affect its operation.)
- What is the need to call resume_ after the end of information collection? cond_ Broadcast function of conditional variable?
Because some threads ready to return to the java layer are waiting for resume at this time_ cond_ On condition variables (in S state), it is necessary to wake them up and let them continue to work after the collection operation.
- After analyzing so much, let's take a practical case. From native's #2, we can know that the main thread has finished the work of the native layer and wants to return to the java layer. However, we can't find the transition from suspended torunnable from the stack because it is inline into the GoToRunnable function. And #1 WaitingHoldingLocks is waiting for resume_cond_ Condition variable.
    "main" prio=5 tid=1 Native
      | group="main" sCount=1 ucsCount=0 flags=1 obj=0x71a33c18 self=0xb400006f417a1380
      | sysTid=14756 nice=-10 cgrp=top-app sched=0/0 handle=0x71027344f8
      | state=S schedstat=( 603683604122 79803215759 1916541 ) utm=43513 stm=16854 core=6 HZ=100
      | stack=0x7fe8361000-0x7fe8363000 stackSize=8188KB
      | held mutexes=
      native: #00 pc 000000000004dff0  /apex/com.android.runtime/lib64/bionic/libc.so (syscall+32)
      native: #01 pc 000000000028dc74  /apex/com.android.art/lib64/libart.so (art::ConditionVariable::WaitHoldingLocks(art::Thread*)+152)
      native: #02 pc 000000000074c4ec  /apex/com.android.art/lib64/libart.so (art::GoToRunnable(art::Thread*)+412)
      native: #03 pc 000000000074c318  /apex/com.android.art/lib64/libart.so (art::JniMethodEnd(unsigned int, art::Thread*)+28)
      at android.os.BinderProxy.transactNative(Native method)
      at android.os.BinderProxy.transact(BinderProxy.java:571)
      at com.android.internal.telephony.ISub$Stub$Proxy.getAvailableSubscriptionInfoList(ISub.java:1543)
      at android.telephony.SubscriptionManager.getAvailableSubscriptionInfoList(SubscriptionManager.java:1640)
However, it should be noted that this trace will only be generated under the following timing conditions. If the function running in the native layer does not end, there is no need to return to the java layer and GoToRunnable will not be called.
Therefore, when we see the call stack of the main thread when anr occurs, as shown above, don't think GoToRunnable is the culprit of ANR. It only indicates that the thread wants to return to the java layer during execution, and the real cause of anr may be the overall time-consuming of a message.
4. Java call stack collection
(this section is rough and can be skipped if you are not interested)
By calling the StackDumpVisitor::WalkStack function, we can collect the call stack information of the java layer. The interior of this function is relatively complex. If you want a complete understanding, you need to supplement a series of knowledge such as ArtMethod and DexFile. This article is not intended to be a complete introduction, but a general summary.
Each instruction of the machine code has a number, which is represented as a PC value at run time. Similarly, each instruction of the DEX bytecode has a number, which is represented as Dex in the DEX file_ PC (the dex_pc of each method is numbered from 0). For example, 0x0003 and 0x0008 in the following file are dex_pc.
DEX CODE:
  0x0000: 7010 5350 0100           	| invoke-direct {v1}, void android.media.IPlayer$Stub.<init>() // method@20563
  0x0003: 2200 791f                	| new-instance v0, java.lang.ref.WeakReference // type@TypeIndex[8057]
  0x0005: 7020 84fa 2000           	| invoke-direct {v0, v2}, void java.lang.ref.WeakReference.<init>(java.lang.Object) // method@64132
  0x0008: 5b10 582e                	| iput-object v0, v1, Ljava/lang/ref/WeakReference; android.media.PlayerBase$IPlayerWrapper.mWeakPB // field@11864
  0x000a: 0e00                     	| return-void
Bytecode may be interpreted and executed during actual operation, It may also be compiled into machine code execution (AOT or JIT), and the call stack backtracking methods of these two execution methods are different. The reason is that when machine code is executed, java methods behave like pure native methods in the stack frame structure (the new interpreter nterp is introduced in S, and its stack frame structure is consistent with the machine code execution, so its performance is better than the previous mterp); while the interpretation execution (here refers to the mterp interpreter) will have a special data structure to record the dex_pc value.
When we want to trace back a frame of java call stack information, we actually want to get three information: method name, file name and line number (as for lock information, it does not exist in every frame, so it belongs to another topic, which will not be described here).
at android.os.Looper.loop(Looper.java:174)
To get these three information, there are actually three dependent data: ArtMethod object, DexFile information and dex_pc value. Since the DexFile information can be obtained indirectly through ArtMethod, our main purpose in the backtracking process is to find its ArtMehtod object and DEX for each frame_ PC value.
This search is very simple for interpretation and execution, because interpretation and execution will have a special data structure to record it. This specific data structure is ShadowFrame.
But for machine code execution, the problem becomes much more complicated. Fortunately, the machine code execution of each frame follows a law: the ArtMethod pointer of the current execution method is stored at the top of the stack. Therefore, when a series of method calls occur, we can parse all the information only by the sp value of the last frame. The principle is as follows:
- Through the sp value, we can dereference twice to obtain the ArtMethod object of the currently running method.
- Further obtain FrameInfo through ArtMethod, where you can know the frame size.
- sp+frame size can know the sp value of the previous frame.
- The value of the return address can also be obtained from the sp of the previous frame, which is usually stored in the x30 register. When the method is called, it will be pushed into the fixed offset position in the stack.
Therefore, we can obtain the ArtMethod object and PC value of each frame (the top frame is either the native method or the runtime method, and there is no need to recover the line number). Through the following methods, we can further obtain the dex_pc value, so that the details of each frame can be parsed.
uint32_t StackVisitor::GetDexPc(bool abort_on_failure) const {
  if (cur_shadow_frame_ != nullptr) {
    return cur_shadow_frame_->GetDexPC();
  } else if (cur_quick_frame_ != nullptr) {
    if (IsInInlinedFrame()) {
      return current_inline_frames_.back().GetDexPc();
    } else if (cur_oat_quick_method_header_ == nullptr) {
      return dex::kDexNoIndex;
    } else if ((*GetCurrentQuickFrame())->IsNative()) {
      return cur_oat_quick_method_header_->ToDexPc(
          GetCurrentQuickFrame(), cur_quick_frame_pc_, abort_on_failure);
    } else if (cur_oat_quick_method_header_->IsOptimized()) {
      StackMap* stack_map = GetCurrentStackMap();
      DCHECK(stack_map->IsValid());
      return stack_map->GetDexPc();
    } else {
      DCHECK(cur_oat_quick_method_header_->IsNterpMethodHeader());
      return NterpGetDexPC(cur_quick_frame_);
    }
  } else {
    return 0;
  }
}
However, we also omit one case in the above description, that is, the case of java inline, which is also time-consuming in the process of unwind.
5. Native call stack collection
In the normal trace generation process, whether the native call stack of a thread is collected depends on the judgment of the following functions. The following sequence number indicates the judgment priority.
static bool ShouldShowNativeStack(const Thread* thread)
    REQUIRES_SHARED(Locks::mutator_lock_) {
  ThreadState state = thread->GetState();

  // In native code somewhere in the VM (one of the kWaitingFor* states)? That's interesting.
  if (state > kWaiting && state < kStarting) {
    return true;
  }

  // In an Object.wait variant or Thread.sleep? That's not interesting.
  if (state == kTimedWaiting || state == kSleeping || state == kWaiting) {
    return false;
  }

  // Threads with no managed stack frames should be shown.
  if (!thread->HasManagedStack()) {
    return true;
  }

  // In some other native method? That's interesting.
  // We don't just check kNative because native methods will be in state kSuspended if they're
  // calling back into the VM, or kBlocked if they're blocked on a monitor, or one of the
  // thread-startup states if it's early enough in their life cycle (http://b/7432159).
  ArtMethod* current_method = thread->GetCurrentMethod(nullptr);
  return current_method != nullptr && current_method->IsNative();
}
-
When state is a virtual machine related state, you need to collect the native call stack. What is the virtual machine related state? For example, kWaitingForGcToComplete indicates that the current thread is waiting for the GC to end. Therefore, we can understand that these states affect the running state of this thread because the virtual machine itself works.
-
If the state is a Waiting or Sleeping related state, the collection of the native call stack is omitted. Because the call stack of the native layer of the thread in this state must eventually be futex system calls, outputting these call stacks will not bring valuable information to debugging, so they can be omitted.
-
If the thread has no java layer call stack information, it needs to collect the native call stack, otherwise there is no information to output.
-
If the last frame of the java layer call stack is the native method, you need to collect the native call stack to understand the specific actions of the native layer.
Next, we will discuss how to collect the native call stack. The professional term of this process is called backtracking or unwind. In Android, it is mainly completed through the library libunwindstack.
Collecting the native call stack is essentially looking for the pc value of each frame. When we get the sp value of the last frame, we can constantly trace back the pc value of each frame by looking for the return address.
Therefore, the following questions can be simplified to two:
- How to find the register (sp/pc) value of the last frame?
- How to find the return address of each frame?
5.1 how to find the register value of the last frame
Register information is thread related in nature, so it is divided into two cases.
- This thread collects the call stack of this thread.
- The "Signal Catcher" thread collects the call stack of other threads.
This thread is relatively simple to obtain the register value. It only needs some basic assembly instructions. For example, the following code can store the values of 32 general registers in a user space specific data structure.
inline __attribute__((__always_inline__)) void AsmGetRegs(void* reg_data) {
  asm volatile(
      "1:\n"
      "stp x0, x1, [%[base], #0]\n"
      "stp x2, x3, [%[base], #16]\n"
      "stp x4, x5, [%[base], #32]\n"
      "stp x6, x7, [%[base], #48]\n"
      "stp x8, x9, [%[base], #64]\n"
      "stp x10, x11, [%[base], #80]\n"
      "stp x12, x13, [%[base], #96]\n"
      "stp x14, x15, [%[base], #112]\n"
      "stp x16, x17, [%[base], #128]\n"
      "stp x18, x19, [%[base], #144]\n"
      "stp x20, x21, [%[base], #160]\n"
      "stp x22, x23, [%[base], #176]\n"
      "stp x24, x25, [%[base], #192]\n"
      "stp x26, x27, [%[base], #208]\n"
      "stp x28, x29, [%[base], #224]\n"
      "str x30, [%[base], #240]\n"
      "mov x12, sp\n"
      "adr x13, 1b\n"
      "stp x12, x13, [%[base], #248]\n"
      : [base] "+r"(reg_data)
      :
      : "x12", "x13", "memory");
}
But if it is obtained across threads (not across processes), how to deal with it?
The answer is through the signal. When the target thread is running in user space, the register value will not be backed up. Only when it switches between user state and kernel state will the information be backed up. In addition, the switching process will also detect the signal and trigger the signal processing function. Therefore, the register information just backed up can be further passed to the processing function. And that's where we get the register value across threads.
Android uses signal 33(THREAD_SIGNAL) to complete this work. Its processing function is also relatively simple, that is, copy the register information in sigcontext to the global data, so that other threads can obtain it.
5.2 how to find the return address of each frame
When a function call occurs, the return address usually exists in the x30 register (AArch64). If the callee needs to use this register internally, its starting fragment must store the value of x30 on the stack, otherwise the return address will be lost. But where does the value of x30 exist in the stack?
When the - fomit frame pointer compilation option is turned on, the location of x30 storage is adjacent to x29(FP register), so it is easy to find. However, without this compilation option, the value of x30 depends on more information. In the 64 bit library, this information is called "Call Frame Information", which is stored in the middle of the elf file eh_frame segment. Of wechat technology team An article The description of this point is relatively clear, and the quotation is as follows:
When your code is executed to a "line", according to the pc at this time, we can query from "Call Frame Information" how to recover each register when exiting the current function stack. For example, it may describe where the value of the register should be read back from the current stack.
In addition to unwind pure native frames, the libunwindstack library also supports AOT/JIT frames and interpreted execution frames. This also shows that the call stack collected through libunwindstack can reflect not only the call information of the native layer, but also the call information of the java layer, as shown in the following example.
#00 pc 000aa0f8  /system/lib/libart.so (void std::__1::__tree_balance_after_insert<std::__1::__tree_node_base<void*>*>(std::__1::__tree_node_base<void*>*, std::__1::__tree_balance_after_insert<std::__1::__tree_node_base<void*>*>)+32)
#01 pc 001a0a35  /system/lib/libart.so (art::gc::space::LargeObjectMapSpace::Alloc(art::Thread*, unsigned int, unsigned int*, unsigned int*, unsigned int*)+180)
#02 pc 003cd4f5  /system/lib/libart.so (art::mirror::Object* art::gc::Heap::AllocLargeObject<false, art::mirror::SetLengthVisitor>(art::Thread*, art::ObjPtr<art::mirror::Class>*, unsigned int, art::mirror::SetLengthVisitor const&)+108)
#03 pc 003cb659  /system/lib/libart.so (artAllocArrayFromCodeResolvedRegionTLAB+484)
#04 pc 00411613  /system/lib/libart.so (art_quick_alloc_array_resolved16_region_tlab+82)
#05 pc 0020cfe3  /system/framework/arm/boot-core-oj.oat (offset 0x10d000) (java.lang.AbstractStringBuilder.append+242)
#06 pc 002b809b  /system/framework/arm/boot-core-oj.oat (offset 0x10d000) (java.lang.StringBuilder.append+50)
#07 pc 001199b7  /system/framework/arm/boot-core-libart.oat (offset 0x76000) (org.json.JSONTokener.nextString+214)
#08 pc 00119b73  /system/framework/arm/boot-core-libart.oat (offset 0x76000) (org.json.JSONTokener.nextValue+162)
#09 pc 001195db  /system/framework/arm/boot-core-libart.oat (offset 0x76000) (org.json.JSONTokener.readObject+314)
#10 pc 00119b47  /system/framework/arm/boot-core-libart.oat (offset 0x76000) (org.json.JSONTokener.nextValue+118)
#11 pc 0040d775  /system/lib/libart.so (art_quick_invoke_stub_internal+68)
#12 pc 003e72c9  /system/lib/libart.so (art_quick_invoke_stub+224)
#13 pc 000a103d  /system/lib/libart.so (art::ArtMethod::Invoke(art::Thread*, unsigned int*, unsigned int, art::JValue*, char const*)+136)
#14 pc 001e60f1  /system/lib/libart.so (art::interpreter::ArtInterpreterToCompiledCodeBridge(art::Thread*, art::ArtMethod*, art::ShadowFrame*, unsigned short, art::JValue*)+236)
#15 pc 001e0bdf  /system/lib/libart.so (bool art::interpreter::DoCall<false, false>(art::ArtMethod*, art::Thread*, art::ShadowFrame&, art::Instruction const*, unsigned short, art::JValue*)+814)
#16 pc 003e1f23  /system/lib/libart.so (MterpInvokeVirtual+442)
#17 pc 00400514  /system/lib/libart.so (ExecuteMterpImpl+14228)
#18 pc 002613ec  /system/priv-app/ReusLauncherDev/ReusLauncherDev.apk (offset 0x9c9000) (com.reus.launcher.AsusAnimationIconReceiver.a+80)
#19 pc 001c535b  /system/lib/libart.so (_ZN3art11interpreterL7ExecuteEPNS_6ThreadERKNS_20CodeItemDataAccessorERNS_11ShadowFrameENS_6JValueEb.llvm.866626450+378)
#20 pc 001c9a41  /system/lib/libart.so (art::interpreter::ArtInterpreterToInterpreterBridge(art::Thread*, art::CodeItemDataAccessor const&, art::ShadowFrame*, art::JValue*)+152)
#21 pc 001e0bc7  /system/lib/libart.so (bool art::interpreter::DoCall<false, false>(art::ArtMethod*, art::Thread*, art::ShadowFrame&, art::Instruction const*, unsigned short, art::JValue*)+790)
#22 pc 003e2eff  /system/lib/libart.so (MterpInvokeStatic+130)
#23 pc 00400694  /system/lib/libart.so (ExecuteMterpImpl+14612)
#24 pc 0028ae7a  /system/priv-app/ReusLauncherDev/ReusLauncherDev.apk (offset 0x9c9000) (com.reus.launcher.d.run+1274)
#25 pc 001c535b  /system/lib/libart.so (_ZN3art11interpreterL7ExecuteEPNS_6ThreadERKNS_20CodeItemDataAccessorERNS_11ShadowFrameENS_6JValueEb.llvm.866626450+378)
#26 pc 001c9987  /system/lib/libart.so (art::interpreter::EnterInterpreterFromEntryPoint(art::Thread*, art::CodeItemDataAccessor const&, art::ShadowFrame*)+82)
#32 pc 0040d775  /system/lib/libart.so (art_quick_invoke_stub_internal+68)
#33 pc 003e72c9  /system/lib/libart.so (art_quick_invoke_stub+224)
#34 pc 000a103d  /system/lib/libart.so (art::ArtMethod::Invoke(art::Thread*, unsigned int*, unsigned int, art::JValue*, char const*)+136)
#36 pc 00348f6d  /system/lib/libart.so (art::InvokeVirtualOrInterfaceWithJValues(art::ScopedObjectAccessAlreadyRunnable const&, _jobject*, _jmethodID*, jvalue*)+320)
#37 pc 00369ee7  /system/lib/libart.so (art::Thread::CreateCallback(void*)+866)
#38 pc 00072131  /system/lib/libc.so (__pthread_start(void*)+22)
#39 pc 0001e005  /system/lib/libc.so (__start_thread+24)
24 is a virtual frame, that is, it does not exist on the stack, but the information added by auxiliary debugging. It reflects the java methods being interpreted by the 2325 frame interpreter. 0510 reflects the java method of machine code execution (AOT compilation). 00 ~ 04 reflect the function calls of pure native layer (so Library).
Then there is a question that haunts our mind: libunwindstack can collect the call information of the java layer. Why does the native call stack in the trace file only display the call information of the native layer?
The reason is that the trace file is truncated and omitted when collecting the call stack. The specific strategies are as follows:
- In the process of backtracking, if a frame whose file suffix is oat or odex is encountered, the backtracking will be stopped. The reason is that the java methods compiled by JNI's springboard function / AOT are usually in the oat/odex file. When they encounter them, the backtracking of subsequent java methods can be omitted.
backtrace_map_->SetSuffixesToIgnore(std::vector<std::string> { "oat", "odex" });
- If there are frames falling in "libunwindstack.so" and "libbacktrace.so" in the backtracked stack frames, they will not be displayed. The reason is that these frames reflect the call stack collection process rather than the original call logic of the thread.
std::vector<std::string> skip_names{"libunwindstack.so", "libbacktrace.so"};
5.3 defects in current call stack backtracking
If you think carefully about the first item of the above strategy, you can find that it is flawed. This defect mainly has two points:
- Does the JNI springboard function have to be in the oat/odex file?
Not really. In the dex2oat stage, the system will uniformly generate a JNI springboard function for native methods with compatible parameters (the same number and similar types) in an oat/odex file. This can be expanded, for example.
#05 pc 00000000000eeb24  /system/lib64/libandroid_runtime.so (android::nativeCreate(_JNIEnv*, _jclass*, _jstring*, int)+132)
    #06 pc 00000000003dff04  /system/framework/arm64/boot-framework.oat (offset 0x3d6000) (android.graphics.FontFamily.nInitBuilder [DEDUPED]+180)
    #07 pc 000000000091414c  /system/framework/arm64/boot-framework.oat (offset 0x3d6000) (android.database.CursorWindow.<init>+172)
For example, calling the stack is a typical output of the previous tombstone file of Android S. We can know from the code that #7 the CursorWindow construction method in #7 clearly calls the nativeCreate method, but why does the backtracked method #6 is nInitBuilder? The reason is that a JNI springboard function can be used by multiple native methods, and only one name is selected from many native methods during backtracking. Therefore, the subsequent DEDUPED reminds us that this frame is not credible. The specific explanations are as follows:
    ## DEDUPED frames

    If the name of a Java method includes `[DEDUPED]`, this means that multiple
    methods share the same code. ART only stores the name of a single one in its
    metadata, which is displayed here. This is not necessarily the one that was
    called.
Continue to check the method definitions of nativeCreate and nInitBuilder. You can find that the number and type of their parameters are the same, so you can share a JNI springboard function after dex2oat.
private static native long nativeCreate(String name, int cursorWindowSize);
private static native long nInitBuilder(String langs, int variant);
Fortunately, starting from Android S, this frame no longer displays the specific method name, but a unified method_ jni_ Trampoline, which can reduce the trouble for developers. The following example.
    #05 pc 00000000004a600c  /apex/com.android.art/lib64/libart.so (art::VMDebug_countInstancesOfClass(_JNIEnv*, _jclass*, _jclass*, unsigned char)+876) (BuildId: 2ede688a1cdde049a8439e413c1c41f8)
    #06 pc 0000000000010fb4  /apex/com.android.art/javalib/arm64/boot-core-libart.oat (art_jni_trampoline+180) (BuildId: a58ab7e35be2dda5ad3453c56bfefea6edf331bf)
    #07 pc 000000000064037c  /system/framework/arm64/boot-framework.oat (android.os.Debug.countInstancesOfClass+44) (BuildId: e47113da18d4f822af52023fa19893d55035facd)
    #08 pc 0000000000812930  /system/framework/arm64/boot-framework.oat (android.view.ViewDebug.getViewRootImplCount+48) (BuildId: e47113da18d4f822af52023fa19893d55035facd)
The book gets to the point. The JNI springboard function generated by dex2oat is actually located in the oat/odex file. However, in another case, dex2oat does not generate JNI springboard functions for the native method, but uses a unified art at runtime_ quick_ generic_ jni_ Trampoline to dynamically perform parameter transfer and state switching. At this time, art_quick_generic_jni_trampoline is located in libart So does not conform to the law of oat/odex suffix, so the call stack backtracking will continue when it encounters this frame. If all subsequent java methods are interpreted and executed, all interpreted and executed frames will be traced back, as shown in the following example.
    "Binder:1083_11" prio=5 tid=127 Native
      | group="main" sCount=1 dsCount=0 flags=1 obj=0x16002138 self=0xb40000715181e940
      | sysTid=6990 nice=0 cgrp=default sched=0/0 handle=0x6f5580fcc0
      | state=S schedstat=( 4739949803 13009985270 12510 ) utm=234 stm=239 core=3 HZ=100
      | stack=0x6f55718000-0x6f5571a000 stackSize=995KB
      | held mutexes=
      native: #00 pc 000000000009aa34  /apex/com.android.runtime/lib64/bionic/libc.so (__ioctl+4)
      native: #01 pc 0000000000057564  /apex/com.android.runtime/lib64/bionic/libc.so (ioctl+156)
      native: #02 pc 00000000000999d4  /system/lib64/libhidlbase.so (android::hardware::IPCThreadState::transact(int, unsigned int, android::hardware::Parcel const&, android::hardware::Parcel*, unsigned int)+564)
      native: #03 pc 0000000000094e84  /system/lib64/libhidlbase.so (android::hardware::BpHwBinder::transact(unsigned int, android::hardware::Parcel const&, android::hardware::Parcel*, unsigned int, std::__1::function<void (android::hardware::Parcel&)>)+76)
      native: #04 pc 000000000000e538  /system/lib64/android.system.suspend@1.0.so (android::system::suspend::V1_0::BpHwSystemSuspend::_hidl_acquireWakeLock(android::hardware::IInterface*, android::hardware::details::HidlInstrumentor*, android::system::suspend::V1_0::WakeLockType, android::hardware::hidl_string const&)+324)
      native: #05 pc 0000000000003178  /system/lib64/libhardware_legacy.so (acquire_wake_lock+356)
      native: #06 pc 0000000000086648  /system/lib64/libandroid_servers.so (android::nativeAcquireSuspendBlocker(_JNIEnv*, _jclass*, _jstring*)+64)
      native: #07 pc 000000000013ced4  /apex/com.android.art/lib64/libart.so (art_quick_generic_jni_trampoline+148)
      native: #08 pc 00000000001337e8  /apex/com.android.art/lib64/libart.so (art_quick_invoke_static_stub+568)
      native: #09 pc 00000000001a8a94  /apex/com.android.art/lib64/libart.so (art::ArtMethod::Invoke(art::Thread*, unsigned int*, unsigned int, art::JValue*, char const*)+228)
      native: #10 pc 0000000000318240  /apex/com.android.art/lib64/libart.so (art::interpreter::ArtInterpreterToCompiledCodeBridge(art::Thread*, art::ArtMethod*, art::ShadowFrame*, unsigned short, art::JValue*)+376)
      native: #11 pc 000000000030e56c  /apex/com.android.art/lib64/libart.so (bool art::interpreter::DoCall<false, false>(art::ArtMethod*, art::Thread*, art::ShadowFrame&, art::Instruction const*, unsigned short, art::JValue*)+996)
      native: #12 pc 000000000067e098  /apex/com.android.art/lib64/libart.so (MterpInvokeStatic+548)
      native: #13 pc 000000000012d994  /apex/com.android.art/lib64/libart.so (mterp_op_invoke_static+20)
      native: #14 pc 0000000000617e00  /system/framework/services.jar (com.android.server.power.PowerManagerService.access$600)
      native: #15 pc 000000000067e33c  /apex/com.android.art/lib64/libart.so (MterpInvokeStatic+1224)
      native: #16 pc 000000000012d994  /apex/com.android.art/lib64/libart.so (mterp_op_invoke_static+20)
      native: #17 pc 0000000000614fec  /system/framework/services.jar (com.android.server.power.PowerManagerService$NativeWrapper.nativeAcquireSuspendBlocker)
      native: #18 pc 000000000067b3e0  /apex/com.android.art/lib64/libart.so (MterpInvokeVirtual+1520)
      native: #19 pc 000000000012d814  /apex/com.android.art/lib64/libart.so (mterp_op_invoke_virtual+20)
      native: #20 pc 00000000006152b0  /system/framework/services.jar (com.android.server.power.PowerManagerService$SuspendBlockerImpl.acquire+52)
      native: #21 pc 0000000000305b68  /apex/com.android.art/lib64/libart.so (art::interpreter::Execute(art::Thread*, art::CodeItemDataAccessor const&, art::ShadowFrame&, art::JValue, bool, bool) (.llvm.10833873914857160001)+268)
      native: #22 pc 0000000000669e48  /apex/com.android.art/lib64/libart.so (artQuickToInterpreterBridge+780)
      native: #23 pc 000000000013cff8  /apex/com.android.art/lib64/libart.so (art_quick_to_interpreter_bridge+88)
      native: #24 pc 00000000021f4bc4  /memfd:jit-cache (deleted) (offset 2000000) (com.android.server.power.PowerManagerService.updateSuspendBlockerLocked+228)
      native: #25 pc 000000000201cf6c  /memfd:jit-cache (deleted) (offset 2000000) (com.android.server.power.PowerManagerService.updatePowerStateLocked+988)
      native: #26 pc 00000000021a3800  /memfd:jit-cache (deleted) (offset 2000000) (com.android.server.power.PowerManagerService.acquireWakeLockInternal+1712)
      native: #27 pc 000000000205640c  /memfd:jit-cache (deleted) (offset 2000000) (com.android.server.power.PowerManagerService$BinderService.acquireWakeLock+524)
      native: #28 pc 0000000002040b64  /memfd:jit-cache (deleted) (offset 2000000) (android.os.IPowerManager$Stub.onTransact+8340)
      native: #29 pc 00000000020c95a4  /memfd:jit-cache (deleted) (offset 2000000) (android.os.Binder.execTransactInternal+996)
      native: #30 pc 00000000020b9a0c  /memfd:jit-cache (deleted) (offset 2000000) (android.os.Binder.execTransact+284)
      native: #31 pc 0000000000133564  /apex/com.android.art/lib64/libart.so (art_quick_invoke_stub+548)
      native: #32 pc 00000000001a8a78  /apex/com.android.art/lib64/libart.so (art::ArtMethod::Invoke(art::Thread*, unsigned int*, unsigned int, art::JValue*, char const*)+200)
      native: #33 pc 0000000000553c70  /apex/com.android.art/lib64/libart.so (art::JValue art::InvokeVirtualOrInterfaceWithVarArgs<art::ArtMethod*>(art::ScopedObjectAccessAlreadyRunnable const&, _jobject*, art::ArtMethod*, std::__va_list)+468)
      native: #34 pc 0000000000553e10  /apex/com.android.art/lib64/libart.so (art::JValue art::InvokeVirtualOrInterfaceWithVarArgs<_jmethodID*>(art::ScopedObjectAccessAlreadyRunnable const&, _jobject*, _jmethodID*, std::__va_list)+92)
      native: #35 pc 00000000003a0920  /apex/com.android.art/lib64/libart.so (art::JNI<false>::CallBooleanMethodV(_JNIEnv*, _jobject*, _jmethodID*, std::__va_list)+660)
      native: #36 pc 000000000009c698  /system/lib64/libandroid_runtime.so (_JNIEnv::CallBooleanMethod(_jobject*, _jmethodID*, ...)+124)
      native: #37 pc 0000000000124064  /system/lib64/libandroid_runtime.so (JavaBBinder::onTransact(unsigned int, android::Parcel const&, android::Parcel*, unsigned int)+156)
      native: #38 pc 000000000004882c  /system/lib64/libbinder.so (android::BBinder::transact(unsigned int, android::Parcel const&, android::Parcel*, unsigned int)+232)
      native: #39 pc 0000000000051110  /system/lib64/libbinder.so (android::IPCThreadState::executeCommand(int)+1032)
      native: #40 pc 0000000000050c58  /system/lib64/libbinder.so (android::IPCThreadState::getAndExecuteCommand()+156)
      native: #41 pc 0000000000051490  /system/lib64/libbinder.so (android::IPCThreadState::joinThreadPool(bool)+60)
      native: #42 pc 00000000000773e0  /system/lib64/libbinder.so (android::PoolThread::threadLoop()+24)
      native: #43 pc 000000000001549c  /system/lib64/libutils.so (android::Thread::_threadLoop(void*)+260)
      native: #44 pc 00000000000a2590  /system/lib64/libandroid_runtime.so (android::AndroidRuntime::javaThreadShell(void*)+144)
      native: #45 pc 0000000000014d60  /system/lib64/libutils.so (thread_data_t::trampoline(thread_data_t const*)+412)
      native: #46 pc 00000000000af808  /apex/com.android.runtime/lib64/bionic/libc.so (__pthread_start(void*)+64)
      native: #47 pc 000000000004fc88  /apex/com.android.runtime/lib64/bionic/libc.so (__start_thread+64)
      at com.android.server.power.PowerManagerService.nativeAcquireSuspendBlocker(Native method)
      at com.android.server.power.PowerManagerService.access$600(PowerManagerService.java:125)
      at com.android.server.power.PowerManagerService$NativeWrapper.nativeAcquireSuspendBlocker(PowerManagerService.java:713)
      at com.android.server.power.PowerManagerService$SuspendBlockerImpl.acquire(PowerManagerService.java:4643)
      - locked <0x073deae2> (a com.android.server.power.PowerManagerService$SuspendBlockerImpl)
      at com.android.server.power.PowerManagerService.updateSuspendBlockerLocked(PowerManagerService.java:3067)
      at com.android.server.power.PowerManagerService.updatePowerStateLocked(PowerManagerService.java:1956)
      at com.android.server.power.PowerManagerService.acquireWakeLockInternal(PowerManagerService.java:1320)
      - locked <0x03f99c8c> (a java.lang.Object)
      at com.android.server.power.PowerManagerService.access$4600(PowerManagerService.java:125)
      at com.android.server.power.PowerManagerService$BinderService.acquireWakeLock(PowerManagerService.java:4780)
      at android.os.IPowerManager$Stub.onTransact(IPowerManager.java:421)
      at android.os.Binder.execTransactInternal(Binder.java:1154)
      at android.os.Binder.execTransact(Binder.java:1123)
It can be found that the call stack of the native tag actually contains the information of the java layer, Therefore, the information of the java layer is output twice (information redundancy). If you don't understand the specific principle of stack backtracking, I'm afraid many people will wonder: why does the java method of nativeacquiresuspendlocker call #47 the #u start#u thread? This is not the real call path, but just because there are some defects in the current trace call stack collection scheme.
- When the call stack backtracking encounters the JNI springboard function located in the oat/odex file, it stops backtracking. This scheme is suitable for most scenarios. However, if the function call presents the following interleaving situation, the current scheme will lose part of the call stack.
    Java method A
    ↓(call)
    Native method B
    ↓(call)
    Java method C
    ↓(call)
    Native method D
In the overall call stack information finally traced back, Native method B will not be found, because the backtracking of the native layer has ended when it meets C. The following is a practical case.
    "Binder:1540_2" prio=5 tid=9 Blocked
    | group="main" sCount=1 dsCount=0 flags=1 obj=0x13700580 self=0x7e0c139800
    | sysTid=1560 nice=-2 cgrp=default sched=0/0 handle=0x7df07474f0
    | state=S schedstat=( 126689305075 80266662086 342299 ) utm=8978 stm=3690 core=0 HZ=100
    | stack=0x7df064c000-0x7df064e000 stackSize=1009KB
    | held mutexes=
    at com.android.server.LocationManagerService.isProviderEnabledForUser(LocationManagerService.java:2813)
    - waiting to lock <0x07cdf9c8> (a java.lang.Object) held by thread 11
    at android.location.ILocationManager$Stub.onTransact(ILocationManager.java:488)
    at android.os.Binder.execTransact(Binder.java:726)
    (---Lost the middle native Call stack---)
    at android.os.BinderProxy.transactNative(Native method)
    at android.os.BinderProxy.transact(BinderProxy.java:473)
    at android.location.IGeocodeProvider$Stub$Proxy.getFromLocation(IGeocodeProvider.java:143)
    at com.android.server.location.GeocoderProxy$1.run(GeocoderProxy.java:79)
    at com.android.server.ServiceWatcher.runOnBinder(ServiceWatcher.java:425)
    - locked <0x0d7e7a61> (a java.lang.Object)
    at com.android.server.location.GeocoderProxy.getFromLocation(GeocoderProxy.java:74)
    at com.android.server.LocationManagerService.getFromLocation(LocationManagerService.java:3341)
    at android.location.ILocationManager$Stub.onTransact(ILocationManager.java:217)
    at android.os.Binder.execTransact(Binder.java:726)
The thread first initiates a binder communication to the opposite process, and the opposite process initiates a new communication to the process during processing. Based on the design of binder transaction stack, this new communication must be handed over to the original thread. Therefore, execTransact indicates that it is processing the communication. Between transactNative and execTransact, the frames of the native layer are actually omitted.
These two defects are actually small problems and harmless. After communicating with Google engineers, they said they would probably fix these problems on T.
epilogue
When we solve most APP problems, the call stack is the most important analysis material. If it can always perfectly reflect the execution logic of threads, it doesn't matter whether you know the details or not. But this is not the case. In some scenarios of ANR, the thread may be stuck in GoToRunnable; In the case of interleaving calls, the intermediate native method may be lost. wait. At these times, confusing information will appear in the call stack, and only by understanding the details of backtracking can we really solve the confusion.
Advanced notes of Android advanced development system, latest interview review notes PDF, My GitHub
end of document
Your favorite collection is my greatest encouragement!
Welcome to follow my brief book, share Android dry goods and exchange Android technology.
If you have any opinions on the article or any technical problems, please leave a message in the comment area for discussion!