Arhtas collected some materials during his study. For the current company's projects, the most practical one is online hot update, and the rest are of little use for the time being,
Basic command
rest: restore the enhanced class. You can filter it with parameters. It will be reset automatically when the server is shut down
Trace: trace a class under a package
History: history command
quti: exit
keymap: display shortcut keys
jvm related commands
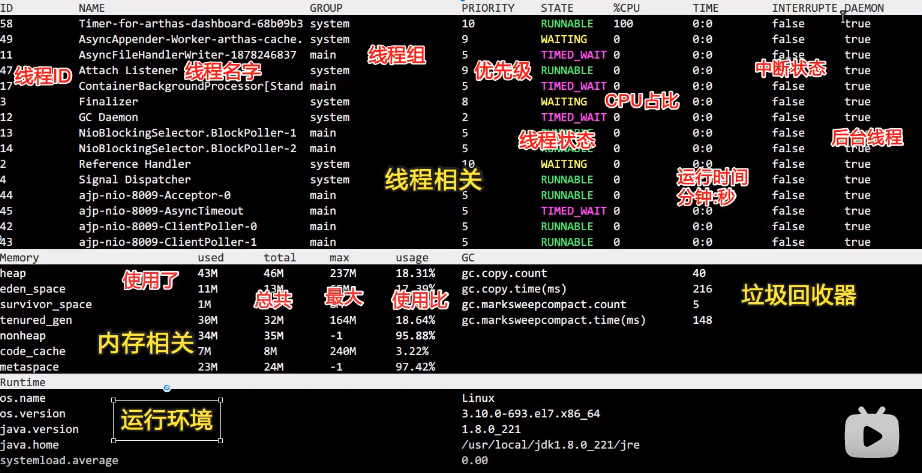
Dashboard dashboard

thread related
jvm related information
sysprop
System attribute related information, modifiable
sysenv system environment
getstatic
getstatic class name property name acquisition
ognl command
express: expression executed
[c:] the hashcode of the ClassLoader that executes the expression. The default value is SystemClassLoader
[x] The expansion hierarchy of the result object. The default value is 1
class/classloader related commands
sc:
search class

sm:
search method
💡jad:
Compile the source code
  #Decompile the java code first, and the following queryPatinfo is the method name. If it is not written, it is to compile the whole class, otherwise it is only the current method; If there is no – source only in front, the classpath and classloader will not be displayed, and the file is saved under opt by default
  jad --source-only  cn.swifthealth.sync.api.inpat.service.InMainAndOrderServiceImpl  >  queryPatinfo
  #Then edit the code
  vi queryPatinfo
  #Find class loader
  sc -d cn.swifthealth.sync.api.dbmonitor.service.DbStatusServiceImpl | grep classLoaderHash
  #Compile as a class file, - d followed by the saved path
  mc -c 49c2faae /opt/queryPatinfo -d /opt
  #Hot renewal
  redefine queryPatinfo.cal
  #Note: when adding / deleting a field/method, redefine may fail. If the currently executed method is running all the time, it will not take effect
💡 watch command
# watch command:

# To view input and return values of a method:
watch cn.swifthealth.sync.api.inpat.service.InMainAndOrderServiceImpl queryPatinfo {params,returnObj} -x 4

#  Example: watch classpath method name {parameter and return value} traversal depth
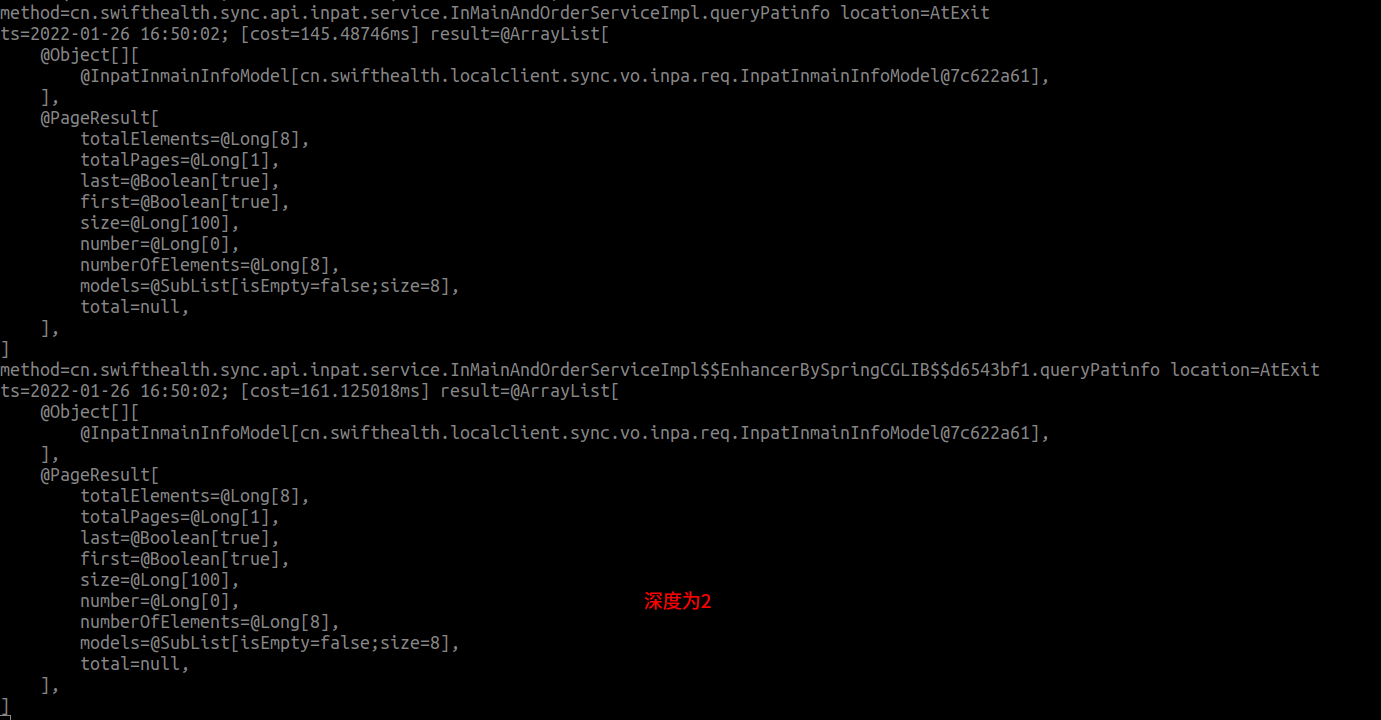
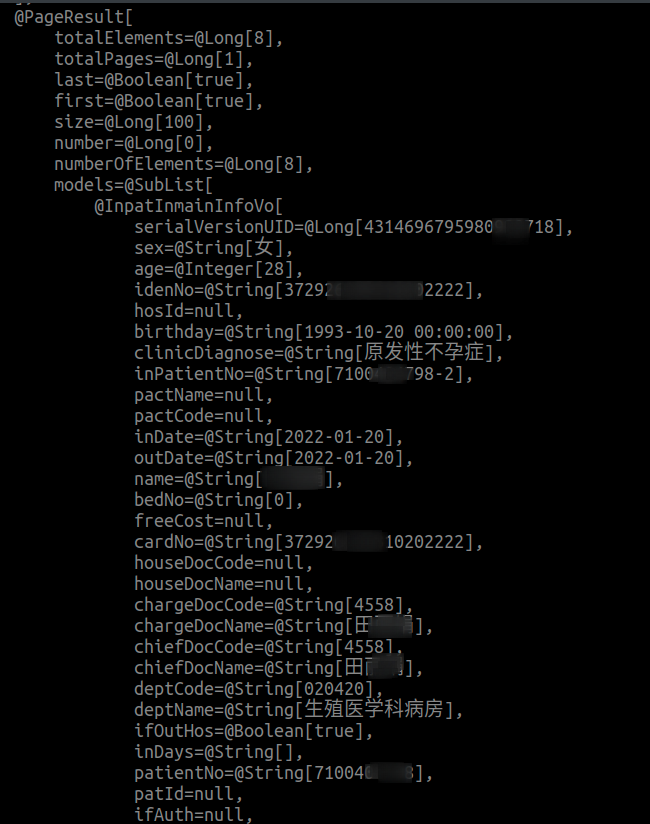
#  Note: if you only need to display parameters or return values, write them directly without curly braces. If you need to return multiple information, enclose them, - x and the following numbers to indicate the depth of traversal. If the depth is not enough, a model is returned. The console can only see the path of the class. Only when the depth is reached can the specific return value be returned, The following branch lists the return values when the depth is 2 and 4

| Parameter name | Parameter description |
|---|---|
| class-pattern | Class name expression match |
| method-pattern | Function name matches expression |
| express | Observation expression, default value: {params, target, returnObj} |
| condition-express | Conditional expression |
| [b] | Observe before function call |
| [e] | Observe after function exception |
| [s] | Observe after the function returns |
| [f] | Observe after the end of the function (normal return and abnormal return) |
| [E] | Enable regular expression matching. The default is wildcard matching |
| [x:] | Specifies the attribute traversal depth of the output result, which is 1 by default |


???
watch cn.swifthealth.sync.api.inpat.service.InMainAndOrderServiceImpl queryPatinfo {params,returnObj} 'params[1]="abc"'   -x 3

By adding '' ,The filter conditions are written in it to realize that only the specified contents are displayed. The problem is how to filter according to the value of a certain field of the input parameter
 Results to be filtered target Represents, and then the specific field is represented by target.Property name representation.
--Check in reference
watch cn.swifthealth.sync.api.inpat.service.InMainAndOrderServiceImpl queryPatinfo params -x 2 -b
--Filter by time
watch cn.swifthealth.sync.api.inpat.service.InMainAndOrderServiceImpl queryPatinfo '{params,returnObj}' '#cost>10' -x
dump
Save the class file
 #dump class path, which saves the compiled class to a folder with the name of class loader for access
 dump cn.swifthealth.sync.api.inpat.service.InMainAndOrderServiceImpl
montor
#Monitor the call of a method under a class within a specified time period, - c indicates cycle, that is, how long the interval is regarded as a cycle. If not written, the default is 120s, - c 3 indicates 3s a monitoring cycle
monitor cn.swifthealth.sync.api.inpat.service.InMainAndOrderServiceImpl queryPatinfo -c 3

💡trace
Track the internal call path to locate the time-consuming situation on each node
#[n:] set the number of command executions- n 5 means to monitor the method calls for 5 times. If it is not written, it means to call the method for several times and track it for several times (it can not be written)
trace  cn.swifthealth.sync.api.inpat.service.InMainAndOrderServiceImpl queryPatinfo -n 5
#cost   Method execution time, in milliseconds      '#Cost > 100 'means that only the execution that takes more than 100ms is monitored (no writing is allowed)
trace  cn.swifthealth.sync.api.inpat.service.InMainAndOrderServiceImpl queryPatinfo '#cost > 100'
stack
Output method call path (feel useless)
#[E] Regular expression matching
 and trace similar
#[n:] number of calls
 and trace similar
tt
time_tunnel time tunnel records the input and return information of each specified method call, and can observe the information called at different times
| Parameters of tt | explain |
|---|---|
| -t | Record the call of a method in a time period |
| -l | Displays a list of all recorded |
| -n | Record times only |
| -s | search expression |
| -i | View the call details of the specified index number |

tt -t cn.swifthealth.sync.api.inpat.service.InMainAndOrderServiceImpl queryPatinfo
Flame diagram
# Start error
[arthas@1]$ profiler start
Perf events unavailable. See stderr of the target process.
perf_event_open() syscall has failed. The error message is printed to the error stream of the target JVM.
# Cause of problem
Typical reasons include:
/proc/sys/kernel/perf_event_paranoid is set to restricted mode (>=2).
/proc/sys/kernel/perf_event_paranoid Set to restricted mode(> = 2)
# Problem solving
# From Linux 4 Starting with 6, if you need to use perf in a process started by a non root user_ Events, which captures the information of the kernel call stack. Two system runtime variables need to be set. You can use sysctl or set them as follows:
echo 1 > /proc/sys/kernel/perf_event_paranoid
echo 0 > /proc/sys/kernel/kptr_restrict
- profile start start flame diagram
- Get sample from profile getSample
- profile list sample list
- profile status sample get status