In the last blog post, it was said that Prometheus has four indicator types: Counter, Gauge, Histogram and Summary. We made a Counter Demo. Next, let's take a look at Histogram.
3. Histogram: histogram
Histogram, the definition of Wikipedia: it is a graphical representation of data distribution and a two-dimensional statistical chart. Its two coordinates are the measurement of the statistical Sample and an attribute corresponding to the Sample, which is specifically expressed in the form of bar. Because the length and width of the histogram are very suitable for expressing quantitative changes, it is easier to interpret values with small differences. Let's take the Sample in the previous article to illustrate that if each order has an amount, it will be returned in the data attribute of the return value {result=true,data=1000} in order. Here, we can use the histogram to collect this amount. Because the amount of the order is different, we can use the histogram to display the data of the order within a certain amount, The order proportion within a certain amount range has been monitored. That is, in a certain number of orders, how many orders are there for less than 1000 yuan, how many orders are there for less than 2000 yuan, and how many orders are there for less than 3000 yuan
First, we have to modify the business logic of Order Action in BusinessController and take the order amount as the return value:
 [HttpGet("/order")]
        public IActionResult Order(string orderno)
        {
            try
            {
                _logger.LogInformation("place an order");
                //Return order amount
                var random = new Random();
                return new JsonResult(new { Result = true, data = random.Next(1, 8000) });
            }
            catch (Exception exc)
            {
                _logger.LogCritical(exc, exc.Message);
                return new JsonResult(new
                {
                    Result = false,
                    Message = exc.Message
                });
            }
        }
The amount here is a random number from 1 to 8000 for the convenience of demo.
Need to be in metricshub Add an indicator collection of Histogram type to CS:
using Prometheus;
using System.Collections.Generic;

namespace PrometheusSample.Middlewares
{
    public class MetricsHub
    {
        private static Dictionary<string, Counter> _counterDictionary = new Dictionary<string, Counter>();
        private static Dictionary<string, Dictionary<string, Gauge>> _gaugeDictionary = new Dictionary<string, Dictionary<string, Gauge>>();
        private static Dictionary<string, Histogram> _histogramDictionary = new Dictionary<string, Histogram>();

        public Counter GetCounter(string key)
        {
            if (_counterDictionary.ContainsKey(key))
            {
                return _counterDictionary[key];
            }
            else
            {
                return null;
            }
        }
        public Dictionary<string, Gauge> GetGauge(string key)
        {
            if (_gaugeDictionary.ContainsKey(key))
            {
                return _gaugeDictionary[key];
            }
            else
            {
                return null;
            }
        }
        public Histogram GetHistogram(string key)
        {
            if (_histogramDictionary.ContainsKey(key))
            {
                return _histogramDictionary[key];
            }
            else
            {
                return null;
            }
        }
        public void AddCounter(string key, Counter counter)
        {
            _counterDictionary.Add(key, counter);
        }
        public void AddGauge(string key, Dictionary<string, Gauge> gauges)
        {
            _gaugeDictionary.Add(key, gauges);
        }
        public void AddHistogram(string key, Histogram histogram)
        {
            _histogramDictionary.Add(key, histogram);
        }
    }
}
Next, we need to add the code to deal with Histogram indicators in the middleware of businessmetrics middleware:
using Microsoft.AspNetCore.Http;
using PrometheusSample.Models;
using System.IO;
using System.Threading.Tasks;

namespace PrometheusSample.Middlewares
{
    /// <summary>
    /// Request recording Middleware
    /// </summary>
    public class BusinessMetricsMiddleware
    {
        private readonly RequestDelegate _next;
        public BusinessMetricsMiddleware(RequestDelegate next)
        {
            _next = next;
        }
        public async Task InvokeAsync(HttpContext context, MetricsHub metricsHub)
        {
            var originalBody = context.Response.Body;
            try
            {
                using (var memStream = new MemoryStream())
                {
                    //Returned from management Response Take out the return data and count the monitoring indicators according to the return value
                    context.Response.Body = memStream;
                    await _next(context);

                    memStream.Position = 0;
                    string responseBody = new StreamReader(memStream).ReadToEnd();
                    memStream.Position = 0;
                    await memStream.CopyToAsync(originalBody);
                    if (metricsHub.GetCounter(context.Request.Path) != null || metricsHub.GetGauge(context.Request.Path) != null)
                    {
                        //All agreed here action The return value is a APIResult type
                        var result = System.Text.Json.JsonSerializer.Deserialize<APIResult>(responseBody, new System.Text.Json.JsonSerializerOptions { PropertyNameCaseInsensitive = true });
                        if (result != null && result.Result)
                        {
                            //Get Counter
                            var counter = metricsHub.GetCounter(context.Request.Path);
                            if (counter != null)
                            {
                                //count
                                counter.Inc();
                            }

                            var gauges = metricsHub.GetGauge(context.Request.Path);
                            if (gauges != null)
                            {
                                //There are additional indicators+Just Inc
                                if (gauges.ContainsKey("+"))
                                {
                                    gauges["+"].Inc();
                                }
                                //There are reduction indicators-Just Dec
                                if (gauges.ContainsKey("-"))
                                {
                                    gauges["-"].Dec();
                                }
                            }
                            var histogram = metricsHub.GetHistogram(context.Request.Path);
                            if (histogram != null)
                            {
                                var parseResult = int.TryParse(result.Data.ToString(), out int i);
                                if (parseResult)
                                {
                                    histogram.Observe(i);
                                }
                            }
                        }
                    }
                }
            }
            finally
            {
                context.Response.Body = originalBody;
            }
        }
    }
}
Then configure the Histogram parameter of the corresponding url in Starsup:
using Microsoft.AspNetCore.Builder;
using Microsoft.AspNetCore.Hosting;
using Microsoft.Extensions.Configuration;
using Microsoft.Extensions.DependencyInjection;
using Microsoft.Extensions.Hosting;
using Microsoft.OpenApi.Models;
using Prometheus;
using PrometheusSample.Middlewares;
using PrometheusSample.Services;

using System.Collections.Generic;

namespace PrometheusSample
{
    public class Startup
    {
        public Startup(IConfiguration configuration)
        {
            Configuration = configuration;
        }

        public IConfiguration Configuration { get; }


        public void ConfigureServices(IServiceCollection services)
        {
            MetricsHandle(services);
            services.AddScoped<IOrderService, OrderService>();
            services.AddControllers();
            services.AddSwaggerGen(c =>
            {
                c.SwaggerDoc("v1", new OpenApiInfo { Title = "PrometheusSample", Version = "v1" });
            });
        }


        public void Configure(IApplicationBuilder app, IWebHostEnvironment env)
        {
            if (env.IsDevelopment())
            {
                app.UseDeveloperExceptionPage();
                app.UseSwagger();
                app.UseSwaggerUI(c => c.SwaggerEndpoint("/swagger/v1/swagger.json", "PrometheusSample v1"));
            }

            app.UseRouting();
            //http Requested Middleware
            app.UseHttpMetrics();
            app.UseAuthorization();

            //Custom business tracking
            app.UseBusinessMetrics();

            app.UseEndpoints(endpoints =>
            {
                //The mapping monitoring address is  /metrics
                endpoints.MapMetrics();
                endpoints.MapControllers();
            });
        }
        /// <summary>
        /// Handle monitoring matters
        /// </summary>
        /// <param name="services"></param>
        void MetricsHandle(IServiceCollection services)
        {
            var metricsHub = new MetricsHub();
            //counter
            metricsHub.AddCounter("/register", Metrics.CreateCounter("business_register_user", "Number of registered users."));
            metricsHub.AddCounter("/order", Metrics.CreateCounter("business_order_total", "Total number of orders."));
            metricsHub.AddCounter("/pay", Metrics.CreateCounter("business_pay_total", "Total payments."));
            metricsHub.AddCounter("/ship", Metrics.CreateCounter("business_ship_total", "Total number of shipments."));

            //gauge
            var orderGauge = Metrics.CreateGauge("business_order_count", "Current order quantity.");
            var payGauge = Metrics.CreateGauge("business_pay_count", "Current payment quantity.");
            var shipGauge = Metrics.CreateGauge("business_ship_count", "Current shipment data.");

            metricsHub.AddGauge("/order", new Dictionary<string, Gauge> {
                { "+", orderGauge}
            });
            metricsHub.AddGauge("/pay", new Dictionary<string, Gauge> {
                {"-",orderGauge},
                {"+",payGauge}
            });
            metricsHub.AddGauge("/ship", new Dictionary<string, Gauge> {
                {"+",shipGauge},
                {"-",payGauge}
            });

            //histogram
            var orderHistogram = Metrics.CreateHistogram("business_order_histogram", "Order histogram.",
        new HistogramConfiguration
        {
            Buckets = Histogram.LinearBuckets(start: 1000, width: 1000, count: 5)
        });
            metricsHub.AddHistogram("/order", orderHistogram);
            services.AddSingleton(metricsHub);
        }
    }
}
Histogram.LinearBuckets(start: 1000, width: 1000, count: 5) is the amount starting from 1000. Every 1000 is a step. There are 6 steps in total: 0 ~ 10001001 ~ 20002001 ~ 30003001 ~ 4000401 ~ 5000, and one is greater than 5000.
The last step is to open Grafana to configure the display chart.
Order amount distribution chart
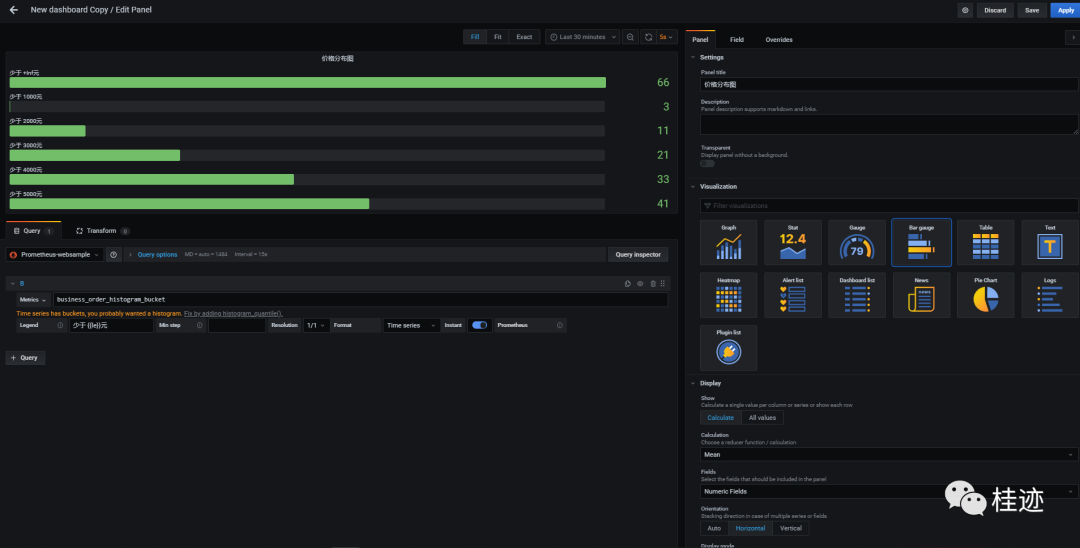
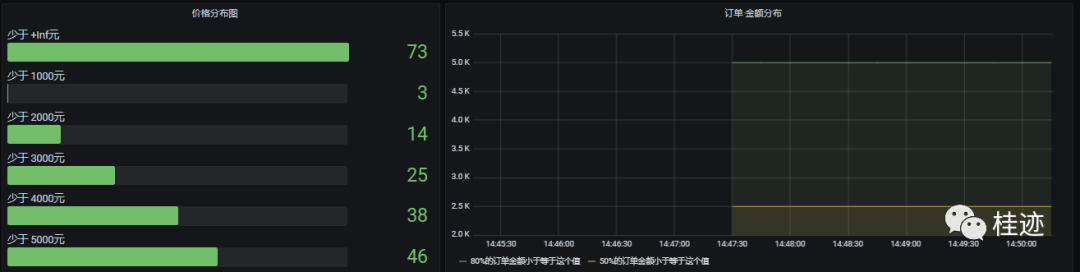
Order proportion distribution
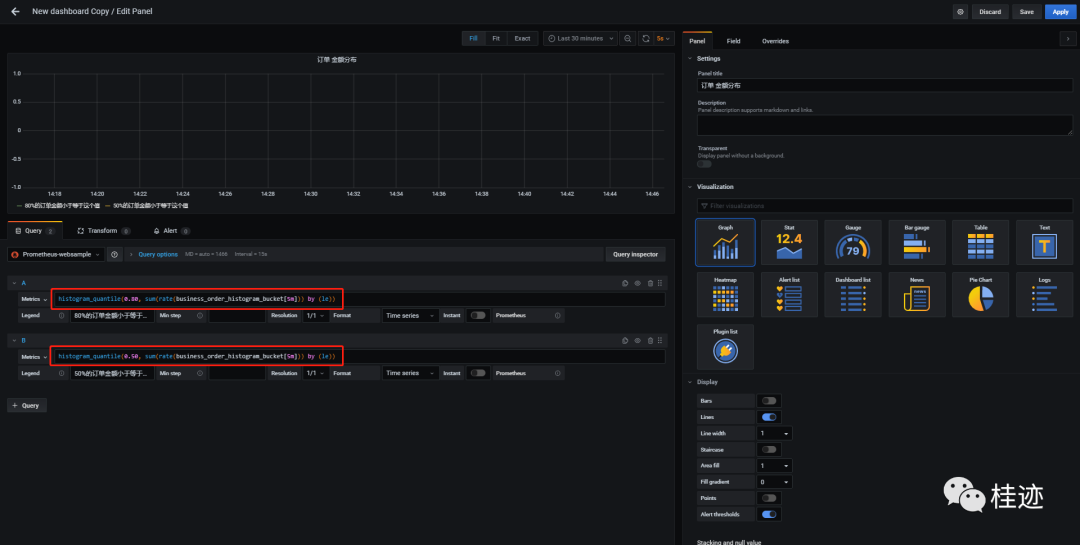
Histogram in the figure_ Quantitative (0.80, sum (rate (business_order_histogram_bucket [5m]) by (LE)) means the value within 5 minutes of "80% of the order amount is less than or equal to this value".
Final presentation results:
Smart, you must find that this blog post is the same as the previous one. Yes, it's just because the display types of monitoring indicators are different.