Jmeter+Maven+Jenkins automation framework construction
I preface
Some time ago, the company was just ready to start interface testing and interface monitoring. In order to enable interface testing and interface function monitoring, I designed the simplest Jmeter continuous integration interface testing framework based on my previous experience with Jmeter. Although there are many materials on the Internet, there are also many pits in the process of doing it. The main purpose of writing this paper is to record. However, in view of the clutter of the relevant materials that can be found on the Internet, we also share them in the spirit of open source sharing. I hope more people can benefit and make progress together.
This paper will consist of the following parts:
- Introduction to framework composition
- Frame selection characteristics
- Possible later expansion
Introduction to framework composition
No more nonsense. First, the previous framework diagram is simple and clear, and then explain the composition and specific operation steps of each part respectively. Due to the limited time, there is no time to make your own drawings. Please directly quote the ready-made pictures on the Internet.:)
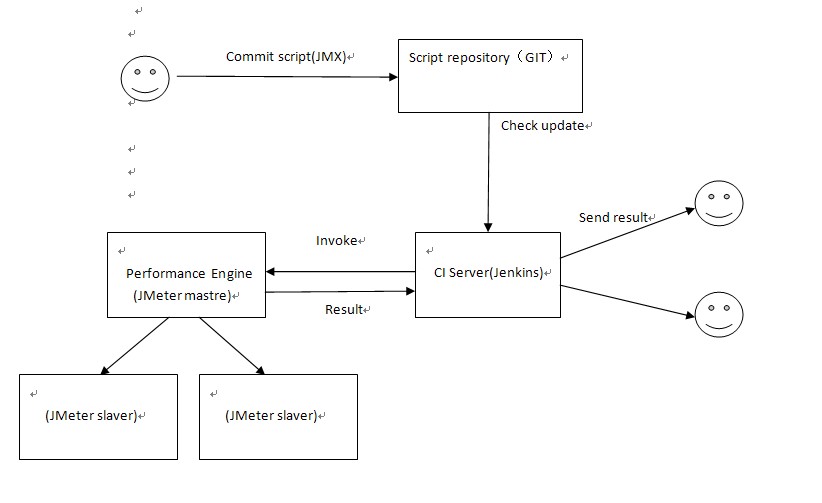
As can be seen from the above figure, the framework is mainly composed of three parts: Jmeter, Jenkins and Git, but there is also a very important role: Maven, so we should use four tools in total. As the designer of the framework, we should not only realize the framework, but also know the role of each part. Next, let's take a look at it separately:
**Jmeter, as the executor, is responsible for executing specific interface / performance test scripts each time, obtaining results and generating reports.
**Maven and Git are managers. The former is mainly responsible for the dependency management of the project, while the latter is mainly responsible for the code management of the project.
**As a dispatcher, Jenkins calls jmeter to test mainly according to the build trigger conditions and events we set
Frame selection characteristics
There are many tools and frameworks on the market that can achieve our goals. Why do we choose this type? Here is a brief explanation. I am an open source enthusiast. I don't have to say much about the benefits of open source. Therefore, generally, as long as there are open source tools to replace commercial tools, I will choose open source tools to implement them. For this framework, these four tools are open source and free, and have been very mature after a long time of use, so they are the best choice.
First, talk about the choice of interface testing tools. There are also a wide range of options for interface testing. The common ones are soupUI, httpclient, etc. you can even write tools in jave or python. However, the reason why we choose Jmeter instead of these interface tools is that generally, interface testing and performance testing are interlinked. If we can completely reuse these ready-made test scripts in the later performance testing process after writing the interface test scripts, it will greatly improve our script reuse rate and reduce a lot of repeated workload, It also greatly enhances the scalability of the framework. Jmeter is a very good choice. It can not only complete the interface test, but also do the performance test. There are all kinds of plug-ins. It's really not good. You can also write your own plugin. It's really cool.
Secondly, for project management tools, many people actually use ant in combination with jmeter. Ant and Maven are both software construction tools, but Maven is positioned as a software project management and understanding tool. Therefore, Maven has the following main functions in addition to ant:
1) Use Project Object Model to manage software projects;
2) Built in more implicit rules to make it easier to build files;
3) Built in dependency management and Repository to realize dependency management and unified storage. No matter the project is changed to any host, you don't need to care about dependency files, and you can update and configure them at any time;
4) Built in software construction life cycle;
In addition, Ant itself builds The rules for XML files are also complicated, and pom.xml based on Project Object Model XML files are much more friendly.
Third, there are not many git based code management. It is very convenient to establish a github project by yourself, which can be pulled through the GIT terminal anytime and anywhere.
Fourth, the importance of Jenkins for continuous integration is self-evident, and it is convenient for the integration and verification between test code and development code.
Possible later expansion
- In the Jmeter script project, add more interface test scripts according to the company's business
- Script reuse, using Jmeter's performance monitoring plug-in to monitor interface performance
- Add more configuration contents to make the framework more flexible and customizable, and add configurable modules (Jmeter Properties, email notification, test report display, etc.)
- Add the performance scenario analysis model and directly extend the interface test script to the performance test script to realize the interface and business stress test
II Prepare Jmeter script recording or writing
1. Install jmeter on the Linux server
Unzip the jmeter folder in the / opt/tools / directory
tar -zxvf apache-jmeter-3.1.tgz
Then set the environment variable
The Jmeter environment is configured as follows:
vi /root/.bash_profile
export JMETER_HOME=/home/jmeter
export CLASSPATH=$JMETER_HOME/lib/ext/ApacheJMeter_core.jar:$JMETER_HOME/lib/jorphan.jar:$JMETER_HOME/lib/logkit-2.0.jar:$CLASSPATH
export PATH=$JMETER_HOME/bin:$PATH:$HOME/bin
s: Replaces the specified number of characters with the entered text, starting at the current cursor position
Press ESC to jump to command mode, then: wq save the file and exit vi
source /root/.bash_profile
Then check the command line to see if the jmeter environment is set up
jmeter --version
/ \ | _ \ / \ / | | | | | | | / | | | | _
/ _ \ | |) / _ | | | || | | _ | | |/| | | | | | | | |) |
/ ___ | / ___ \ || _ | | | || | | | | | | | | || _ <
// __| // __|| ||| _/|| ||| |_| ||_| _\ 5.4.1
Copyright © 1999-2021 The Apache Software Foundation
JMeter interface
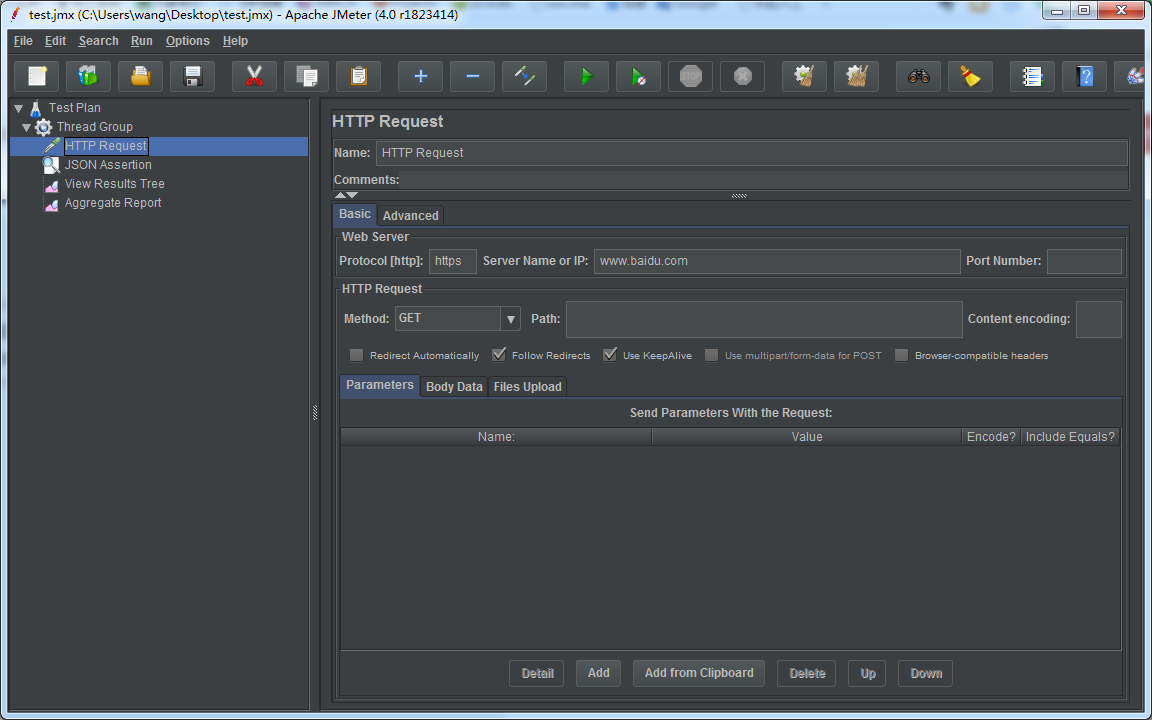
Design the test script in GUI mode and save it after the design is completed (this example is saved as test.jmx)
Run the test in command line mode: jmeter -n -t [jmx file] -l [results file] -e -o [Path to web report folder]
jmeter -n -t test.jmx -l result.jtl -e -o web
Detailed address: https://editor.csdn.net/md/?articleId=119416998
III Create Maven project and solutions to corresponding problems
After creating the maven project, create the required folder in the project directory
src/test/resources (Storing report template files and test report extensions/Shrink picture)

(1)Analyze test report

jmeter.results.shanhe.me.xsl
jmeter-results-detail-report_21.xsl
jmeter-results-report_21.xsl

(2)Solve the problem of extension in test report/Shrinkage problem

collapse.png
expand.png

src/test/jmeter (deposit jmeter Script files, configuration files, and parameters of some interface calls)

jmeter.properties
XXX.jmx
Test.jpeg Parametric file

newly build target File and store test results

–target/jmeter/bin deposit jmeter Some configuration files required for runtime
–target/jmeter/html deposit.jtl Parsed.html report
–target/jmeter/html1 Store the optimized report (including Request and Response)
–target/jmeter/lib deposit jemter Required at runtime jar package
–target/jmeter/logs Store log files
–target/jmeter/results deposit Jmeter Generated.jtl report
–target/jmeter/testFiles Automatic generation and storage jmeter script
Configuring pom files
<project xmlns="http://maven.apache.org/POM/4.0.0" xmlns:xsi="http://www.w3.org/2001/XMLSchema-instance"
         xsi:schemaLocation="http://maven.apache.org/POM/4.0.0 http://maven.apache.org/maven-v4_0_0.xsd">
    <modelVersion>4.0.0</modelVersion>
    <groupId>com.autotest.qa</groupId>
    <artifactId>JmeterAutoTest</artifactId>
    <version>1.11</version>
    <name>JmeterAutoTest Maven Webapp</name>
    <url>http://maven.apache.org</url>

    <properties>
        <jmeter.result.jtl.dir>${project.build.directory}\jmeter\results</jmeter.result.jtl.dir>
        <jmeter.result.html.dir>${project.build.directory}\jmeter\html</jmeter.result.html.dir>
        <jmeter.result.html.dir1>${project.build.directory}\jmeter\html1</jmeter.result.html.dir1>
        <ReportName>TestReport</ReportName>
    </properties>
    <dependencies>
        <dependency>
            <groupId>junit</groupId>
            <artifactId>junit</artifactId>
            <version>4.12</version>
            <scope>test</scope>
        </dependency>
        <dependency>
            <groupId>javax.servlet</groupId>
            <artifactId>servlet-api</artifactId>
            <version>3.0-alpha-1</version>
        </dependency>
        <dependency>
            <groupId>mysql</groupId>
            <artifactId>mysql-connector-java</artifactId>
            <version>5.1.13</version>
        </dependency>

        <!--here functions,json,postgresql Introduced for yourself jar package -->
        <dependency>
            <groupId>com.functions.jmeter</groupId>
            <artifactId>functions</artifactId>
            <version>1.0.2</version>
        </dependency>
        <dependency>
            <groupId>com.json.jmeter</groupId>
            <artifactId>json</artifactId>
            <version>1.0.2</version>
        </dependency>
        <dependency>
          <groupId>com.postgresql.jdbc</groupId>
          <artifactId>postgresql</artifactId>
          <version>1.0.2</version>
        </dependency>
    </dependencies>

    <pluginRepositories>
        <pluginRepository>
            <id>Codehaus repository</id>
            <url>http://repository.codehaus.org/</url>
            <releases>
                <enabled>true</enabled>
                <updatePolicy>always</updatePolicy>
            </releases>
            <snapshots>
                <enabled>true</enabled>
                <updatePolicy>always</updatePolicy>
            </snapshots>
        </pluginRepository>
    </pluginRepositories>
    <build>
        <finalName>AutoTest</finalName>
        <plugins>
            <plugin>
                <groupId>com.lazerycode.jmeter</groupId>
                <artifactId>jmeter-maven-plugin</artifactId>
                <version>2.2.0</version>
                <configuration>
                    <!-- Default report optimization, modifying jmeter.properties to configure -->
                    <propertiesJMeter>
                        <log_level.jmeter>DEBUG</log_level.jmeter>
                    </propertiesJMeter>
                    <resultsFileFormat>xml</resultsFileFormat>
                    <ignoreResultFailures>true</ignoreResultFailures>
                    <testResultsTimestamp>false</testResultsTimestamp>
                    <!-- Add extension -->
                    <jmeterExtensions>
                            <artifact>com.functions.jmeter:functions:1.0.2</artifact>
                            <artifact>com.json.jmeter:json:1.0.2</artifact>
                            <artifact>com.postgresql.jdbc:postgresql:1.0.2</artifact>
                    </jmeterExtensions>
                </configuration>
                <executions>
                    <execution>
                        <id>test</id>
                        <phase>verify</phase>
                        <goals>
                            <goal>jmeter</goal>
                        </goals>
                    </execution>
                </executions>
            </plugin>

            <plugin>
                <artifactId>maven-compiler-plugin</artifactId>
                <configuration>
                    <source>1.8</source>
                    <target>1.8</target>
                    <encoding>UTF-8</encoding>
                    <compilerArguments>
                        <extdirs>src\test\jmeter\lib</extdirs>
                    </compilerArguments>
                </configuration>
            </plugin>
            <!-- Solve the icon problem of report expansion and contraction -->
            <plugin>
                <artifactId>maven-resources-plugin</artifactId>
                <executions>
                    <execution>
                        <id>copy-resources</id>
                        <phase>compile</phase>
                        <goals>
                            <goal>copy-resources</goal>
                        </goals>
                        <configuration>
                            <outputDirectory>${project.build.directory}/jmeter/html</outputDirectory>
                            <resources>
                                <resource>
                                    <directory>${basedir}/src/test/resources</directory>
                                    <filtering>true</filtering>
                                </resource>
                            </resources>
                        </configuration>
                    </execution>
                </executions>
            </plugin>
            <plugin>
                <groupId>org.codehaus.mojo</groupId>
                <artifactId>xml-maven-plugin</artifactId>
                <version>1.0-beta-3</version>
                <executions>
                    <execution>
                        <phase>verify</phase>
                        <goals>
                            <goal>transform</goal>
                        </goals>
                    </execution>
                </executions>
                <configuration>
                    <transformationSets>
                        <transformationSet>
                            <dir>${jmeter.result.jtl.dir}</dir>
                            <stylesheet>src\test\resources\jmeter-results-detail-report_21.xsl</stylesheet>
                            <outputDir>${jmeter.result.html.dir}</outputDir>
                            <fileMappers>
                                <fileMapper
                                        implementation="org.codehaus.plexus.components.io.filemappers.FileExtensionMapper">
                                    <targetExtension>html</targetExtension>
                                </fileMapper>
                            </fileMappers>
                        </transformationSet>
                        <transformationSet>
                            <dir>${jmeter.result.jtl.dir}</dir>
                            <stylesheet>src\test\resources\jmeter.results.shanhe.me.xsl</stylesheet>
                            <outputDir>${jmeter.result.html.dir1}</outputDir>
                            <fileMappers>
                                <fileMapper
                                        implementation="org.codehaus.plexus.components.io.filemappers.FileExtensionMapper">
                                    <targetExtension>html</targetExtension>
                                </fileMapper>
                            </fileMappers>
                        </transformationSet>
                    </transformationSets>
                </configuration>
                <!-- using XSLT 2.0 Resolution time is NAN-->
                <dependencies>
                    <dependency>
                        <groupId>net.sf.saxon</groupId>
                        <artifactId>saxon</artifactId>
                        <version>8.7</version>
                    </dependency>
                </dependencies>
            </plugin>
            <plugin>
                <groupId>org.apache.maven.plugins</groupId>
                <artifactId>maven-dependency-plugin</artifactId>
                <executions>
                    <execution>
                        <id>copy-dependencies</id>
                        <phase>prepare-package</phase>
                        <goals>
                            <goal>copy-dependencies</goal>
                        </goals>
                        <configuration>
                            <outputDirectory>${project.build.directory}/jmeter/lib</outputDirectory>
                            <overWriteReleases>false</overWriteReleases>
                            <overWriteSnapshots>false</overWriteSnapshots>
                            <overWriteIfNewer>true</overWriteIfNewer>
                        </configuration>
                    </execution>
                </executions>
            </plugin>
            <plugin>
                <groupId>org.apache.maven.plugins</groupId>
                <artifactId>maven-jar-plugin</artifactId>
                <configuration>
                    <archive>
                        <manifest>
                            <addClasspath>true</addClasspath>
                            <classpathPrefix>lib/</classpathPrefix>
                            <mainClass>theMainClass</mainClass>
                        </manifest>
                    </archive>
                </configuration>
            </plugin>
        </plugins>
        <defaultGoal>clean</defaultGoal>
    </build>
</project>
Problem handling
1. Processing of custom jar package
If there is a custom jar package written by yourself in the project, you should pay attention to it when referring to maven's pom file. As we all know, when referring to a third-party jar package or a custom jar package in a JMeter project, you need to place the jar package in the lib/ext directory of JMeter.
If the jar can be found in maven's central warehouse, you can directly refer to the instructions on referencing third-party jar packages in the wiki in maven's jmeter plug-in. However, if it is a jar package written by yourself, since it is not in maven's central warehouse, the following operations need to be added to enable maven to successfully find the jar package during build:
1.1 import from local warehouse
(1) You must first install the jar package in the local warehouse through the install command. The command format is as follows:
mvn install:install-file -Dfile=[path-of-jar] -DgroupId=[path-in-local-repository] -DartifactId=[foldername] -Dversion=[versionname] -Dpackaging=jar
After this installation, maven will automatically generate COM / functions / JMeter / functions / 1.0 in the local warehouse 2 / path, and set functions - 1.0 2. Jar is placed under this path for maven to reference.
After the jar package is installed in the local warehouse, we will install it in pom.com The following configuration is added to XML to make maven automatically reference the jar package and put it in the lib/ext directory of jmeter every time it build s.
<jmeterExtensions>
    <artifact>com.functions.jmeter:functions:1.0.2</artifact>
    <artifact>com.json.jmeter:json:1.0.2</artifact>
    <artifact>com.postgresql.jdbc:postgresql:1.0.2</artifact>
</jmeterExtensions>
2. In the test report, the icon is not displayed
Reason: during continuous integration with jenkins, the code is copied to the target project without copying the corresponding icon.
Solution: put the two icon files together in the src/test/resources directory of the project, and then in POM Add the following plug-ins to XML
 <plugin>
                <artifactId>maven-resources-plugin</artifactId>
                <executions>
                    <execution>
                        <id>copy-resources</id>
                        <phase>compile</phase>
                        <goals>
                            <goal>copy-resources</goal>
                        </goals>
                        <configuration>
                            <outputDirectory>${project.build.directory}/jmeter/html</outputDirectory>
                            <resources>
                                <resource>
                                    <directory>${basedir}/src/test/resources</directory>
                                    <filtering>true</filtering>
                                </resource>
                            </resources>
                        </configuration>
                    </execution>
                </executions>
            </plugin>
3 in the test report, MinTime and MaxTime are displayed as NAN
In POM Add configuration in XML:
                <dependencies>
                    <dependency>
                        <groupId>net.sf.saxon</groupId>
                        <artifactId>saxon</artifactId>
                        <version>8.7</version>
                    </dependency>
                </dependencies>
4 Jmeter default report optimization
The Jmeter default report displays less information. If an error occurs, it is difficult to locate it. Therefore, the default report is optimized as follows:
(1) Download the style file: jmeter.results.shanhe.me.xsl
(2) Modify the following part of the jmeter.properties file and change the following parameters to true, so that these results will be saved to the. jtl file after executing the script. The modified jmeter.properties are placed in the path: src/test/jmeter.
jmeter.save.saveservice.data_type=true
jmeter.save.saveservice.label=true
jmeter.save.saveservice.response_code=true
# response_data is not currently supported for CSV output
jmeter.save.saveservice.response_data=true
# Save ResponseData for failed samples
jmeter.save.saveservice.response_data.on_error=false
jmeter.save.saveservice.response_message=true
jmeter.save.saveservice.successful=true
jmeter.save.saveservice.thread_name=true
jmeter.save.saveservice.time=true
jmeter.save.saveservice.subresults=true
jmeter.save.saveservice.assertions=true
jmeter.save.saveservice.latency=true
jmeter.save.saveservice.connect_time=true
jmeter.save.saveservice.samplerData=true
jmeter.save.saveservice.responseHeaders=true
jmeter.save.saveservice.requestHeaders=true
jmeter.save.saveservice.encoding=false
jmeter.save.saveservice.bytes=true
jmeter.save.saveservice.url=true
jmeter.save.saveservice.filename=true
jmeter.save.saveservice.hostname=true
jmeter.save.saveservice.thread_counts=true
jmeter.save.saveservice.sample_count=true
jmeter.save.saveservice.idle_time=true
In POM XML add configuration
Jmeter uses custom profiles:
<configuration>
    <propertiesJMeter>
        <log_level.jmeter>DEBUG</log_level.jmeter>
    </propertiesJMeter>
</configuration>
The node name under the propertiesJMeter node corresponds to JMeter Properties, that is, modify JMeter Log in the properties file_ level. The attribute of JMeter is DEBUG.
For more advanced Jmeter applications, please refer to:
https://github.com/jmeter-maven-plugin/jmeter-maven-plugin/blob/master/CHANGELOG.md
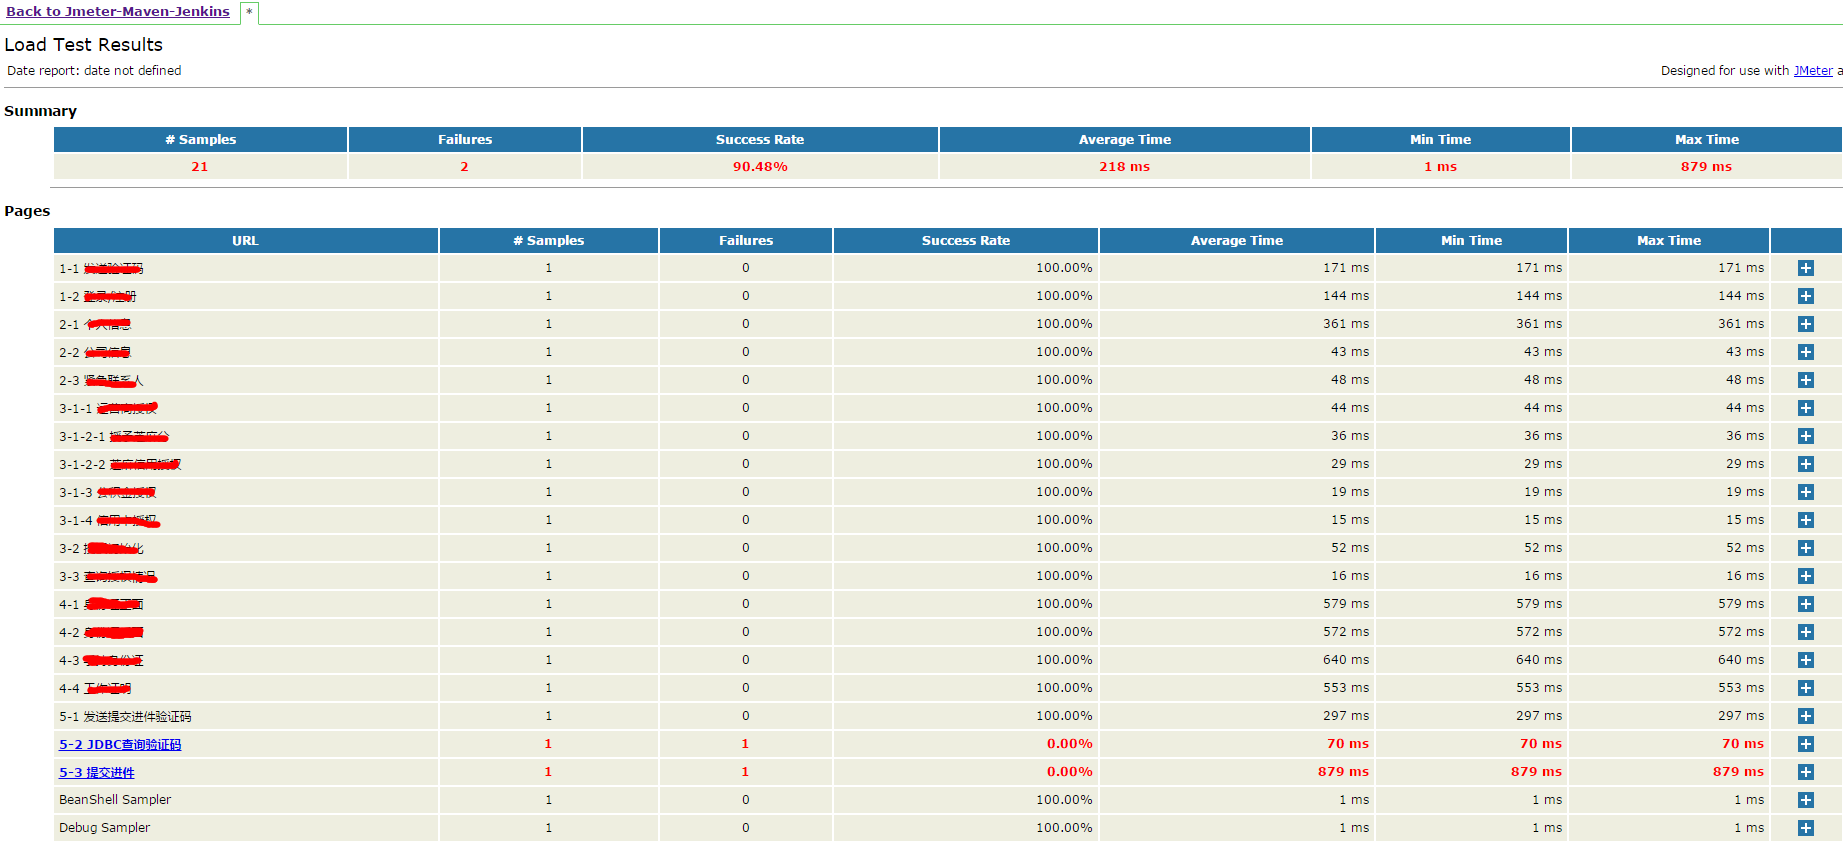
(4) Execute the script and generate the following report. The optimized HTML report contains interface address, interface parameters, Headers information (including cookie s and session s), and the returned results. The failure reason is clear at a glance
5 parametric file
If you don't know the running directory of Jmeter in Maven project, you can add BeanShell Sampler in Jmeter script, print out the execution path, and then configure it
vars.put("AutoTestPath",System.getProperty("user.dir"));
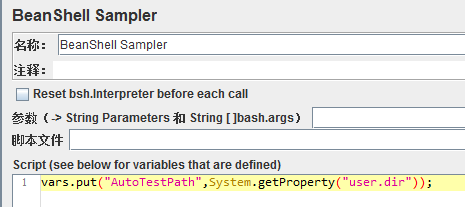
The execution result is: in target/jmeter/bin
IV Jenkins and plug-in installation
1. Download and install jenkins, which will not be described in detail here.
2. After Jenkins is installed, start Jenkins locally and enter the plug-in management interface. It needs to be configured because it is blocked in China. Enter in system management - > management plug-in - > Advanced - > upgrade site: http://updates.jenkins-ci.org/update-center.json After submitting and saving, enter in the address field http://localhost:8080/restart Restart and enter the plug-in management interface again. At this time, there will be content in the optional plug-in interface
3. Plug ins to install
Maven Integration plugin : Maven plug-in unit
Performance plugin: Performance report plug-in
HTML Publisher plugin : HTTP report plug-in unit
Git plugin : GIT plug-in unit
Build a maven project
1. After the plug-in is installed, you can create a new project. Here, we choose to build a maven project named JMeter Maven Jenkins
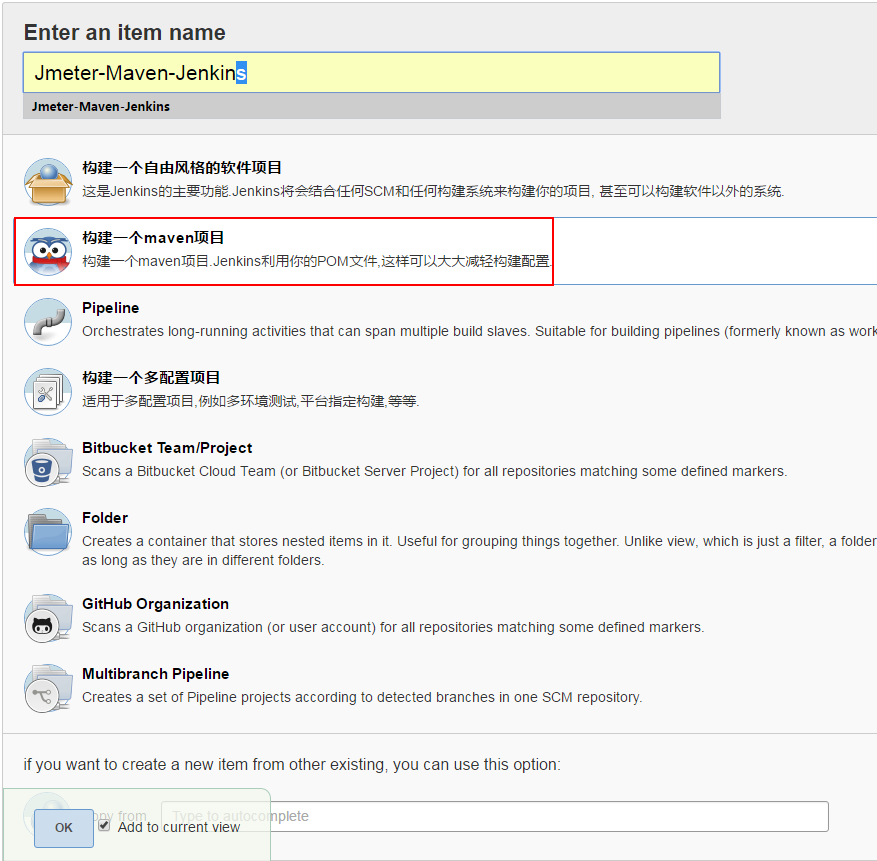
2. Select Git and enter the URL address, user name and password of Git server

3. Enter POM. In the Build option XML file path

4. Add a post build operation, add a Publish HTML reports, html directory to archive is the saving path of the translated html file, index pages is the name of the translated file, and report title is the title displayed in jenkins
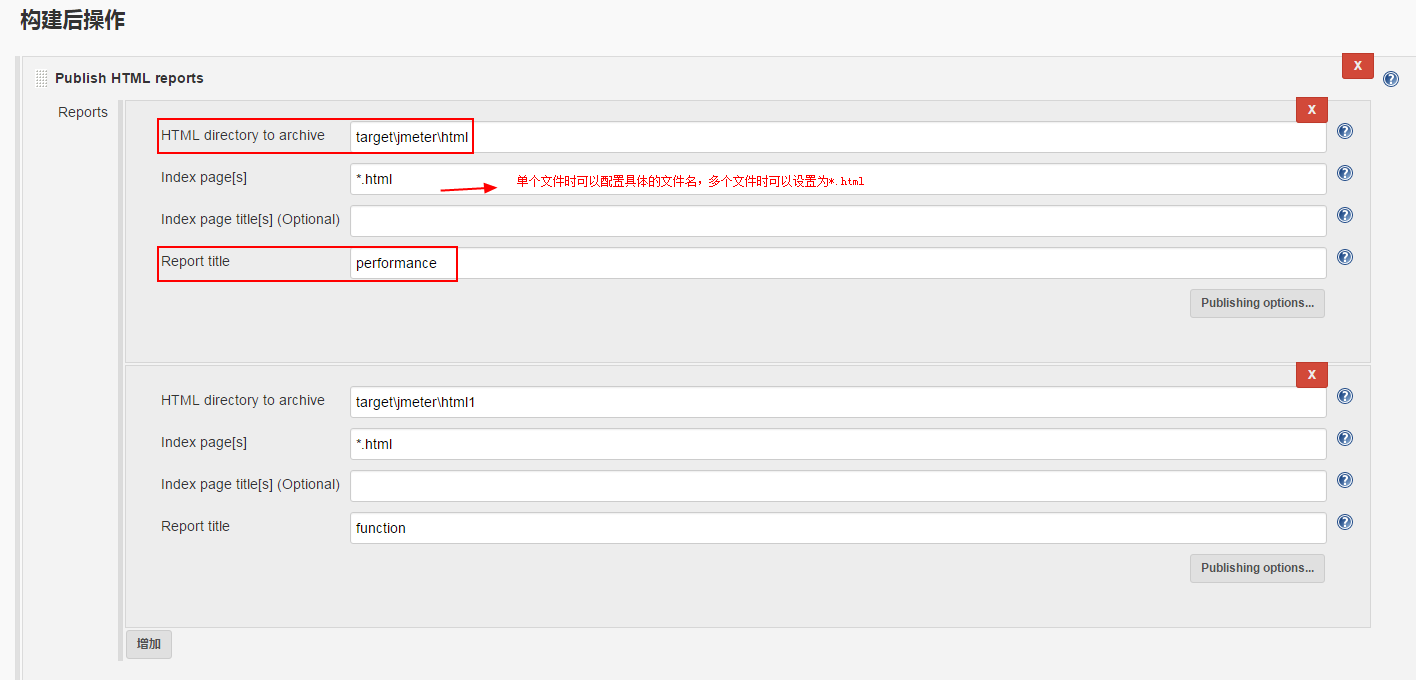
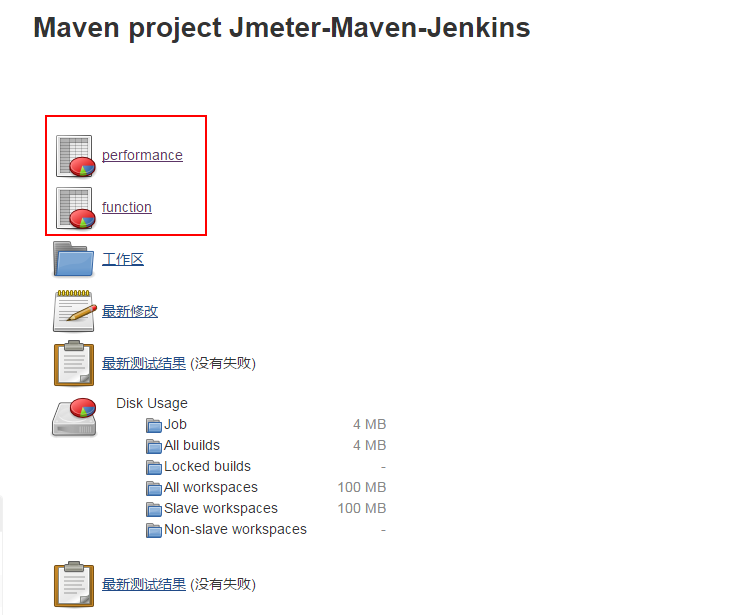
Effect after configuration: you can directly click Jenkins to view the execution results

V. GitLab code update triggers Jenkins automatic construction
1. Install the plug-ins Gitlab Hook Plugin and Build Authorization Token Root Plugin on Jenkins;
2. After installing the plug-in, open a project – > configuration, check "trigger remote build (e.g. using script)" and enter the authentication token (optional)
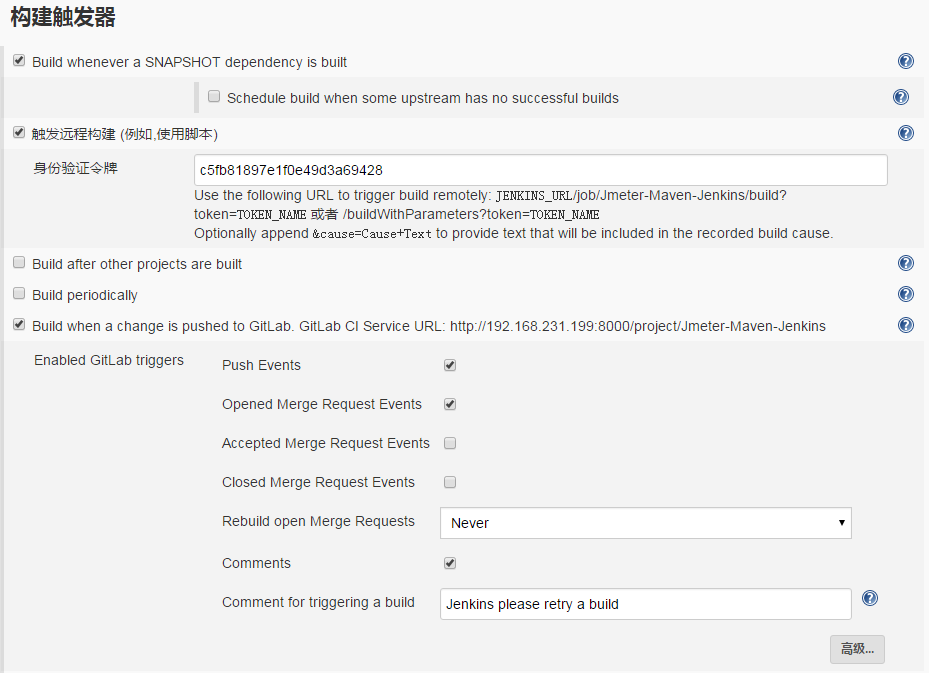
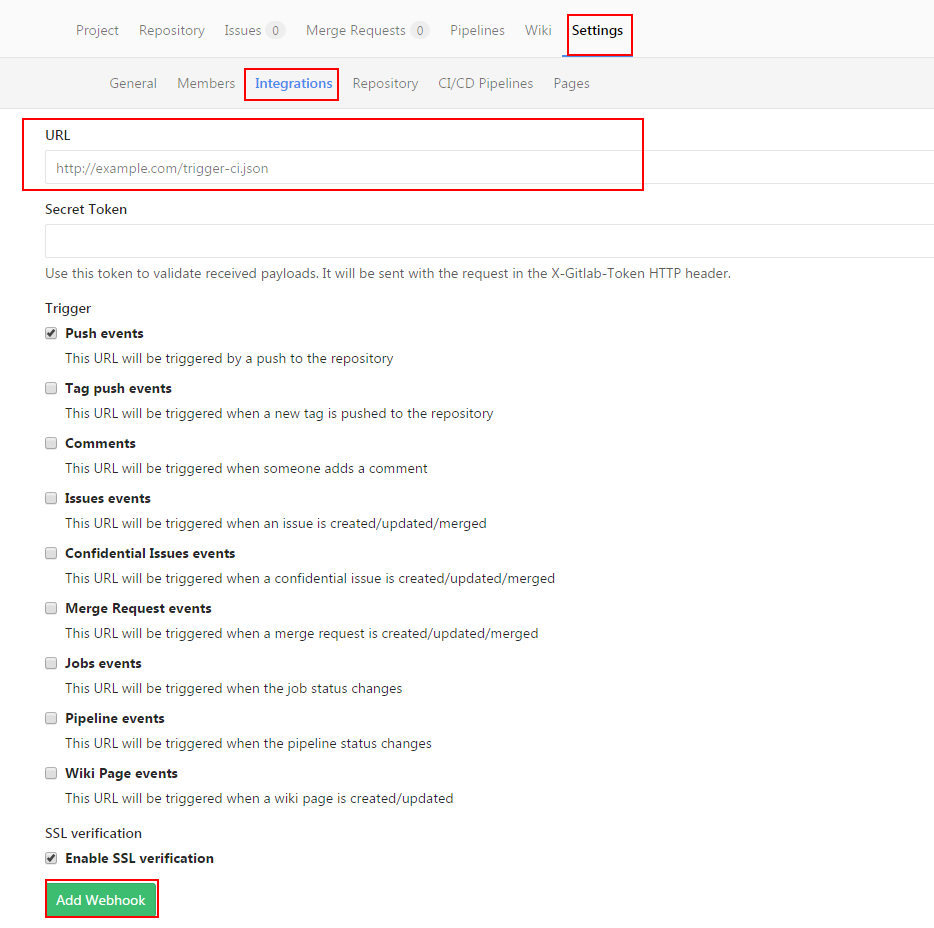
3. Log in to GitLab and set URL in project - > Settings - > integrations - > add webhook. jenkins integration will be triggered automatically. After configuration, click the test button in the lower right corner to test
Update the script based on the environment selected at build time
In pre steps - > Add pre build step - > execute shell
#!/bin/sh
url=ijapi5.wolaidai.com

port=59030

database_ip=192.168.252.102

database_name=rocket2_i2

cd /var/lib/jenkins/workspace/Jmeter-Maven-Jenkins/src/test/jmeter

case "${DEPLOY_ENV}" in

  "gd2a_01")

    ls | grep ".jmx" | while read line

    do

       sed -i "s/${url}/ijapi1.wolaidai.com/g;s/${port}/19030/g;s/${database_ip}/192.168.252.101/g;s/${database_name}/rocket2_i1/g" ${line}

    done

    ;;

  "gd2a_02")

    ls | grep ".jmx" | while read line

    do

       sed -i "s/${url}/ijapi2-gd2a.wolaidai.com/g;s/${port}/29030/g" ${line}

    done

    ;;

  "gd2a_04")

    ls | grep ".jmx" | while read line

    do

       sed -i "s/${url}/ijapi4-gd2a.wolaidai.com/g;s/${port}/49030/g;s/${database_ip}/192.168.252.103/g;s/${database_name}/rocket2/g;" ${line}

    done

    ;;

  *)

    ;;

esac

cd /var/lib/jenkins/workspace/Jmeter-Maven-Jenkins
Note: after the script replacement is completed, remember to switch back to the root directory of the workspace or modify the POM file path configured during Build.
Execution result judgment
1, Cause
The success or failure of Jenkins construction depends on whether the project construction is normal, and it will not be judged that the JMeter script execution result is Pass or Fail. For interface testing, the project construction failure or the interface execution result in JMeter script is Fail
2, Solution ideas
Combined with the ExecuteShell in Jenkins' Post Steps, after the script execution is completed, go to the test report, judge if there is 0.00% in the file, and then judge that the script execution fails, and return 1; otherwise, it is 0, indicating that the construction is successful
if [[ `find /var/lib/jenkins/workspace/Jmeter-Maven-Jenkins/target/jmeter/html -name "*.html"  | xargs grep ">0.00%<"` == "" ]]; then

 echo "testcases were executed successfully"

 exit 0

else

 echo "there are at least one failed testcase"

 exit 1

fi
reference resources: https://blog.csdn.net/qq_27791709/article/details/78224023?spm=1001.2014.3001.5501
https://blog.csdn.net/fengzhen200000/article/details/73187762