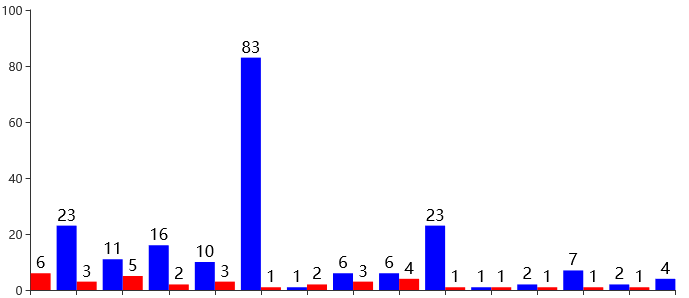
Baidu eCharts dynamic data binding summary
-
Using steps
-
Code demo
-
Effect display
-
Using steps
(1) js plug-in of eCharts (eCharts single file introduction)
There are several ways to introduce the js plug-in of eCharts:
a. directly introduce js plug-in of Baidu ecrats
<script src="http://echarts.baidu.com/build/dist/echarts.js"></script>
b. the plug-in of eCharts.js has been deployed in the project
<script type="text/javascript" src="${url}/echarts.js"></script>
(2) the path to configure ecrats and required charts for the module loader in the new < script > tab (I think it can be omitted)
<script type="text/javascript">
/ / path configuration requires. Config ({paths: {eckarts: 'http://eckarts.baidu.com/build/dist'});
</script>
(3) when the < script > tag dynamically loads ecrats and required charts, and dynamically binds data
-
Code demonstration (foreground code) code
<script src="http://echarts.baidu.com/build/dist/echarts.js"></script> <div id="main"></div> <script type="text/javascript"> var myChart = echarts.init(document.getElementById('main')); myChart.setOption({ title: { text: 'Name of histogram', x:'left' }, tooltip : { trigger: 'axis' }, legend: { data:['Key 1 of histogram','Key 1 of histogram'] }, color:['red','blue'], xAxis: { name:'x Axis name', data: [] //Data on the x axis }, yAxis: { splitLine: { show: false },//Remove gridlines name: 'Y Axis name' }, series: [{ barWidth: "20px", name: 'Mouse prompt name', type: 'bar', itemStyle: { normal: { label: { show: true, //Turn on display position: 'top', //Show above textStyle: { //Numerical style color: 'black', fontSize: 16 } } } }, data: [] } ] }); myChart.showLoading(); //Display a simple loading animation before the data is loaded $("#buttonID").click(function () { //Get parameters to be passed to background var x=...; var y=....; var datas={ "x":x, "y":y }; myChart.showLoading(); //Display a simple loading animation before the data is loaded $.ajax({ type: 'POST', url : "url",//Address of request data data:datas, dataType: "json", //Return data in the form of json success: function (result) { //Get the data returned from the background in json format var xx=[]; var yy=[]; xx=result.x Shaft data; yy=result.y Shaft data; myChart.setOption({ //Load data chart xAxis: { data: xx //['','',''] }, series: [{ // Corresponding series according to name name:'y axis', type: 'bar', data: yy } ] }); error: function (errorMsg) { //Execute this function when the request fails alert("Chart request data failed!"); myChart.hideLoading(); } }); }); </script> -
Effect display
