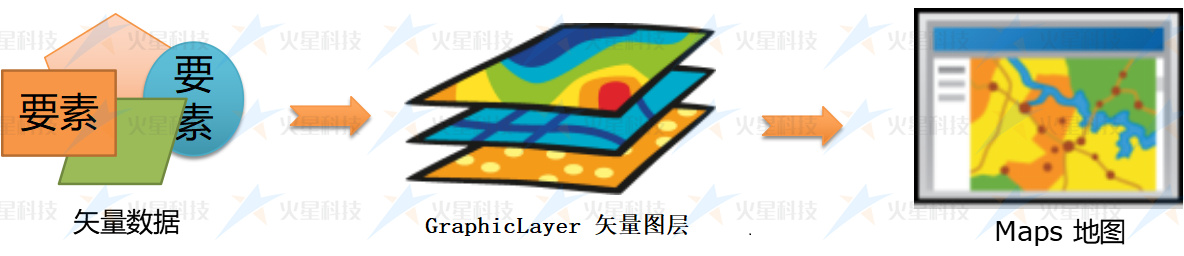
In 3D scene, terrain and grid form the basis of 3D, but more businesses still need vector data such as point, line and surface to enrich, which is our vector data layer.
# 1. List of layer types
The vector layer currently used mainly refers to GraphicLayer Class and its subclass objects. Vector layer can be added by addGraphic method Various types of Vector data To form.

The following types of vector layers are commonly used:
| Type type name | Layer description | Corresponding layer class | remarks |
|---|---|---|---|
| graphic | Vector data layer | mars3d.layer.GraphicLayer | |
| geojson | GeoJSON layer | mars3d.layer.GeoJsonLayer | |
| model | gltf small model layer | mars3d.layer.ModelLayer | |
| lodGraphic | LOD layered and block loading vector layer | mars3d.layer.LodGraphicLayer | |
| wfs | OGC WFS layer | mars3d.layer.WfsLayer | |
| arcgis_wfs | ArcGIS WFS layer | mars3d.layer.ArcGisWfsLayer |
# 2. Creation and use of vector layer
# 2.1 quick start (passed in when initializing new Map)
When constructing a Map, configure relevant layers in the layers parameter and set show:true to initialize and load vector layers
var map = new mars3d.Map('mars3dContainer', {
 layers: [
   {
     "id":1987,
     "type": "geojson",
     "name": "Sample data",
     "url": "http://data.mars3d.cn/file/geojson/geojson-draw.json",
     "popup": "{name}",
     "show": false
   }
 ]
})
//The configured layer can be obtained by the following method
let tiles3dLayer = map.getLayer(1987,'id')
# 2.2 creating layers in code
There are 2 ways to create layer objects:
//Using the factory method, specify the type to create the layer object
var wfsLayer = mars3d.LayerUtil.create({
 name: 'Hefei education point',
 type: 'wfs',
 url: 'http://server.mars3d.cn/geoserver/mars/wfs',
 layer: 'mars:hfjy',
 parameters: {
   maxFeatures: 500,
 },
 minimumLevel: 13,
 symbol: {
   type: 'billboardP',
   styleOptions: {
     image: 'img/marker/mark1.jpg',
     verticalOrigin: Cesium.VerticalOrigin.BOTTOM,
     clampToGround: true,
   },
 },
 popup: 'all',
 show: true,
})
map.addLayer(wfsLayer)

//Create specific types of layer objects directly
var geoJsonLayer = new mars3d.layer.GeoJsonLayer({
 name: 'Plot sample data',
 url: 'http://data.mars3d.cn/file/geojson/geojson-draw.json',
 popup: '{type} {name}',
 flyTo: true,
})
map.addLayer(geoJsonLayer)
After the Map is created, you can use the map.addLayer and map.removeLayer Method to control the loading and deletion of layers.
In the layer itself layer.addTo and layer.remove Two methods support adding or removing layers.
# 3 common vector layer classes
#3.1 GraphicLayer
Vector data layer
//Create vector data layer
let graphicLayer = new mars3d.layer.GraphicLayer()
map.addLayer(graphicLayer)

//Load data to vector layer
let graphic = new mars3d.graphic.LabelEntity({
  position: new mars3d.LatLngPoint(116.1, 31.0, 1000),
  style: {
    text: 'Mars3D 3D visualization platform',
    font_size: 25,
    color: '#003da6',
  },
})
graphicLayer.addGraphic(graphic)
Operation effect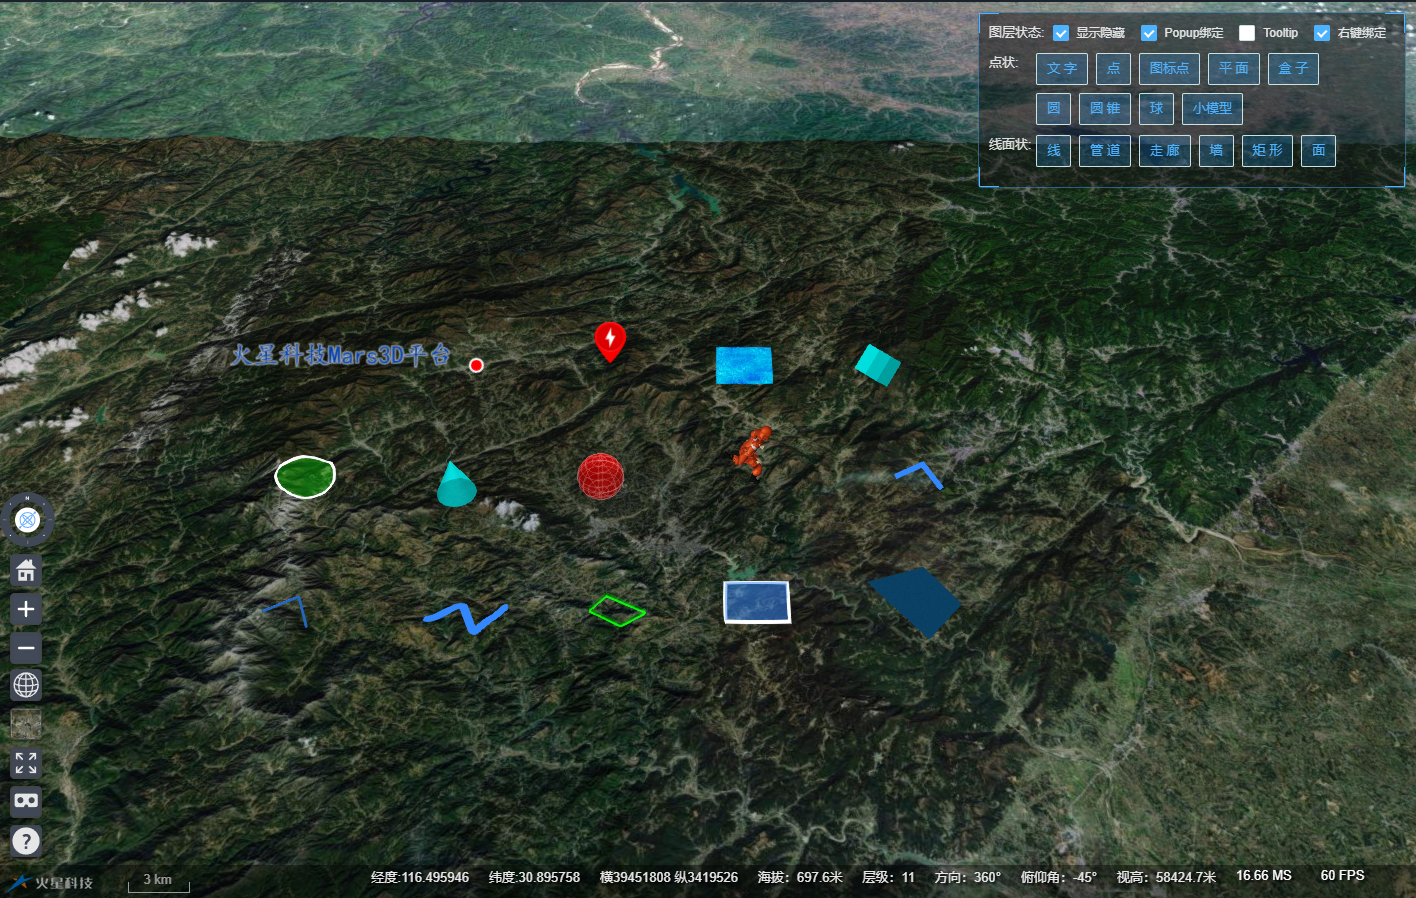
#3.2 GeoJsonLayer
GeoJSON is a format suitable for encoding various geographic data structures on the Web, and a geospatial information data exchange format based on Javascript object representation. The difference between json file format and ordinary json file format is that its properties and composition are regulated by certain specifications.
GeoJSON divides all geographic elements into Point, MultiPoint, LineString, MultiLineString, Polygon, MultiPolygon and GeometryCollection. First, these elements are encapsulated into a single geometry, and then they are used as features one by one; the elements are put into a Feature collection.
GeoJSON is a very important data format of the platform. At present, vector data in the platform supports exporting GeoJSON and importing GeoJSON format.
let geoJsonLayer = new mars3d.layer.GeoJsonLayer({
  name: 'Provincial Boundary',
  url: 'http://data.mars3d.cn/file/geojson/sheng-line.json',
  symbol: {//You can specify the vector data type and style of rendering by configuring the symbol parameter.
    type:"polyline",
    styleOptions: {
      color: '#ffffff',
      opacity: 0.8,
      width: 2
    },
  },
})
map.addLayer(geoJsonLayer)
Common geojson related websites:
- Generate GeoJSON online: geojson.io
- SHP to GeoJSON: mapshaper
- China administrative division GeoJSON Download: Alibaba cloud DataV - data visualization platform
# 3.1 WFS layer
Platform support through WfsLayer class To load OGC WFS (such as GeoServer) services and ArcGisWfsLayer class To load the vector data published by ArcGIS Server service.
//OGC WFS
var wfsLayer = new mars3d.layer.WfsLayer({
    name: 'Hefei education point',
    url: 'http://server.mars3d.cn/geoserver/mars/wfs',
    layer: 'mars:hfjy',
    parameters: {
      maxFeatures: 500, //All wfs parameters are supported
    },
    minimumLevel: 13,
    debuggerTileInfo: false,
    symbol: {//You can specify the vector data type and style of rendering by configuring the symbol parameter.
      type: 'billboardP',
      styleOptions: {
        image: 'img/marker/mark1.jpg',
        verticalOrigin: Cesium.VerticalOrigin.BOTTOM,
        clampToGround: true,
      },
    },
    popup: 'all',
})
map.addLayer(wfsLayer)


//ArcGIS WFS
var wfsLayer = new mars3d.layer.ArcGisWfsLayer({
  name: 'Points of interest',
  url: 'http://server.mars3d.cn/arcgis/rest/services/mars/hefei/MapServer/1',
  minimumLevel: 16,
    symbol: {//You can specify the vector data type and style of rendering by configuring the symbol parameter.
    type: 'billboardP',
    styleOptions: {
      image: 'img/marker/mark3.jpg',
      verticalOrigin: Cesium.VerticalOrigin.BOTTOM,
      clampToGround: true,
    },
  },
  popup: 'name:{NAME}<br />Address:{address}',
  show: true,
})
map.addLayer(wfsLayer)
You can specify the vector data type and style of rendering by configuring the symbol parameter.
# 2.4 graphicGroup vector layer group
At present, the platform provides the of type:'graphicGroup' GraphicGroupLayer class Type layer can be used for multi-layer plotting control and management of plotting on the drawing. For details, refer to the basic project Plot on the drawing Function.