Beginning Chinese Web Top 20 Books Crawling System
Background of one topic
With the rise of online fiction, more and more people are addicted to it. Good fiction makes people grow up and enjoy reading.
However, because there are so many stories, it is even more difficult to find a good one, so I set up this topic
Second Design
1. Thematic Web Crawler Name
Beginning Top 20 Books Crawling System for Chinese Websites
2. Analysis of crawling content and data characteristics of thematic web crawlers
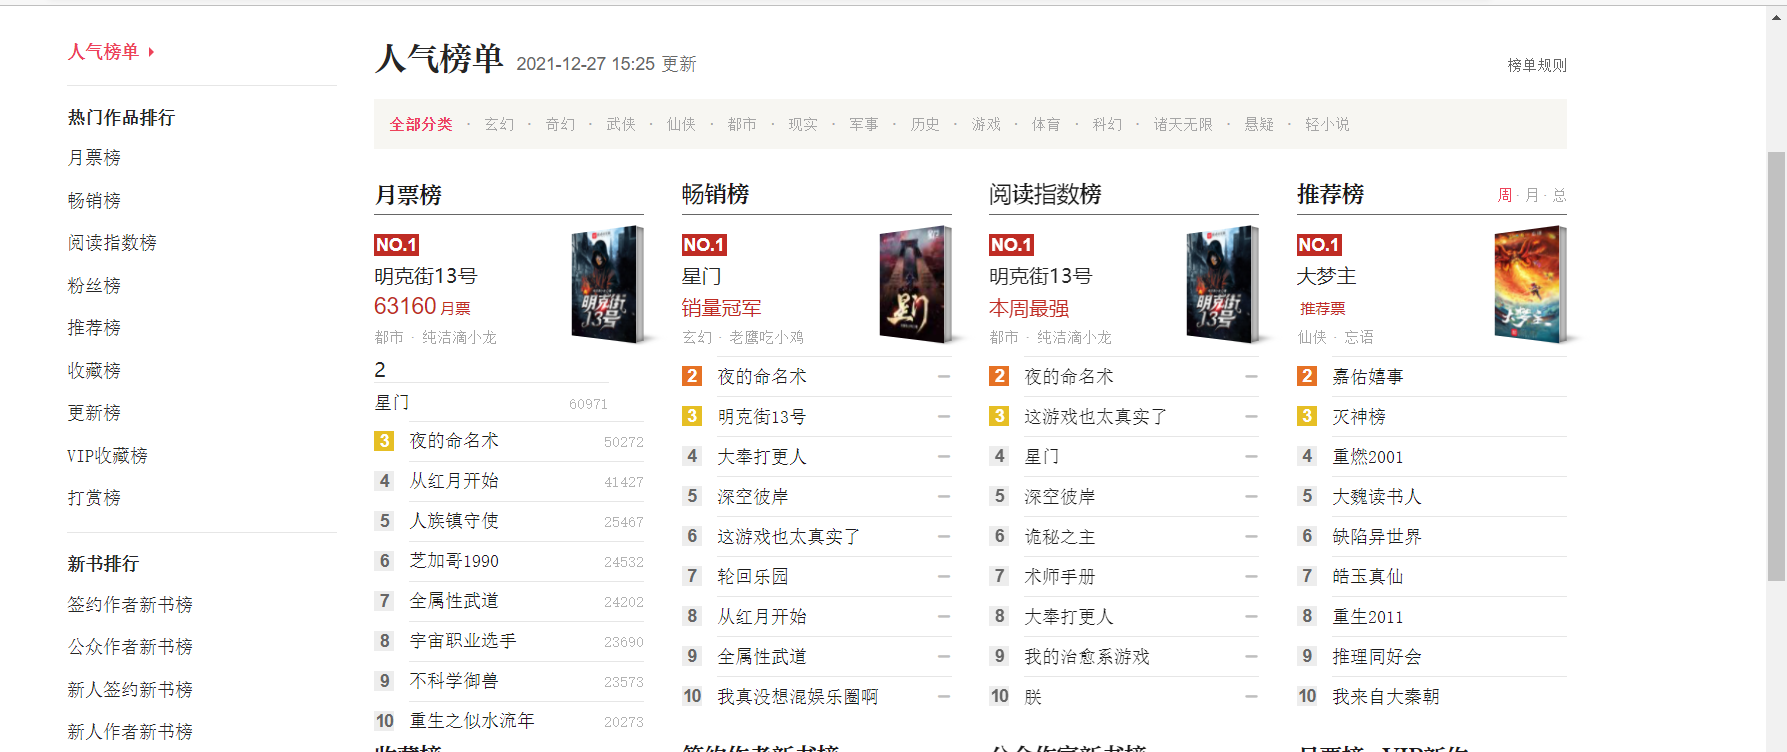
Crawl the titles, rankings, authors, etc. of the top 20 books on each list
And do analysis
3. Overview of design scheme of thematic crawler (including implementation ideas and technical difficulties)
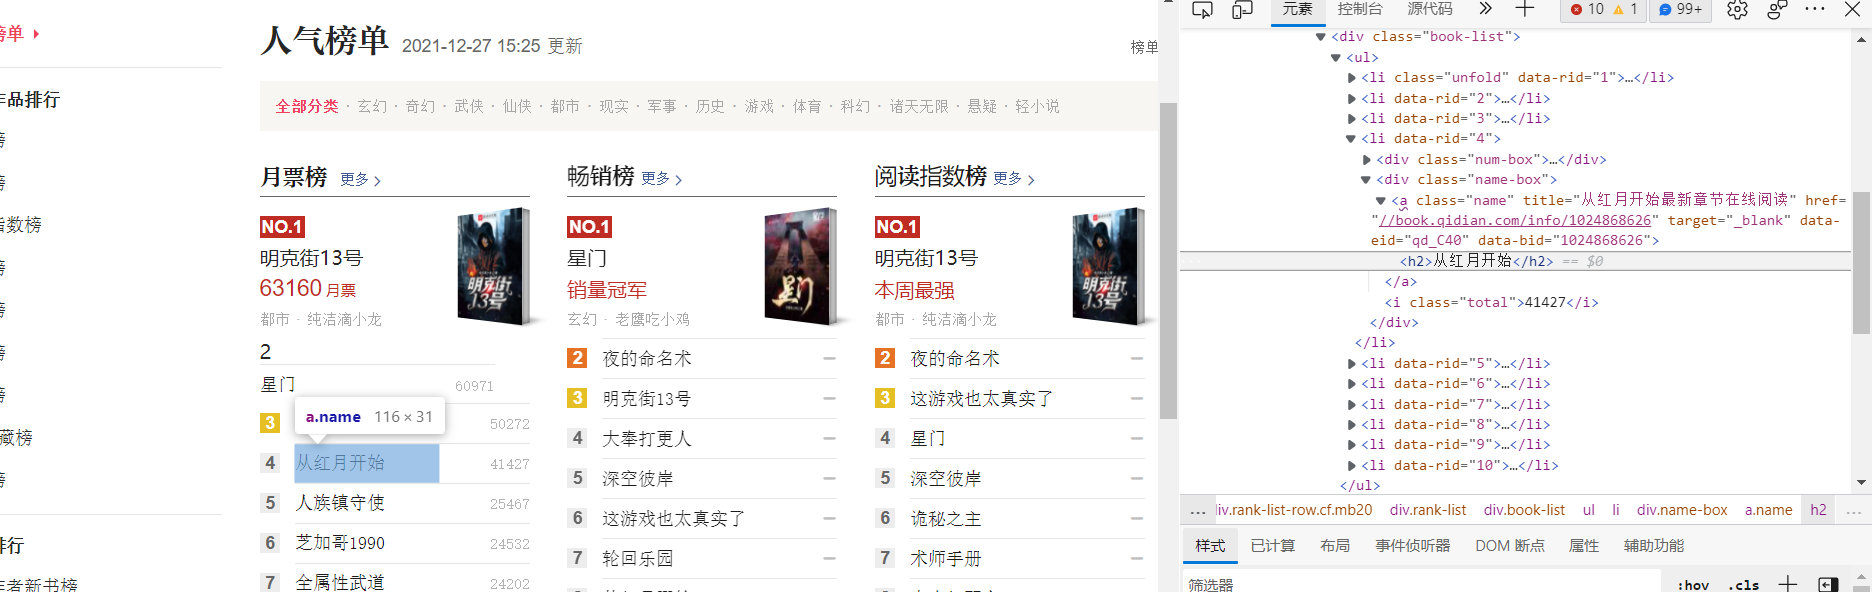
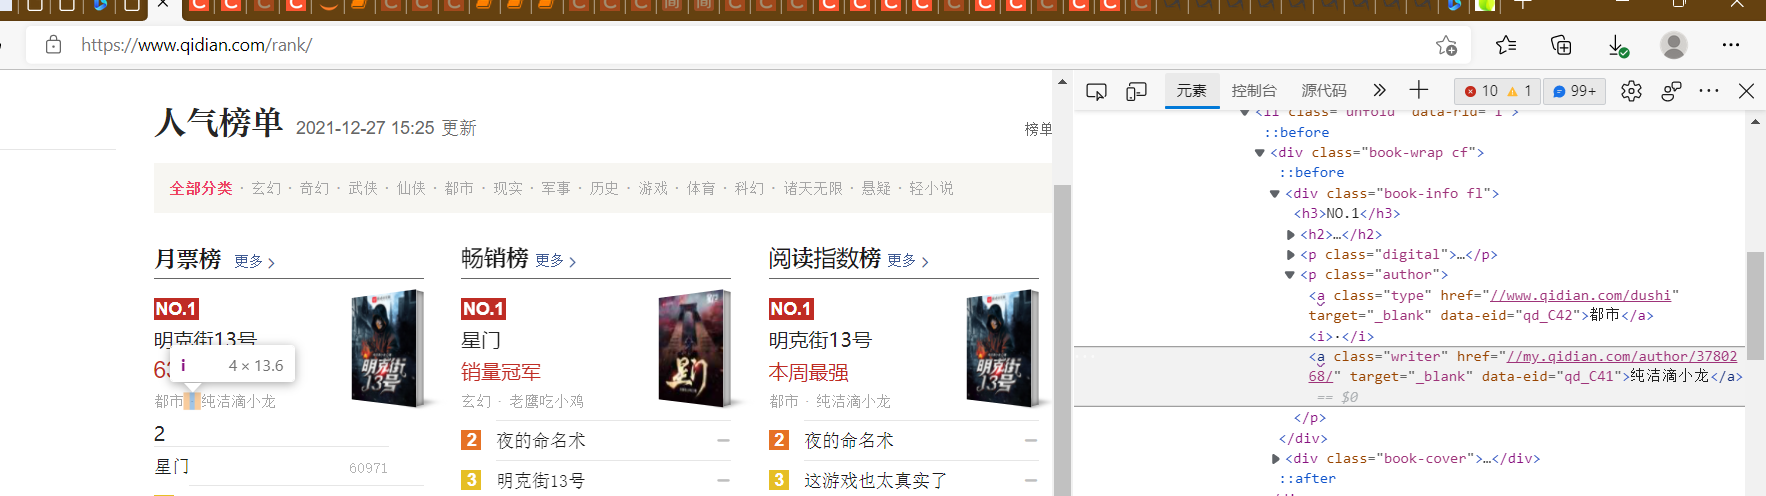
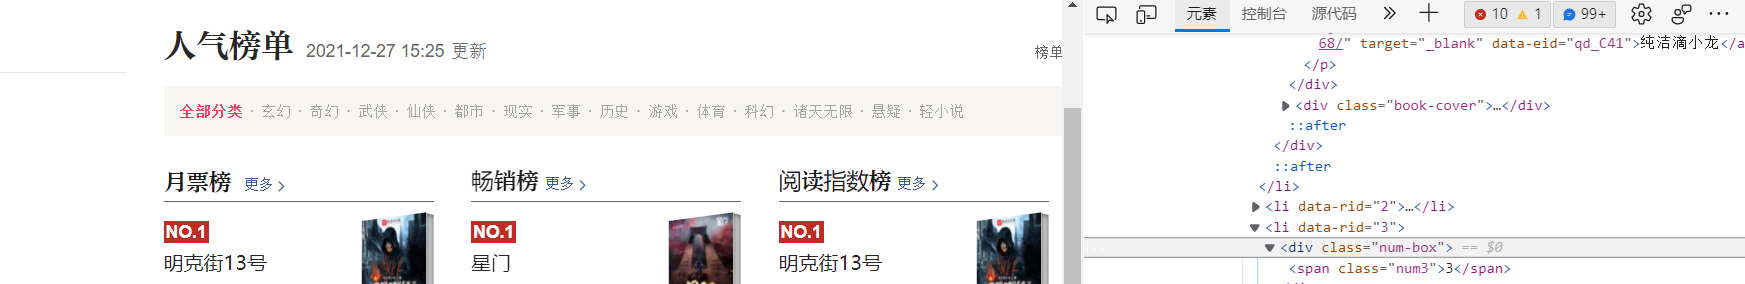
1. View the structure of the web page in developer mode and the location of what you want to crawl
2. Make a selection interface with a simple input function
3. Storing data: using open(),WRITE(), etc.
3. Implementation steps and code
1. Crawler Design
(1) Theme Page Structure and Feature Analysis
(2) html page parsing
Title:
Type:
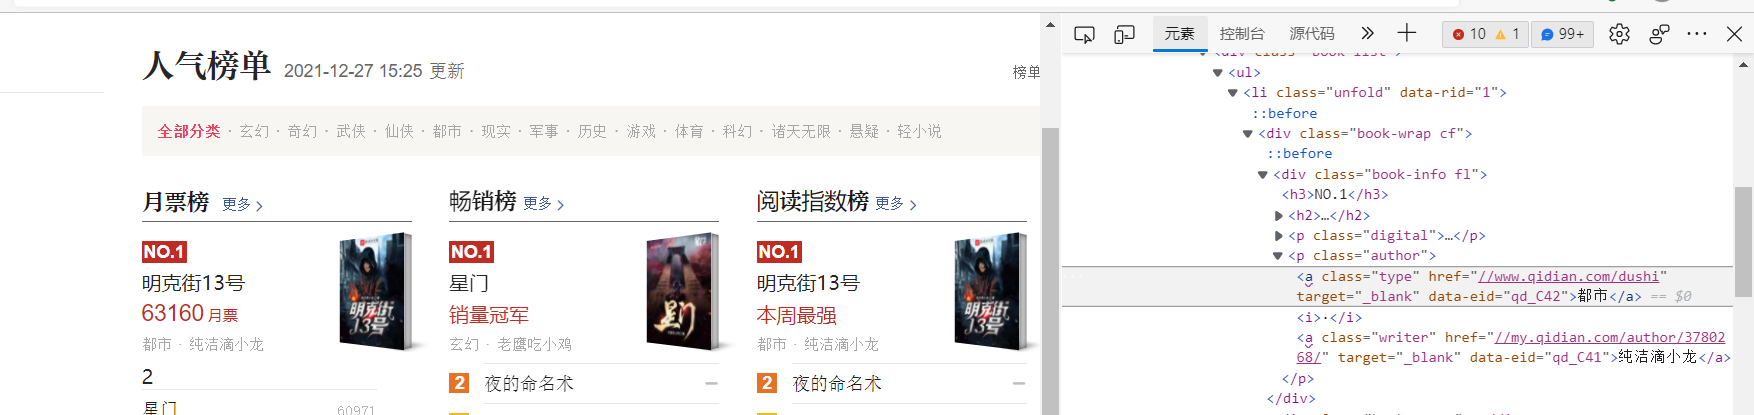
Author:
Rank:
(3) Node finding methods and traversal
from bs4 import BeautifulSoup
import pandas as pd
import numpy
import re
import requests
import xlwt
import csv
urllist=['https://www.qidian.com/rank/yuepiao/','https://www.qidian.com/rank/hotsales/','https://www.qidian.com/rank/readindex/','https://www.qidian.com/rank/newfans/','https://www.qidian.com/rank/recom/','https://www.qidian.com/rank/collect/','https://www.qidian.com/rank/vipup/','https://www.qidian.com/rank/vipcollect/','https://www.qidian.com/rank/vipreward/']
choice=int(input('Please select the list you want to view:1,Monthly Ticket List 2, Best Sales List 3, Reading Index List 4, Fan List 5, Recommendation List 6, Collection List, 7, Update List 8, VIP Favorites List 9, Appreciation List:'))
url=urllist[choice-1]
r=requests.get(url,timeout=30,)
r.raise_for_status()
r.encoding='utf_8'
html=r.text
soup=BeautifulSoup(html,'html.parser')
body=soup.body
data=body.find('div',{'class':'rank-body'})
Title=data.find_all('div')[1].find_all("h2")
brief introduction=data.find_all('div')[1].find_all('p',{'class':'intro'})
To update=data.find_all('div')[1].find_all('p',{'class':'update'})
i=0
for i in range(len(Title)):
    print(Title[i].text)
    print(brief introduction[i].text)
    print(To update[i].text)
(4) Operation display

2. Data Persistence and Demonstration
from bs4 import BeautifulSoup
import pandas as pd
import numpy
import re
import requests
import xlwt
import csv
f = open("Total data.csv",mode="w",encoding="utf-8",newline='')
csvwriter = csv.writer(f)v
def savedata(url):
    r=requests.get(url,timeout=30,)
    r.raise_for_status()
    r.encoding='utf_8'
    html=r.text
    soup=BeautifulSoup(html,'html.parser')
    body=soup.body
    data=body.find('div',{'class':'rank-body'})
    Title=data.find_all('div')[1].find_all("h2")
    brief introduction=data.find_all('div')[1].find_all('p',{'class':'intro'})
    To update=data.find_all('div')[1].find_all('p',{'class':'update'})
    type=data.find_all('div')[1].find_all('a',{'data-eid':'qd_C42'})
    for i in range(len(Title)):
        Rank=i+1
        csvwriter.writerow([Title[i].text,brief introduction[i].text,To update[i].text,type[i].text,Rank])
def main():
    urllist=['https://www.qidian.com/rank/yuepiao/','https://www.qidian.com/rank/hotsales/','https://www.qidian.com/rank/readindex/','https://www.qidian.com/rank/newfans/','https://www.qidian.com/rank/recom/','https://www.qidian.com/rank/collect/','https://www.qidian.com/rank/vipup/','https://www.qidian.com/rank/vipcollect/','https://www.qidian.com/rank/vipreward/']
    for i in range(0,9):
        url=urllist[i]
        savedata(url)
if __name__ == '__main__':
    main()
    f.close()

3. Data Visualization
import matplotlib.pyplot as plt
plt.rcParams['font.sans-serif'] = ['SimHei']
plt.rcParams['axes.unicode_minus'] = False
df=pd.read_csv('D:/Total Data Table 1.csv',header=None,names=['Title','brief introduction','To update','type','Rank'])
t=df['type'].value_counts()
#Output a histogram
t.plot(kind='bar',color=['r','g','b'])
#Make a histogram of the number of times the book appears in nine lists
import matplotlib.pyplot as plt
plt.rcParams['font.sans-serif'] = ['SimHei']
plt.rcParams['axes.unicode_minus'] = False
h=df['Title'].value_counts()
h.plot(kind='bar',color=['r','g','b'])
#Because there are too many books to read clearly, do another picture in the first 40 here
h1=h.head(40)
h1.plot(kind='bar',color=['r','g','b'])
#Updates of the number of occurrences of output books and their types
import pandas as pd
import matplotlib.pyplot as plt
import matplotlib
import numpy as np
x=t.head(10)
y=h.head(10)
plt.figure
size=60
plt.ylabel('type')
plt.xlabel('book')
plt.scatter(x,y,size,color='g',label='relationship')
plt.legend(loc=2)
plt.plot(x,y,color='r')
plt.grid()
plt.show()
# Draw Word Cloud,Look at the words that come up most
import jieba
from pylab import *
from wordcloud import WordCloud
text = ''
for line in df['Title']:
    text += line
# Use jieba Module splits a string into a list of words
cut_text = ' '.join(jieba.cut(text))
color_mask = imread('D:/Book.jpg')  #Set Background Map
cloud = WordCloud(
    background_color = 'white',
    # Font must be specified for Chinese operations
    font_path='C:\Windows\Fonts\simkai.ttf',
    mask = color_mask,
    max_words = 50,
    max_font_size = 200
    ).generate(cut_text)

# Save Word Cloud Picture
cloud.to_file('qzword1cloud.jpg')
plt.imshow(cloud)
plt.axis('off')
plt.show()


(4) Summary
1. What conclusions can you draw from the analysis and visualization of the subject data? Are you meeting your expected goals?
From data analysis and visualization, we can see that book popularity has a certain relationship with their kind
Among them, fantasy is the most popular and I am very satisfied that I can complete this job independently
2. What are the benefits of completing this design? And suggestions for improvement?
No successful crawl to rank, but customize the rank by other means because access is top to bottom
So rankings are correctly written using traversal.
Improvement: Make more visualizations and understand what they mean