Introduction: in real enterprise production, students of R & D and operation and maintenance will face a very complex and difficult problem, that is, monitoring and alarm of indicators. Specifically, I will enumerate some specific problems. Please take your seat according to the number and see if you can solve them together through computing power and algorithm in the era of computing power explosion!
Background introduction
In real enterprise production, students of R & D and operation and maintenance will face a very complex and difficult problem, that is, the monitoring and alarm of indicators. Specifically, I will enumerate some specific problems. Please take your seat according to the number and see if you can solve them together through computing power and algorithm in the era of computing power explosion!
- Question 1: before a new service goes online, the operation and maintenance personnel need to clarify the deployment of the service, determine the monitoring object and some observability indicators of the monitoring object, and complete the collection and processing of relevant log data according to this; This will involve a lot of dirty work such as log collection and index processing;
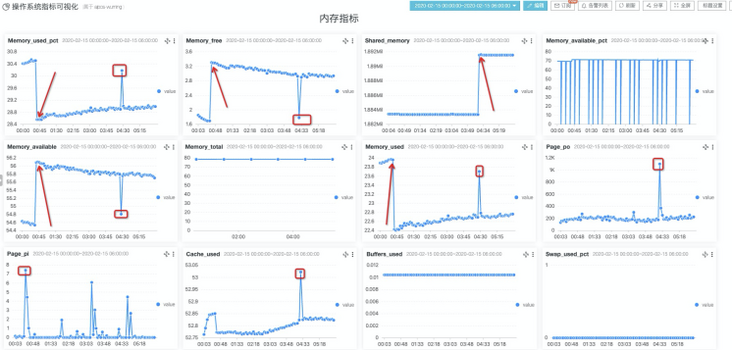
- Problem 2: after determining the gold index of the monitoring object, it is often necessary to adapt a set of rules: the average request delay per minute of an interface should not exceed how many milliseconds; The number of wrong requests per minute, which should not exceed, etc; As shown in the above figure, from the perspective of the operating system, each individual has hundreds of indicators in different forms, and the forms of cutting indicators are different. How many rules can better cover the above monitoring;
- Question 3: with the gradual provision of services and the promotion of various operation activities, our operation and maintenance monitoring students will face two prominent problems: the risk of too many false positives and missing positives. At this stage, both these two problems need manual intervention to adjust the threshold; Especially for the problem of missing reports, it is more necessary to manually stare at the screen and design new monitoring rules to cover some events;
With the improvement of SLA requirements of various cloud services, enterprise services also need to continuously provide the accuracy and speed of problem discovery. In this regard, automated active patrol monitoring and second level monitoring are paid more and more attention by customers. SLS provides an efficient storage format for indicator data and is fully compatible with the timing data of Prometheus protocol. In this scenario, it provides intelligent patrol inspection for massive indicator lines, so that you can lose the complex rule configuration and realize general exception detection through simple selection.
Introduction to sequential storage
SLS's log storage engine was released in 2016. At present, it undertakes log data storage in Alibaba and many enterprises, and dozens of PB of log data are written every day. A large part of them are time series data or used to calculate time series indicators. In order to enable users to complete the data access, cleaning, processing, extraction, storage, visualization, monitoring, problem analysis and other processes of the whole DevOps life cycle in one stop, we have specially launched the function of time series storage, Work with log storage to solve the storage problems of various machine data.
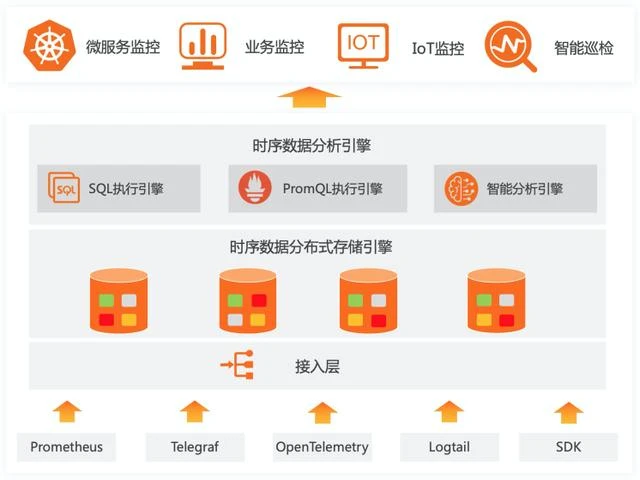
In the SLS platform, you can simply write host monitoring data and Prometheus monitoring data directly through Logtail. At the same time, it also has the ability to import multiple data sources (Alibaba cloud monitoring data). This chapter mainly explains how to connect the SLS intelligent timing patrol capability with ECS machine data and Alibaba cloud monitoring data.
Introduction to intelligent anomaly analysis
Intelligent anomaly analysis application is a managed, highly available and scalable service, which mainly provides three capabilities: intelligent patrol inspection, text analysis and root cause diagnosis. This paper introduces the product architecture, functional advantages, applicable scenarios, core terms, use restrictions and cost description of intelligent anomaly analysis application.
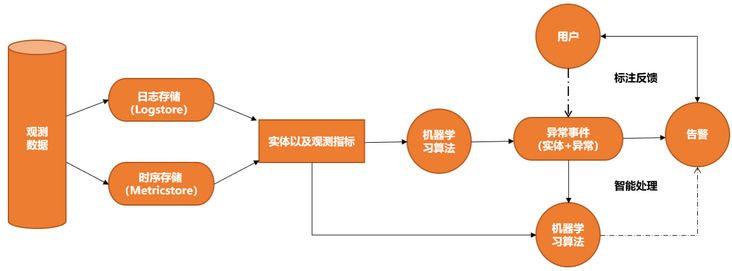
The intelligent anomaly analysis application focuses on the core elements such as monitoring indicators, program logs and service relationships in the operation and maintenance scenario, generates abnormal events by means of machine learning, and analyzes time series data and events through service topology correlation, so as to finally reduce the operation and maintenance complexity of the enterprise and improve the service quality. The product architecture is shown below.
In the following scenarios, the intelligent exception analysis application is recommended.
- There are many observation objects and each observation object has many observation dimensions.
- There is no clear threshold rule for the observation object, but we need to pay attention to the form of the index.
- A large number of business rules need to be written for observation objects.
- When dealing with unstructured log data, it is necessary to mine the patterns in text logs.
Next, let's use the following in the cloud monitoring indicator data scenario
Scene experiment
Intelligent monitoring cloud monitoring indicators
Cloud monitoring data access
adopt Official website document The import task of cloud monitoring can be better configured. After configuration, you can view the corresponding import task according to the following screenshot

You can view the corresponding imported indicators on the SLS console. The names of the corresponding indicators can be referenced This document . We can view the following aggregated data format through the following query statement:
* | select promql_query_range('acs_ecs_dashboard:cpu_system:Average') from metrics limit 100000
Cloud monitoring data preview
Click query page in the upper right corner of the query page to jump to view the specific data format.

* | select __time_nano__ / 1000000 as time, __name__ as metric_name, element_at(__labels__, 'instanceId') as instanceId from "test01.prom" where __name__ != '' and __name__ = 'acs_ecs_dashboard:cpu_system:Average' order by time, instanceId limit 100000
Through this SQL statement, we can analyze it in detail, Specific indicators written into SLS (for a monitoring object, what is the value of an indicator at what time). The above SQL statement only lists the monitoring indicators of all monitoring objects in the time interval from 2021-12-12 19:37 to 2021-12-12 19:38. Next, we rewrite the brief to display only the data form of a single monitoring object in one minute.
* | select date_trunc('second', time) as format, * from ( select __time_nano__ / 1000000 as time, __name__ as metric_name, element_at(__labels__, 'instanceId') as instanceId from "test01.prom" where __name__ != '' and __name__ = 'acs_ecs_dashboard:cpu_system:Average') where instanceId = 'xxxx' order by time limit 100000
We can see that a specific instance has a monitoring indicator every 15 seconds when the monitoring indicator is equal to "acs_ecs_dashboard:cpu_system:Average". However, because we use data import to write the results to the MetricStore of SLS, we write monitoring data every minute, such as one minute.
It should be emphasized here that the SLS side obtains the indicator data of cloud monitoring through OpenAPI. There is a certain delay in importing data into SLS. The specific delay is about 3 minutes, that is, at T0, the data in SLS can only ensure that the data before [T0-300s] can be written on time. This is very important in the subsequent patrol task configuration process.
We simplify the description above through PromQL. We continue to use the corresponding indicator "acs_ecs_dashboard:cpu_system:Average". The expected results can be obtained through the following statements, which is very close to the creation of patrol tasks.
* | select promql_query_range('avg({__name__=~"acs_ecs_dashboard:cpu_system:Average"}) by (instanceId, __name__) ', '15s') from metrics limit 1000000
Screening monitoring indicators
You can roughly know how many monitoring indicators are provided for ECS in cloud monitoring through the following Query:
* | select COUNT(*) as num from ( select DISTINCT __name__ from "test01.prom" where __name__ != '' and __name__ like '%acs_ecs_dashboard%' limit 10000 )
295 results were obtained, but we did not compare all of them. Therefore, the first step is to perform patrol configuration according to Indicator description document Select the indicator items to be monitored. Here I provide a simple sorted out set of important indicators for your reference:
acs_ecs_dashboard:CPUUtilization:Average
acs_ecs_dashboard:DiskReadBPS:Average
acs_ecs_dashboard:DiskReadIOPS:Average
acs_ecs_dashboard:DiskWriteBPS:Average
acs_ecs_dashboard:DiskWriteIOPS:Average
acs_ecs_dashboard:InternetIn:Average
acs_ecs_dashboard:InternetInRate:Average
acs_ecs_dashboard:InternetOut:Average
acs_ecs_dashboard:InternetOutRate:Average
acs_ecs_dashboard:InternetOutRate_Percent:Average
acs_ecs_dashboard:IntranetIn:Average
acs_ecs_dashboard:IntranetInRate:Average
acs_ecs_dashboard:IntranetOut:Average
acs_ecs_dashboard:IntranetOutRate:Average
acs_ecs_dashboard:cpu_idle:Average
acs_ecs_dashboard:cpu_other:Average
acs_ecs_dashboard:cpu_system:Average
acs_ecs_dashboard:cpu_total:Average
acs_ecs_dashboard:cpu_user:Average
acs_ecs_dashboard:cpu_wait:Average
acs_ecs_dashboard:disk_readbytes:Average
acs_ecs_dashboard:disk_readiops:Average
acs_ecs_dashboard:disk_writebytes:Average
acs_ecs_dashboard:disk_writeiops:Average
acs_ecs_dashboard:load_1m:Average
acs_ecs_dashboard:load_5m:Average
acs_ecs_dashboard:memory_actualusedspace:Average
acs_ecs_dashboard:memory_freespace:Average
acs_ecs_dashboard:memory_freeutilization:Average
acs_ecs_dashboard:memory_totalspace:Average
acs_ecs_dashboard:memory_usedspace:Average
acs_ecs_dashboard:memory_usedutilization:Average
acs_ecs_dashboard:net_tcpconnection:Average
acs_ecs_dashboard:networkin_errorpackages:Average
acs_ecs_dashboard:networkin_packages:Average
acs_ecs_dashboard:networkin_rate:Average
acs_ecs_dashboard:networkout_errorpackages:Average
acs_ecs_dashboard:networkout_packages:Average
acs_ecs_dashboard:networkout_rate:Average
According to the above configuration, the corresponding query PromQL is generated as follows:
* | select promql_query_range('avg({__name__=~"acs_ecs_dashboard:CPUUtilization:Average|acs_ecs_dashboard:DiskReadBPS:Average|acs_ecs_dashboard:DiskReadIOPS:Average|acs_ecs_dashboard:DiskWriteBPS:Average|acs_ecs_dashboard:DiskWriteIOPS:Average|acs_ecs_dashboard:InternetIn:Average|acs_ecs_dashboard:InternetInRate:Average|acs_ecs_dashboard:InternetOut:Average|acs_ecs_dashboard:InternetOutRate:Average|acs_ecs_dashboard:InternetOutRate_Percent:Average|acs_ecs_dashboard:IntranetIn:Average|acs_ecs_dashboard:IntranetInRate:Average|acs_ecs_dashboard:IntranetOut:Average|acs_ecs_dashboard:IntranetOutRate:Average|acs_ecs_dashboard:cpu_idle:Average|acs_ecs_dashboard:cpu_other:Average|acs_ecs_dashboard:cpu_system:Average|acs_ecs_dashboard:cpu_total:Average|acs_ecs_dashboard:cpu_user:Average|acs_ecs_dashboard:cpu_wait:Average|acs_ecs_dashboard:disk_readbytes:Average|acs_ecs_dashboard:disk_readiops:Average|acs_ecs_dashboard:disk_writebytes:Average|acs_ecs_dashboard:disk_writeiops:Average|acs_ecs_dashboard:load_1m:Average|acs_ecs_dashboard:load_5m:Average|acs_ecs_dashboard:memory_actualusedspace:Average|acs_ecs_dashboard:memory_freespace:Average|acs_ecs_dashboard:memory_freeutilization:Average|acs_ecs_dashboard:memory_totalspace:Average|acs_ecs_dashboard:memory_usedspace:Average|acs_ecs_dashboard:memory_usedutilization:Average|acs_ecs_dashboard:net_tcpconnection:Average|acs_ecs_dashboard:networkin_errorpackages:Average|acs_ecs_dashboard:networkin_packages:Average|acs_ecs_dashboard:networkin_rate:Average|acs_ecs_dashboard:networkout_errorpackages:Average|acs_ecs_dashboard:networkout_packages:Average|acs_ecs_dashboard:networkout_rate:Average"}) by (instanceId, __name__) ', '1m') from metrics limit 1000000For general scenarios, we can simplify some indicators and directly provide the corresponding PromQL as follows:
* | select promql_query_range('avg({__name__=~"acs_ecs_dashboard:CPUUtilization:Average|acs_ecs_dashboard:DiskReadBPS:Average|acs_ecs_dashboard:DiskReadIOPS:Average|acs_ecs_dashboard:DiskWriteBPS:Average|acs_ecs_dashboard:DiskWriteIOPS:Average|acs_ecs_dashboard:InternetIn:Average|acs_ecs_dashboard:InternetInRate:Average|acs_ecs_dashboard:InternetOut:Average|acs_ecs_dashboard:InternetOutRate:Average|acs_ecs_dashboard:InternetOutRate_Percent:Average|acs_ecs_dashboard:IntranetOut:Average|acs_ecs_dashboard:IntranetOutRate:Average|acs_ecs_dashboard:cpu_idle:Average|acs_ecs_dashboard:cpu_other:Average|acs_ecs_dashboard:cpu_system:Average|acs_ecs_dashboard:cpu_total:Average|acs_ecs_dashboard:cpu_user:Average|acs_ecs_dashboard:cpu_wait:Average|acs_ecs_dashboard:disk_readbytes:Average|acs_ecs_dashboard:disk_readiops:Average|acs_ecs_dashboard:disk_writebytes:Average|acs_ecs_dashboard:disk_writeiops:Average|acs_ecs_dashboard:load_1m:Average|acs_ecs_dashboard:load_5m:Average|acs_ecs_dashboard:memory_freespace:Average|acs_ecs_dashboard:memory_freeutilization:Average|acs_ecs_dashboard:memory_totalspace:Average|acs_ecs_dashboard:memory_usedspace:Average|acs_ecs_dashboard:memory_usedutilization:Average"}) by (instanceId, __name__) ', '1m') from metrics limit 1000000Configure intelligent patrol task

In[ SLS console ]Find the entry of [intelligent exception analysis] in. After simple initialization, you can enter through the task entry of [intelligent patrol] to find the corresponding configuration page. In the process of job configuration, you should pay attention to selecting the time series library, otherwise you can't find the MetricStore that stores Cloud monitoring data.
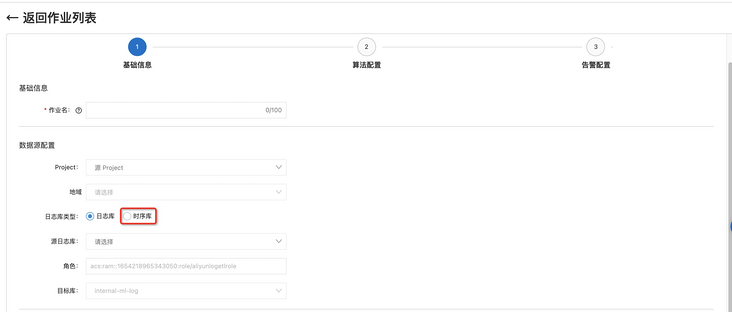
In feature configuration, the following Query is used for configuration. Here are some notes to note:
- Write through SQL and process the time field, because in patrol inspection, the accepted time unit is seconds, while the time in the result obtained by PromQL is milliseconds;
- Through element_at operator to extract the corresponding instance ID(instanceId);
- At present, when configuring granularity, it only supports 60 seconds at least;
* | select time / 1000 as time, metric, element_at(labels, 'instanceId') as instanceId, value from ( select promql_query_range('avg({__name__=~"acs_ecs_dashboard:CPUUtilization:Average|acs_ecs_dashboard:DiskReadBPS:Average|acs_ecs_dashboard:DiskReadIOPS:Average|acs_ecs_dashboard:DiskWriteBPS:Average|acs_ecs_dashboard:DiskWriteIOPS:Average|acs_ecs_dashboard:InternetIn:Average|acs_ecs_dashboard:InternetInRate:Average|acs_ecs_dashboard:InternetOut:Average|acs_ecs_dashboard:InternetOutRate:Average|acs_ecs_dashboard:InternetOutRate_Percent:Average|acs_ecs_dashboard:IntranetOut:Average|acs_ecs_dashboard:IntranetOutRate:Average|acs_ecs_dashboard:cpu_idle:Average|acs_ecs_dashboard:cpu_other:Average|acs_ecs_dashboard:cpu_system:Average|acs_ecs_dashboard:cpu_total:Average|acs_ecs_dashboard:cpu_user:Average|acs_ecs_dashboard:cpu_wait:Average|acs_ecs_dashboard:disk_readbytes:Average|acs_ecs_dashboard:disk_readiops:Average|acs_ecs_dashboard:disk_writebytes:Average|acs_ecs_dashboard:disk_writeiops:Average|acs_ecs_dashboard:load_1m:Average|acs_ecs_dashboard:load_5m:Average|acs_ecs_dashboard:memory_freespace:Average|acs_ecs_dashboard:memory_freeutilization:Average|acs_ecs_dashboard:memory_totalspace:Average|acs_ecs_dashboard:memory_usedspace:Average|acs_ecs_dashboard:memory_usedutilization:Average"}) by (instanceId, __name__) ', '1m') from metrics ) limit 10000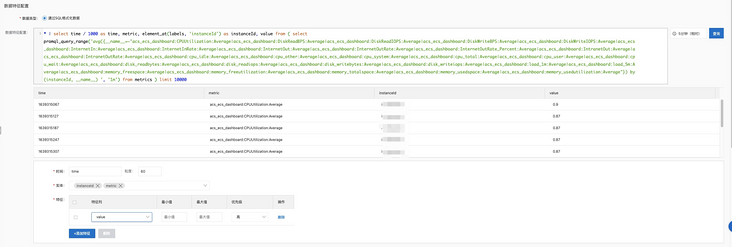
In the following [algorithm configuration] and [scheduling configuration], you should pay attention to the following:
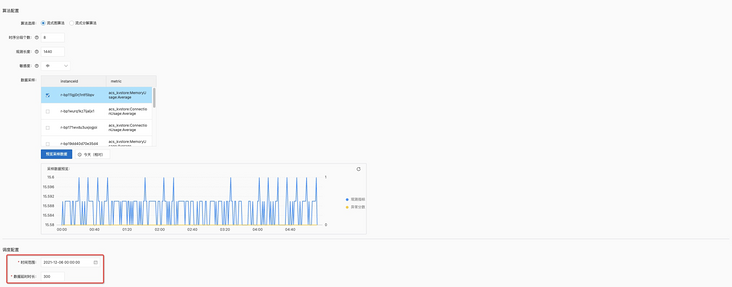
[time range] - select two days before the current time, so that the algorithm has enough data to learn, so that the effect is better;
[data delay duration] - since we process cloud monitoring data imported through the import service, the overall link delay will not exceed 300s at most. Therefore, 300 seconds should be selected here to prevent observation loss.
Configure alarm
Through the information provided in SLS New version alarm It is very convenient to connect the alarm configuration of machine learning. You can use a complete set of alarm capabilities to manage your alarms.

It is recommended that you use the normal mode but set the alarm. In the [action strategy] column, select our built-in action strategy (sls.app.ml.builtin). Here we have configured it. You can view it in the alarm configuration. See the address:
https://sls.console.aliyun.co...${projectName}/alertcenter?tab=action_policy
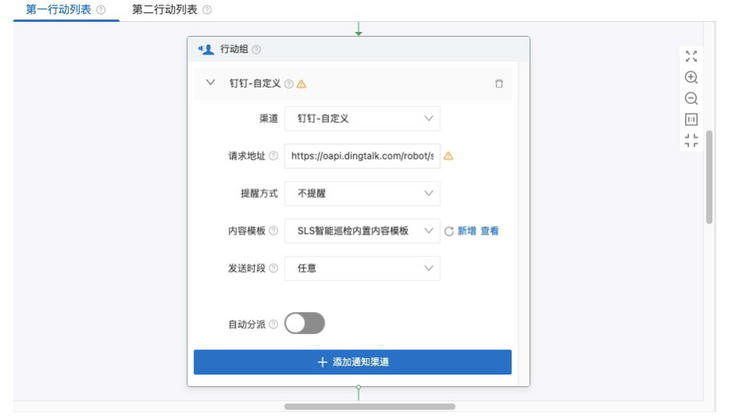
Here, you need to formulate the corresponding request address (the address of the nailing robot is webhook), and select [SLS intelligent patrol built-in content template] as the content template. In this way, you can decouple the [alarm configuration] from the [patrol operation configuration], and the alarm configuration can be updated by modifying the [patrol operation] configuration as required by subsequent users. So far, we have The operation of configuring patrol algorithm in [cloud monitoring data] is completed.
Original link
This article is the original content of Alibaba cloud and cannot be reproduced without permission.