The most detailed big data ELK article series in the whole network. It is strongly recommended to collect and pay attention!
The new articles have listed the historical article directory to help you review the previous knowledge focus.
catalogue
Collect Apache Web server logs
3, Send logs to Logstash using filebeans
4, Configure Logstash to receive FileBeat data and print
5, Logstash outputs data to Elasticsearch
1. Re copy a configuration file
2. Change the output to Elasticsearch
4. Append a log to the monitored file, and view the indexes and documents in Elasticsearch
1. View the plug-ins installed by Logstash
7, Match the IP and date in the log and print
1. Modify Logstash configuration file
9, Output data to Elasticsearch
1. Filter out the required fields
3. Output to Elasticsearch specified index
Collect Apache Web server logs
1, Demand
Apache's Web Server generates a large number of logs when we want to retrieve and analyze these logs. You need to import these logs into Elasticsearch first. Here, we can use Logstash to collect logs
Open this file, as shown in the following figure. We found that it is a log in plain text format. As shown in the figure below:

This log is actually made up of fields one by one. Refer to the following table
| Field name | explain |
| client IP | Browser side IP |
| timestamp | Requested timestamp |
| method | Request mode (GET/POST) |
| uri | Requested link address |
| status | Server side response status |
| length | Data length of response |
| reference | From which URL |
| browser | browser |
Finally, we need to store these log data in elasticsearch. Elasticsearch has a schema, instead of storing all messages in a large text, we need to save the fields in elasticsearch one by one. Therefore, we need to parse the data in Logstash in advance, parse the log text lines into fields, and then save the fields to elasticsearch
2, Prepare log data
Upload Apache server logs to the / export/server/es/data/apache / directory
mkdir -p /export/server/es/data/apache/
3, Send logs to Logstash using filebeans
Before using Logstash for data analysis, we need to use FileBeat to send the collected data to Logstash. Previously, we used FileBeat to monitor log files through the Harvester component of FileBeat, and then save the logs to Elasticsearch in a certain format. Now we need to configure FileBeats to send data to Logstash. The FileBeat end can be configured as follows:
#----------------------------- Logstash output ---------------------------------
#output.logstash:
  # Boolean flag to enable or disable the output module.
  #enabled: true

  # The Logstash hosts
  #hosts: ["localhost:5044"]
hosts is configured with the IP address / machine name and port number that Logstash listens to.
Preparing the FileBeat configuration file
cd /export/server/es/filebeat-7.6.1-linux-x86_64

vim filebeat-logstash.yml
Because Apache's web log starts with IP address, we need to modify the matching field
filebeat.inputs:
- type: log
  enabled: true
  paths:
    - /var/apache/log/access.*
  multiline.pattern: '^\d+\.\d+\.\d+\.\d+ '
  multiline.negate: true
  multiline.match: after

output.logstash:
  enabled: true
  hosts: ["node1:5044"]
Start FileBeat and specify to use the new configuration file
./filebeat -e -c filebeat-logstash.yml
FileBeat will attempt to establish a connection with the IP and port number that Logstash listens to. However, at this time, we have not enabled and configured Logstash, so FileBeat cannot connect to Logstash.
2021-12-05T11:28:47.585+0800 ERROR pipeline/output.go:100 Failed to connect to backoff(async(tcp://node1.itcast.cn:5044)): dial tcp 192.168.88.100:5044: connect: connection refused
4, Configure Logstash to receive FileBeat data and print
The configuration file of Logstash is similar to FileBeat. It also needs an input, and output. The basic format is as follows:
# #A sign indicates adding a comment
# input indicates the data to be received
input {
}

# file means filtering the received data
filter {

}

# Output means to output data to other locations
output {
}
Configure receiving data from FileBeat
cd /export/server/es/logstash-7.6.1/config
vim filebeat-print.conf
input {
  beats {
    port => 5044
  }
}

output {
  stdout {
    codec => rubydebug
  }
}
Test whether the logstash configuration is correct
bin/logstash -f config/filebeat-print.conf --config.test_and_exit
[2021-12-05T11:46:33,940][INFO ][logstash.runner ] Using config.test_and_exit mode. Config Validation Result: OK. Exiting Logstash
Start logstash
bin/logstash -f config/filebeat-print.conf --config.reload.automatic
reload.automatic: automatically reloads when a configuration file is modified
test
Create an access log. 1 file, use cat test > > access log. 1 add content to the log file.
Only one log is saved in the test file:
[root@node1 log]# cat test
235.9.200.242 - - [15/Apr/2015:00:27:19 +0849] "POST /it.cn/bigdata.html 200 45 "www.baidu.com" "Mozilla/5.0 (Windows NT 5.1) AppleWebKit/537.36 (KHTML, like Gecko) Chrome/53.0.2785.104 Safari/537.36 Core/1.53.4549.400 QQBrowser/9.7.12900 144.180.122.249
After we start Logstash, we can find that Logstash will print the data received from FileBeat:
{
           "log" => {
          "file" => {
            "path" => "/var/apache/log/access.log.1"
        },
        "offset" => 825
    },
         "input" => {
        "type" => "log"
    },
         "agent" => {
        "ephemeral_id" => "d4c3b652-4533-4ebf-81f9-a0b78c0d4b05",
             "version" => "7.6.1",
                "type" => "filebeat",
                  "id" => "b4c5c4dc-03c3-4ba4-9400-dc6afcb36d64",
            "hostname" => "node1.itcast.cn"
    },
    "@timestamp" => 2021-12-05T09:07:55.236Z,
           "ecs" => {
        "version" => "1.4.0"
    },
          "host" => {
        "name" => "node1"
    },
          "tags" => [
        [0] "beats_input_codec_plain_applied"
    ],
       "message" => "235.9.200.242 - - [15/Apr/2015:00:27:19 +0849] \"POST /it.cn/bigdata.html 200 45 \"www.baidu.com\" \"Mozilla/5.0 (Windows NT 5.1) AppleWebKit/537.36 (KHTML, like Gecko) Chrome/53.0.2785.104 Safari/537.36 Core/1.53.4549.400 QQBrowser/9.7.12900 144.180.122.249",
      "@version" => "1"
}
5, Logstash outputs data to Elasticsearch
Through the console, we found that the data received by Logstash input was sent to the output component without any processing. In fact, we need to output the data to Elasticsearch. Therefore, we modify the output configuration of Logstash. To configure the output Elasticsearch, you only need to configure the following:
output {
    elasticsearch {
        hosts => [ "localhost:9200" ]
    }}
Operation steps:
1. Re copy a configuration file
cp filebeat-print.conf filebeat-es.conf
2. Change the output to Elasticsearch
input {
  beats {
    port => 5044
  }
}

output {
 elasticsearch {
   hosts => [ "node1:9200","node2:9200","node3:9200"]
 }
}
3. Restart Logstash
bin/logstash -f config/filebeat-es.conf --config.reload.automatic
4. Append a log to the monitored file, and view the indexes and documents in Elasticsearch
cat test >> access.log.1
//View index data
GET /_cat/indices?v
We found an index starting with logstash in elastic search
    {
        "health": "green",
        "status": "open",
        "index": "logstash-2021.12.05-000001",
        "uuid": "147Uwl1LRb-HMFERUyNEBw",
        "pri": "1",
        "rep": "1",
        "docs.count": "2",
        "docs.deleted": "0",
        "store.size": "44.8kb",
        "pri.store.size": "22.4kb"
    }
//View the data of the index library
GET /logstash-2021.12.05-000001/_search?format=txt
{

    "from": 0,

    "size": 1

}
We can obtain the following data:
                    "@timestamp": "2021-12-05T09:38:00.402Z",
                    "tags": [
                        "beats_input_codec_plain_applied"
                    ],
                    "host": {
                        "name": "node1"
                    },
                    "@version": "1",
                    "log": {
                        "file": {
                            "path": "/var/apache/log/access.log.1"
                        },
                        "offset": 1343
                    },
                    "agent": {
                        "version": "7.6.1",
                        "ephemeral_id": "d4c3b652-4533-4ebf-81f9-a0b78c0d4b05",
                        "id": "b4c5c4dc-03c3-4ba4-9400-dc6afcb36d64",
                        "hostname": "node1",
                        "type": "filebeat"
                    },
                    "input": {
                        "type": "log"
                    },
                    "message": "235.9.200.242 - - [15/Apr/2015:00:27:19 +0849] \"POST /it.cn/bigdata.html 200 45 \"www.baidu.com\" \"Mozilla/5.0 (Windows NT 5.1) AppleWebKit/537.36 (KHTML, like Gecko) Chrome/53.0.2785.104 Safari/537.36 Core/1.53.4549.400 QQBrowser/9.7.12900 144.180.122.249",
                    "ecs": {
                        "version": "1.4.0"
                    }
From the results returned from the output, we can see that the log has indeed been saved in Elasticsearch, and we can see that the message data is encapsulated in a field named message, and other data is encapsulated in fields one by one. We actually want to parse the message into fields one by one. For example: IP field, time, request method, request URL, response result, etc
6, Logstash filter
In Logstash, you can configure a Filter to intermediate process the collected data. In Logstash, there are a large number of plug-ins for us to use. Refer to the official website:
Filter plugins | Logstash Reference [7.6] | Elastic
Here, we will focus on the Grok plug-in.
1. View the plug-ins installed by Logstash
bin/logstash-plugin list
2. Grok plugin
Grok is a plug-in that parses unstructured logs into structured logs. This tool is very suitable for parsing system logs, Web server logs, MySQL or any other log format.
Grok website: Grok filter plugin | Logstash Reference [7.6] | Elastic
3. Grok syntax
Grok identifies the data in the log through pattern matching. You can simply understand the grok plug-in as an upgraded version of regular expression. It has more modes. By default, Logstash has 120 modes. If these patterns do not meet our requirements for parsing logs, we can directly use regular expressions for matching.
Official website: https://github.com/logstash-plugins/logstash-patterns-core/blob/master/patterns/grok-patterns
The syntax of the grok pattern is:% {SYNTAX:SEMANTIC}
SYNTAX refers to the Grok pattern name, and SEMANTIC refers to the text field name matched to the pattern. For example:
%{NUMBER:duration} %{IP:client}
duration means to match a number, and client means to match an IP address
By default, all matched data types in Grok are strings. If you want to convert them to int types (currently only int and float are supported), you can do this:% {number: duration: int}% {IP: client}
The following are common Grok patterns:
| NUMBER | Matching number (including decimal) |
| INT | Match integer number |
| POSINT | Match positive integer |
| WORD | Match word |
| DATA | Match all characters |
| IP | Match IP address |
| PATH | Matching path |
4. Usage
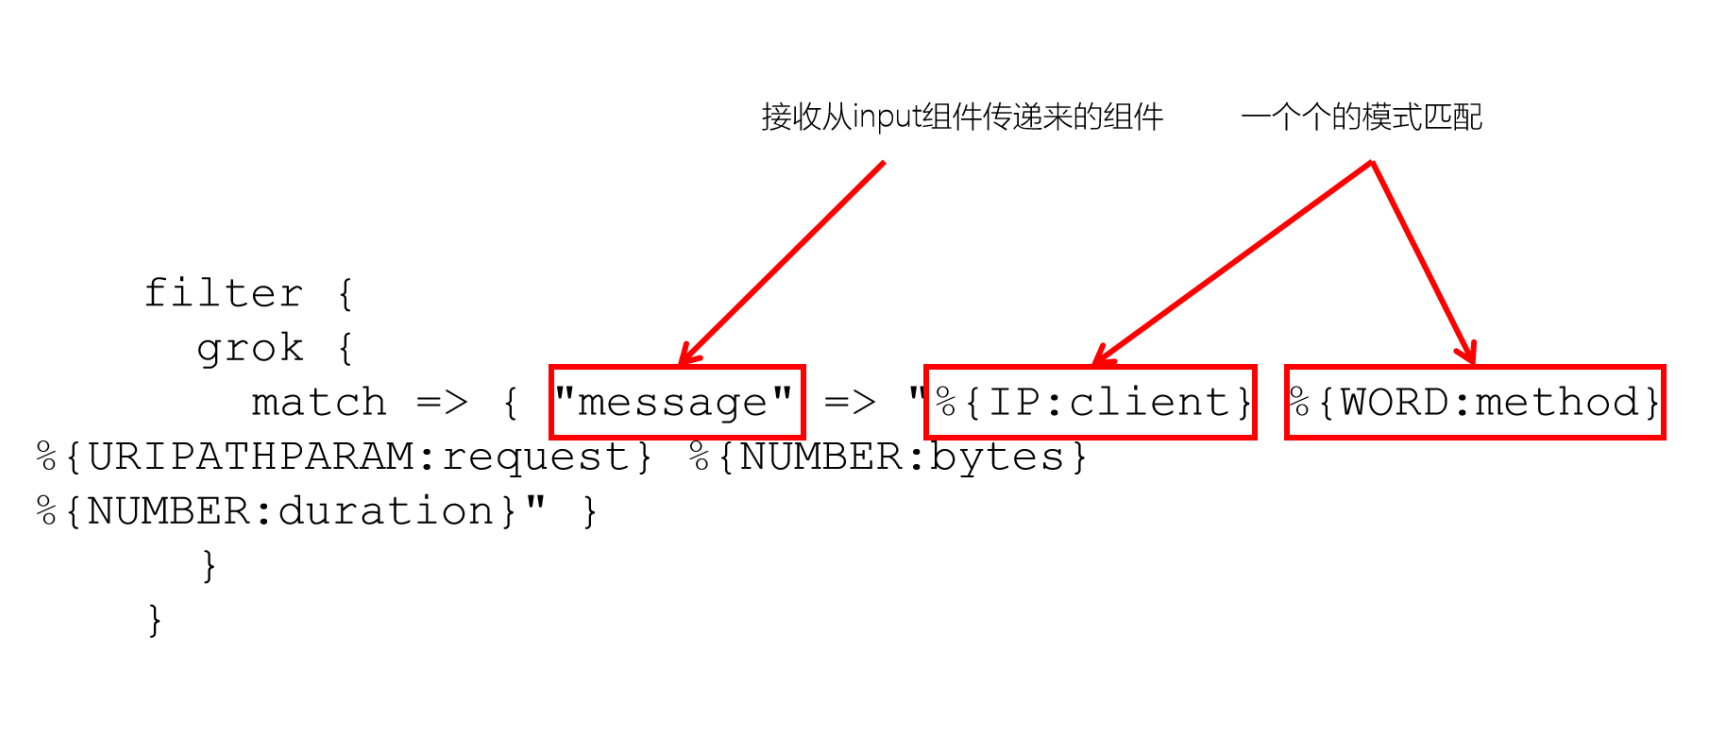
    filter {
      grok {
        match => { "message" => "%{IP:client} %{WORD:method} %{URIPATHPARAM:request} %{NUMBER:bytes} %{NUMBER:duration}" }
      }
    }
VII. Match the IP and date in the log and print
235.9.200.242 - - [15/Apr/2015:00:27:19 +0849] "POST /it.cn/bigdata.html 200 45 "www.baidu.com" "Mozilla/5.0 (Windows NT 5.1) AppleWebKit/537.36 (KHTML, like Gecko) Chrome/53.0.2785.104 Safari/537.36 Core/1.53.4549.400 QQBrowser/9.7.12900 144.180.122.249
We can match the previous IP fields by using IP, and the subsequent dates by using HTTP date
Configure Grok filtering plug-in
1. Configure Logstash
input {
    beats {
        port => 5044
    }
}

filter {
    grok {
        match => {
            "message" => "%{IP:ip} - - \[%{HTTPDATE:date}\]"
        }
    }
}

output {
    stdout {
        codec => rubydebug
    }
}
2. Start Logstash
bin/logstash -f config/filebeat-filter-print.conf --config.reload.automatic
{
           "log" => {
        "offset" => 1861,
          "file" => {
            "path" => "/var/apache/log/access.log.1"
        }
    },
         "input" => {
        "type" => "log"
    },
          "tags" => [
        [0] "beats_input_codec_plain_applied"
    ],
          "date" => "15/Apr/2015:00:27:19 +0849",
           "ecs" => {
        "version" => "1.4.0"
    },
    "@timestamp" => 2021-12-05T11:02:05.809Z,
       "message" => "235.9.200.242 - - [15/Apr/2015:00:27:19 +0849] \"POST /it.cn/bigdata.html 200 45 \"www.baidu.com\" \"Mozilla/5.0 (Windows NT 5.1) AppleWebKit/537.36 (KHTML, like Gecko) Chrome/53.0.2785.104 Safari/537.36 Core/1.53.4549.400 QQBrowser/9.7.12900 144.180.122.249",
          "host" => {
        "name" => "node1"
    },
            "ip" => "235.9.200.242",
         "agent" => {
            "hostname" => "node1",
             "version" => "7.6.1",
        "ephemeral_id" => "d4c3b652-4533-4ebf-81f9-a0b78c0d4b05",
                  "id" => "b4c5c4dc-03c3-4ba4-9400-dc6afcb36d64",
                "type" => "filebeat"
    },
      "@version" => "1"
}
We can see that after being processed by the Grok filter plug-in, we have obtained the ip and date fields. Next, we can continue to parse other fields
8, Resolve all fields
Parse the log into the following fields:
| Field name | explain |
| client IP | Browser side IP |
| timestamp | Requested timestamp |
| method | Request mode (GET/POST) |
| uri | Requested link address |
| status | Server side response status |
| length | Data length of response |
| reference | From which URL |
| browser | browser |
1. Modify Logstash configuration file
input {
    beats {
        port => 5044
    }
}

filter {
    grok {
        match => {
            "message" => "%{IP:ip} - - \[%{HTTPDATE:date}\] \"%{WORD:method} %{PATH:uri} %{DATA}\" %{INT:status} %{INT:length} \"%{DATA:reference}\" \"%{DATA:browser}\""
        }
    }
}

output {
    stdout {
        codec => rubydebug
    }
}
2. Test and start Logstash
We can see that all 8 fields have been successfully parsed.
{
     "reference" => "www.baidu.com",
      "@version" => "1",
           "ecs" => {
        "version" => "1.4.0"
    },
    "@timestamp" => 2021-12-05T03:30:10.048Z,
            "ip" => "235.9.200.241",
        "method" => "POST",
           "uri" => "/it.cn/bigdata.html",
         "agent" => {
                  "id" => "b4c5c4dc-03c3-4ba4-9400-dc6afcb36d64",
        "ephemeral_id" => "734ae9d8-bcdc-4be6-8f97-34387fcde972",
             "version" => "7.6.1",
            "hostname" => "node1",
                "type" => "filebeat"
    },
        "length" => "45",
        "status" => "200",
           "log" => {
          "file" => {
            "path" => "/var/apache/log/access.log"
        },
        "offset" => 1
    },
         "input" => {
        "type" => "log"
    },
          "host" => {
        "name" => "node1"
    },
          "tags" => [
        [0] "beats_input_codec_plain_applied"
    ],
       "browser" => "Mozilla/5.0 (Windows NT 5.1) AppleWebKit/537.36 (KHTML, like Gecko) Chrome/53.0.2785.104 Safari/537.36 Core/1.53.4549.400 QQBrowser/9.7.12900",
          "date" => "15/Apr/2015:00:27:19 +0849",
       "message" => "235.9.200.241 - - [15/Apr/2015:00:27:19 +0849] \"POST /it.cn/bigdata.html HTTP/1.1\" 200 45 \"www.baidu.com\" \"Mozilla/5.0 (Windows NT 5.1) AppleWebKit/537.36 (KHTML, like Gecko) Chrome/53.0.2785.104 Safari/537.36 Core/1.53.4549.400 QQBrowser/9.7.12900\""
}
9, Output data to Elasticsearch
So far, we have passed Grok Filter to parse log messages into fields one by one. Now we need to save these fields in Elasticsearch. We can see that there are a large number of fields in the output of Logstash, but what should we do if we only need to save the 8 fields we need? Moreover, if we need to convert the date format, what should we do?
1. Filter out the required fields
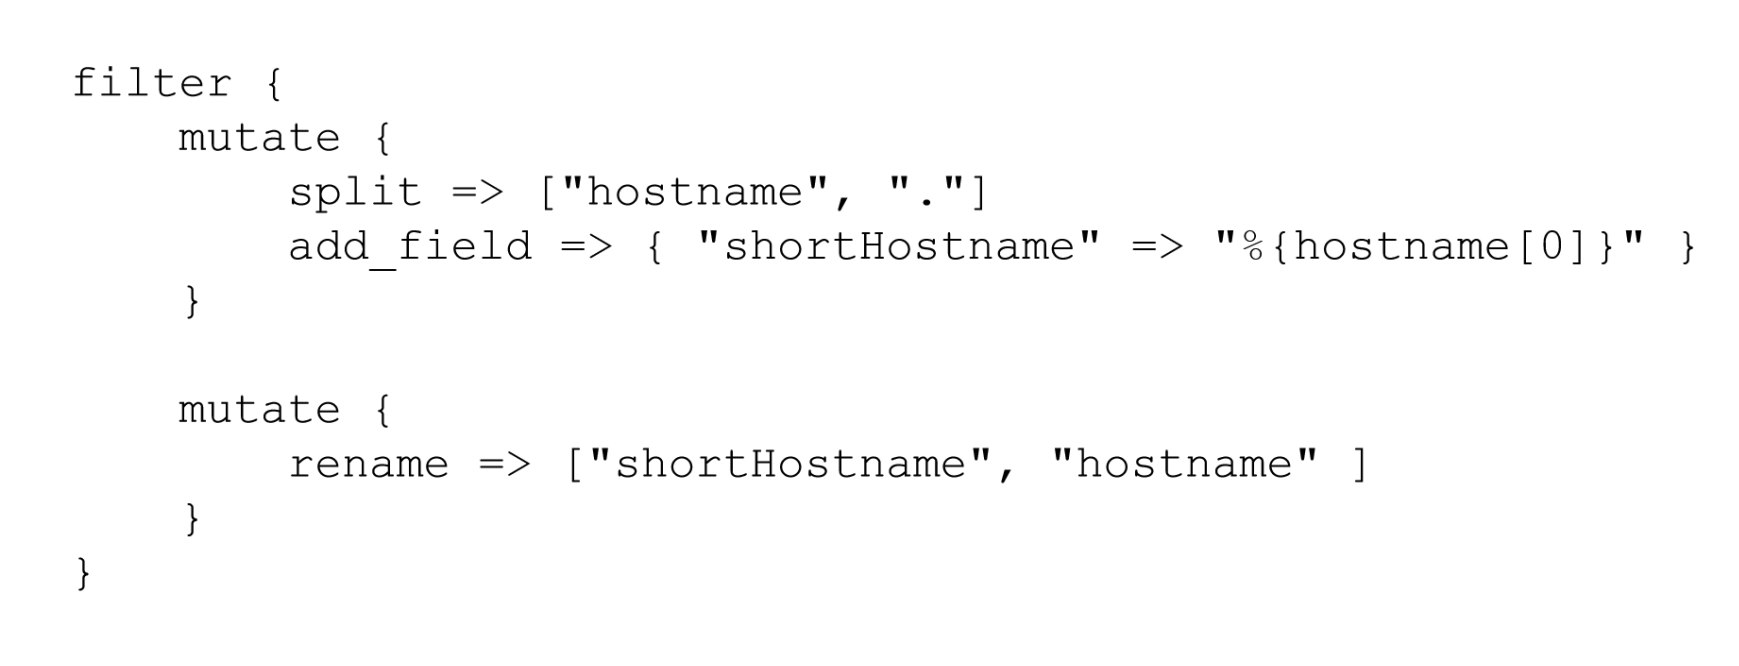
To filter out the fields we need. We need to use the mutate plug-in. The change plug-in mainly acts on fields. For example, it can rename, delete, replace or modify the structure of fields.
Official documents: Mutate filter plugin | Logstash Reference [7.6] | Elastic
For example, the mutate plug-in can support the following common operations
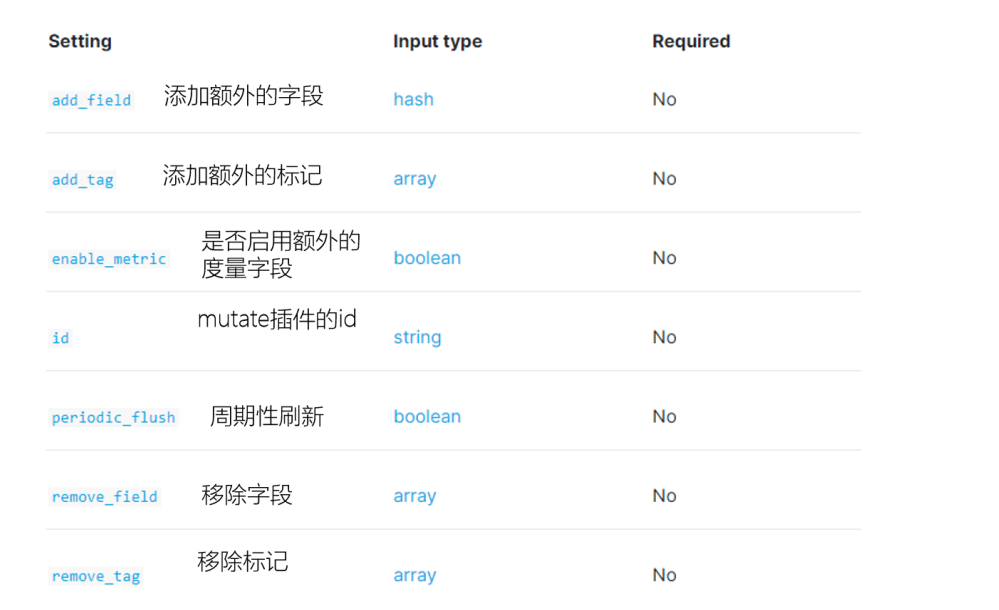
to configure:
Note: for the convenience of type processing, status and length are specified as int types
input {
    beats {
        port => 5044
    }
}

filter {
    grok {
        match => {
            "message" => "%{IP:ip} - - \[%{HTTPDATE:date}\] \"%{WORD:method} %{PATH:uri} %{DATA}\" %{INT:status:int} %{INT:length:int} \"%{DATA:reference}\" \"%{DATA:browser}\""
        }
    }
    mutate {
        enable_metric => "false"
        remove_field => ["message", "log", "tags", "@timestamp", "input", "agent", "host", "ecs", "@version"]
    }
}

output {
    stdout {
        codec => rubydebug
    }
}
2. Convert date format
To convert the Date format, we can use the Date plug-in. The plug-in is specially used to parse the Date in the field. The official description document is as follows: Date filter plugin | Logstash Reference [7.6] | Elastic
The usage is as follows:
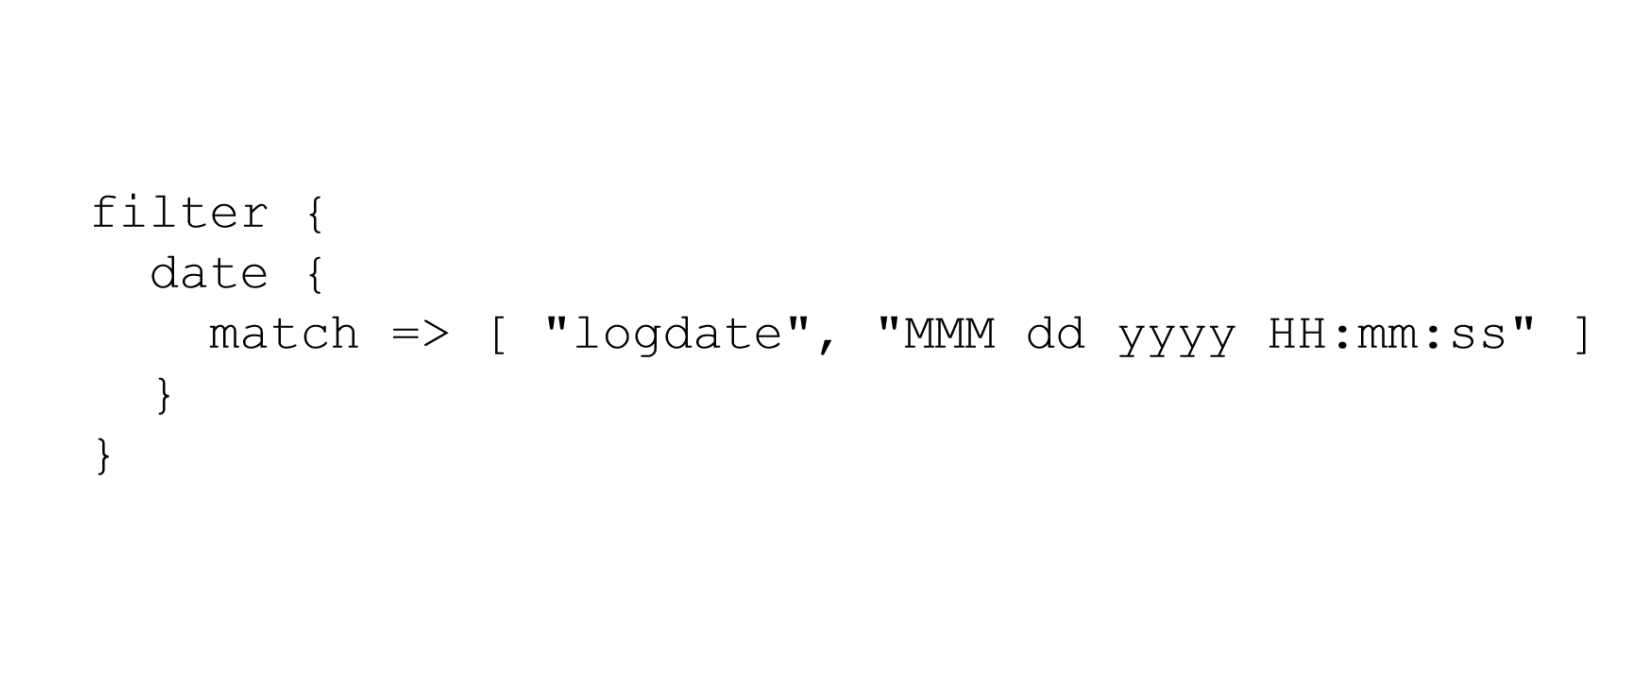
Convert the date field to the format of "year, day, hour, minute and second". After being processed by the date plug-in, the default field will be output to the @ timestamp field. Therefore, we can redefine the output field by modifying the target attribute.
The Logstash configuration is modified as follows:
input {
    beats {
        port => 5044
    }
}

filter {
    grok {
        match => {
            "message" => "%{IP:ip} - - \[%{HTTPDATE:date}\] \"%{WORD:method} %{PATH:uri} %{DATA}\" %{INT:status:int} %{INT:length:int} \"%{DATA:reference}\" \"%{DATA:browser}\""
        }
    }
    mutate {
        enable_metric => "false"
        remove_field => ["message", "log", "tags", "@timestamp", "input", "agent", "host", "ecs", "@version"]
    }
    date {
        match => ["date","dd/MMM/yyyy:HH:mm:ss Z","yyyy-MM-dd HH:mm:ss"]
        target => "date"
    }
}

output {
    stdout {
        codec => rubydebug
    }
}
Start Logstash:
bin/logstash -f config/filebeat-filter-print.conf --config.reload.automatic
{
       "status" => "200",
    "reference" => "www.baidu.com",
       "method" => "POST",
      "browser" => "Mozilla/5.0 (Windows NT 5.1) AppleWebKit/537.36 (KHTML, like Gecko) Chrome/53.0.2785.104 Safari/537.36 Core/1.53.4549.400 QQBrowser/9.7.12900",
           "ip" => "235.9.200.241",
       "length" => "45",
          "uri" => "/it.cn/bigdata.html",
         "date" => 2015-04-14T15:38:19.000Z
}
3. Output to Elasticsearch specified index
We can pass
elasticsearch {

        hosts => ["node1:9200" ,"node2:9200" ,"node3:9200"]

        index => "xxx"

}
Index to specify the index name. The default output index name is: logstash-%{+yyyy.MM.dd}. Note, however, that to use time formatting in the index, the output of the filter must contain the @ timestamp field, otherwise the date cannot be parsed.
input {
    beats {
        port => 5044
    }
}

filter {
    grok {
        match => {
            "message" => "%{IP:ip} - - \[%{HTTPDATE:date}\] \"%{WORD:method} %{PATH:uri} %{DATA}\" %{INT:status:int} %{INT:length:int} \"%{DATA:reference}\" \"%{DATA:browser}\""
        }
    }
    mutate {
        enable_metric => "false"
        remove_field => ["message", "log", "tags", "input", "agent", "host", "ecs", "@version"]
    }
    date {
        match => ["date","dd/MMM/yyyy:HH:mm:ss Z","yyyy-MM-dd HH:mm:ss"]
        target => "date"
    }
}

output {
    stdout {
        codec => rubydebug
    }
    elasticsearch {
        hosts => ["node1:9200" ,"node2:9200" ,"node3:9200"]
        index => "apache_web_log_%{+YYYY-MM}"
    }
}
Start Logstash
bin/logstash -f config/filebeat-apache-weblog.conf --config.test_and_exit

bin/logstash -f config/filebeat-apache-weblog.conf --config.reload.automatic
be careful:
- Uppercase characters cannot appear in the index name
- 📢 Blog home page: https://lansonli.blog.csdn.net
- 📢 Welcome to praise 👍 Collection ⭐ Leaving a message. 📝 Please correct any errors!
- 📢 This article was originally written by Lansonli and started on CSDN blog 🙉
- 📢 Big data series articles will be updated every day. When you stop to rest, don't forget that others are still running. I hope you will seize the time to study and make every effort to go to a better life ✨