1, Understand what preprocessing is
Data preprocessing is a data mining technology. Its essence is to convert the original data into an understandable format or in line with our mining format.
2, Why preprocessing
In the real world, data is usually incomplete (lack of some interesting attribute values), inconsistent (including differences in codes or names), and vulnerable to noise (errors or outliers). Because the database is too large and data sets often come from multiple heterogeneous data sources, low-quality data will lead to low-quality mining results.
3, Basic methods of data preprocessing
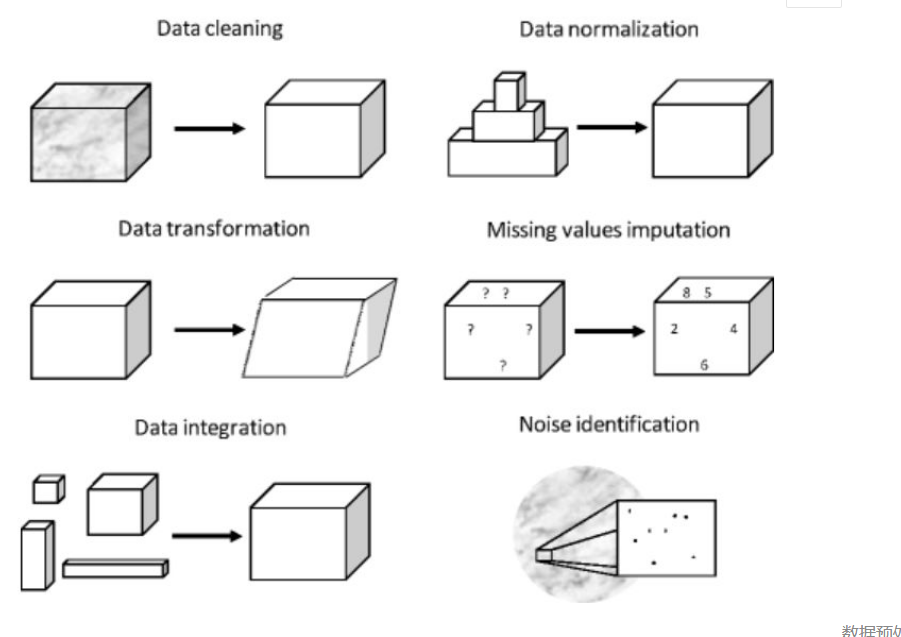
1. Basic method

- Data cleaning: fill in missing values, smooth noise data, identify or delete outliers, and solve inconsistencies to "clean up data";
- Data integration: using multiple databases, data cubes or files;
- Data reduction: replace metadata with alternative and smaller data representation to minimize the loss of information content, including dimension specification, quantity specification and data compression;
- Data transformation: transform data into the form of mining.
visualization:
4, Apply
To process with Python, you also need to use two libraries, Numpy and Pandas.
1. Prepare data
There is a data set, which includes the information of IT professionals, such as country, salary and gender, as follows:
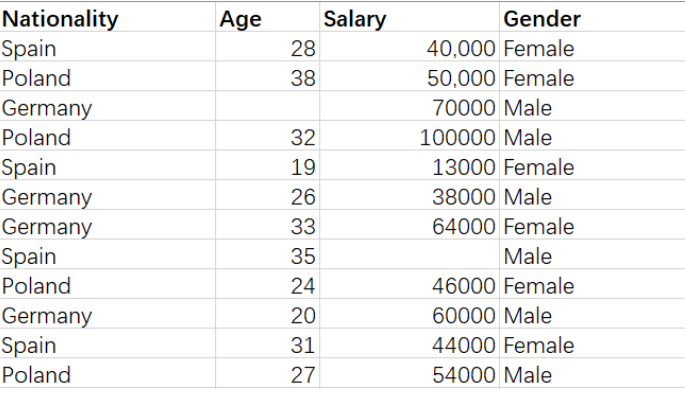
We are free to create copies of this dataset.
We can observe that the data set above contains some null values
2. Import library
The Numpy library contains math tools that can be used for any type of math in our code;
The Pandas library is used to import and manage datasets.
How to import libraries:
import pandas as pd
import numpy as np
3. Import dataset
I named my dataset file 'profess ionals' and its format is csv.
#Read data (my dataset file is in the same directory as my python file)
data = pd.read_csv("profess.csv")
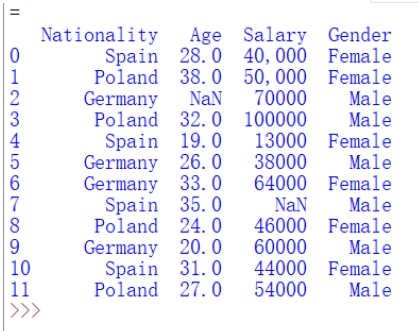
After importing the dataset, let's see its format:
print(data)
4. Data cleaning - check the missing value
Use the isnull function of the Pandas library to see.
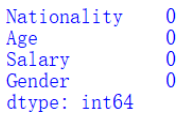
print(data.isnull().sum())
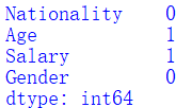
Both age and salary columns have missing values (i.e. empty values), and the number of missing values is 1. There are seven methods to deal with missing values. Let's talk about the two commonly used methods.
(1) Processing normal null values
If a row has a null value for a specific characteristic d, the row is deleted. If a specific column has more than 75% missing values, the specific column is deleted. However, we should use this method when we ensure that there are enough sample data. Because we want to ensure that the deviation will not be increased after deleting the data.
data.dropna(inplace=True)
print(data.isnull().sum())
(2) Processing data such as age, year and amount
This method is applicable to the function of digital data such as year or age and amount. We can calculate the mean, median or mode of the feature and replace it with the missing value. Compared with the first method, this method can offset the lack of data and produce better results.
Let's look at the operation:
# Replace the empty value in the Age column with the median of Age.

# medain() is the median method of pandas library

data['Age'] = data['Age']
            .replace(np.NaN,data['Age']
            .median())

print(data['Age'])
5. Data reduction
In order to meet the mining requirements, we need to know the Salary distribution range of these engineers, but we only have the Salary column. Therefore, in order to facilitate mining, we add the Salary level column to our data set and reduce the areas through the Salary column. This method is called "attribute construction". Let's look at the operation:
**#Data reduction
def section(d):
    if 50000 > d:
         return "50000 following"
     if  100000 > d >= 5000:
         return "50000-100000"
     if  d > 100000:
         return "100000 above"

data['level'] =  data['Salary']
                 .apply(lambda x: section(x))

print(data['level'])**
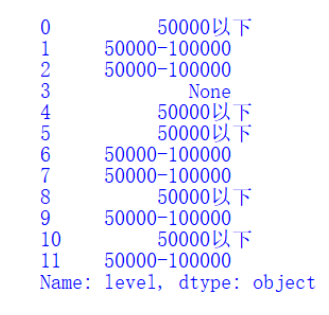
We define a function of 'data transformation', select the interval for transformation according to Salary's judgment, and assign it to level.
6. Data transformation
We can see that the Salary column also has a null value. From a business perspective, it should be a number. However, we found that our data set is a currency format, and we need to 'transform' it into the digital format we need. Let's look at the actual operation:
#Data transformation
def convert_currency(d):
    new_value = str(d).replace(",","")
                .replace("$","")
    return float(new_value)

data['Salary'] = data['Salary'].apply(convert_currency)

# mean() is the average method of pandas library

data['Salary'] = data['Salary']
                    .replace(np.NaN,data['Salary']
                    .mean())
print(data['Salary'])
Transform succeeded:
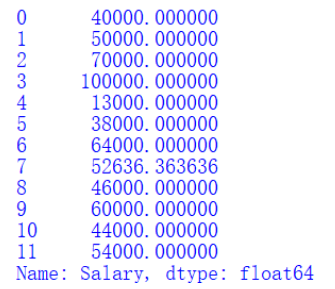
We define a "data transformation" function, then apply it to the Salary column, and finally perform the same replacement operation as the data cleaning step. Here, we replace it with the average value.