Binary Installation ELKstack
This build belongs to single point and is installed on the same machine
Base Component Deployment
 curl -o /etc/yum.repos.d/CentOS-Base.repo http://mirrors.aliyun.com/repo/Centos-7.repo
 wget -O /etc/yum.repos.d/epel.repo http://mirrors.aliyun.com/repo/epel-7.repo
 yum makecache
 yum install wget vim lsof net-tools lrzsz -y
 yum -y install ntp
 systemctl enable ntpd
 systemctl start ntpd
 ntpdate -u cn.pool.ntp.org
 hwclock --systohc
 timedatectl set-timezone Asia/Shanghai
 systemctl stop firewalld
 systemctl disable firewalld
 setenforce 0
 sed -i '/SELINUX/s/enforcing/disabled/' /etc/selinux/config
 echo '
* hard nofile 65536
* soft nofile 65536
* soft nproc  65536
* hard nproc  65536
'>>/etc/security/limit.conf
echo '
vm.max_map_count = 262144
net.core.somaxconn=65535
net.ipv4.ip_forward = 1
'>>/etc/sysctl.conf
sysctl -p
yum install -y java
mkdir /root/elk -p;cd /root/elk
wget https://artifacts.elastic.co/downloads/elasticsearch/elasticsearch-5.5.0.tar.gz
wget https://artifacts.elastic.co/downloads/kibana/kibana-5.5.0-linux-x86_64.tar.gz
wget https://artifacts.elastic.co/downloads/logstash/logstash-5.5.0.tar.gz
Install Elasticsearch
mkdir /data/{es-data,es-logs} -p
tar xf elasticsearch-5.5.0.tar.gz -C /usr/local/
ln -s /usr/local/elasticsearch-5.5.0 /usr/local/elasticsearch
cat>>/usr/local/elasticsearch-5.5.0/config/elasticsearch.yml<<EOF
node.name: my-es
path.data: /data/es-data
path.logs: /data/es-logs
http.host: "192.168.83.60"
http.cors.enabled: true
http.cors.allow-origin: "*"
EOF
useradd elk
chown -R elk /data/es-*
chown -R elk /usr/local/elasticsearch-5.5.0/
Start es
/usr/local/elasticsearch/bin/elasticsearch -d -d Background Run The first time you do not add the -d parameter, you will see the start error message
[root@60 data]# lsof -i:9200
COMMAND   PID USER   FD   TYPE DEVICE SIZE/OFF NODE NAME
java    20586  elk  132u  IPv6  61210      0t0  TCP 60:wap-wsp (LISTEN)
[root@60 data]# curl 192.168.83.60:9200
{
  "name" : "my-es",
  "cluster_name" : "elasticsearch",
  "cluster_uuid" : "cYF13nSqQAi91gHnn9I_bg",
  "version" : {
    "number" : "5.5.0",
    "build_hash" : "260387d",
    "build_date" : "2017-06-30T23:16:05.735Z",
    "build_snapshot" : false,
    "lucene_version" : "6.6.0"
  },
  "tagline" : "You Know, for Search"
}
Explanatory articles on configuration information: https://blog.csdn.net/laoyang360/article/details/72850834
ES Common Commands
curl -XDELETE 'http://host.IP.address:9200/logstash-*'Delete index (followed by index name)
curl -XGET 'host.IP.address:9200/_cat/health?v&pretty'  View cluster status
curl -XGET 'host.IP.address:9200/_cat/indices?v&pretty'    View Index
logstash installation
tar xf logstash-5.5.0.tar.gz -C /usr/local/
ln -s /usr/local/logstash-5.5.0 /usr/local/logstash
 Normally, we can start without configuring logstash. There is a file called logstash.yml under logstash, which can do some simple optimization for logstash.
vim /usr/local/logstash/config/logstash.yml
 config.reload.automatic: true #turn on profile autoloading
 config.reload.interval: 10 #Defines the profile overload period
create profile
mkdir /usr/local/logstash/conf/
vim /usr/local/logstash/conf/nginx.conf
input {
    file {
        path => " /usr/local/nginx/logs/access.log"
        start_position => "beginning"
        }
}
filter {
}
output {
        #stdout { codec=> rubydebug }
    elasticsearch {
        hosts => ["192.168.83.60:9200"]
        index => "static_nginx_access-%{+YYYY.MM.dd}"
 }
}

#This actually defines just one nginx log path
#Stdout {codec=> rubydebug} Prints out content for easy testing
#host Fill-in es host
#Index index name
Log Configuration in nginx
    log_format json '{"@timestamp":"$time_iso8601",'
                  '"host":"$server_addr",'
                  '"clientip":"$remote_addr",'
                  '"remote_user":"$remote_user",'
                  '"request":"$request",'
                  '"http_user_agent":"$http_user_agent",'
                  '"size":$body_bytes_sent,'
                  '"responsetime":$request_time,'
                  '"upstreamtime":"$upstream_response_time",'
                  '"upstreamhost":"$upstream_addr",'
                  '"http_host":"$host",'
                  '"requesturi":"$request_uri",'
                  '"url":"$uri",'
                  '"domain":"$host",'
                  '"xff":"$http_x_forwarded_for",'
                  '"referer":"$http_referer",'
                  '"status":"$status"}';
    access_log /usr/local/nginx/logs/access.log json;
Test logstash configuration file for correctness
Use logstash whenever possible chown -RHL elk.elk /usr/local/logstash su - elk
[elk@60 ~]$ /usr/local/logstash/bin/logstash -f /usr/local/logstash/conf/nginx.conf  -t
ERROR StatusLogger No log4j2 configuration file found. Using default configuration: logging only errors to the console.
Sending Logstash's logs to /usr/local/logstash/logs which is now configured via log4j2.properties
[2019-12-12T02:39:24,954][INFO ][logstash.setting.writabledirectory] Creating directory {:setting=>"path.queue", :path=>"/usr/local/logstash/data/queue"}
[2019-12-12T02:39:24,956][INFO ][logstash.setting.writabledirectory] Creating directory {:setting=>"path.dead_letter_queue", :path=>"/usr/local/logstash/data/dead_letter_queue"}
Configuration OK
[2019-12-12T02:39:25,050][INFO ][logstash.runner          ] Using config.test_and_exit mode. Config Validation Result: OK. Exiting Logstash
kibana installation
cd /root/elk
tar xf kibana-5.5.0-linux-x86_64.tar.gz -C /usr/local/
cd /usr/local
ln -nfsv kibana-5.5.0-linux-x86_64 kibana
chown -RHL elk.elk kibana-5.5.0-linux-x86_64
vim /usr/local/kibana/config/kibana.yml
server.port: 5601
server.host: "192.168.83.60"
elasticsearch.url: "http://192.168.83.60:9200"
Start kibana
su - elk
//Foreground boot to see if there is an exception
/usr/local/kibana/bin/kibana
//Background boot
nohup /usr/local/kibana/bin/kibana &
//View Index
[root[@60](https://my.oschina.net/bingo60) ~]# curl -XGET '192.168.83.60:9200/_cat/indices?v&pretty'
health status index                          uuid                   pri rep docs.count docs.deleted store.size pri.store.size
yellow open   static_nginx_access-2019.12.11 7mbLeNcfSM-_Z-G3uW3_2Q   5   1          3            0     14.8kb         14.8kb
yellow open   .kibana                        cCBXRM7dREO4imbiIaUsww   1   1          1            0      3.2kb          3.2kb
//Where static_nginx_access-2019.12.11 is the index name
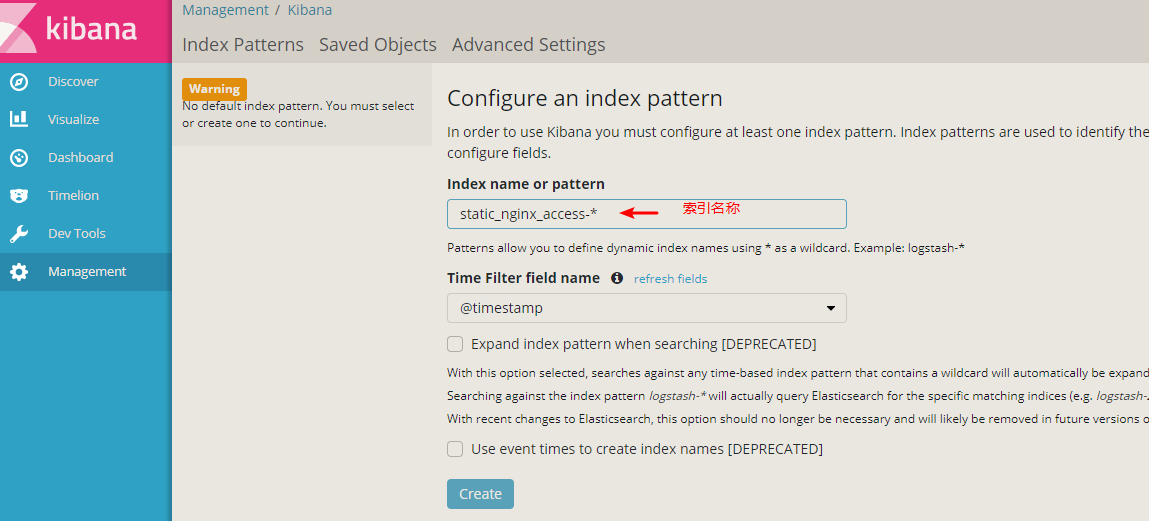
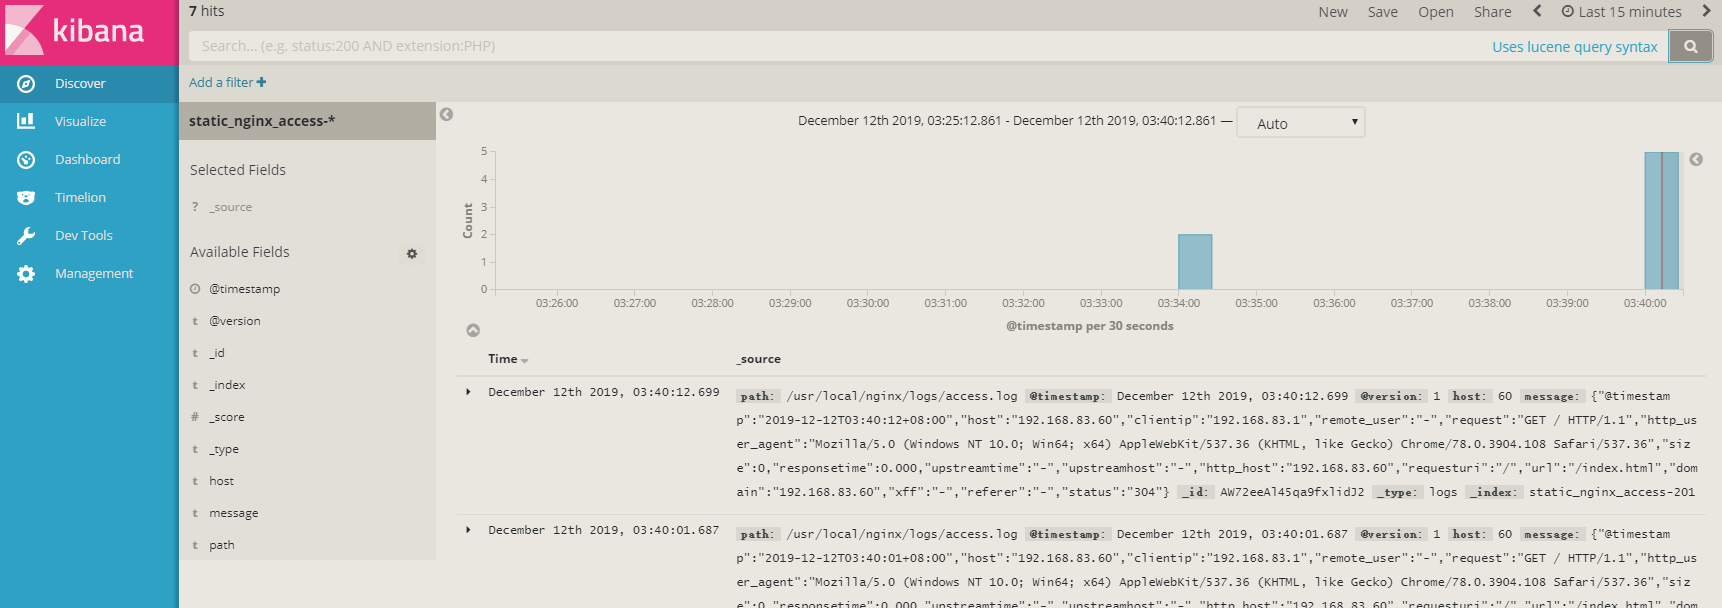
kibana create index
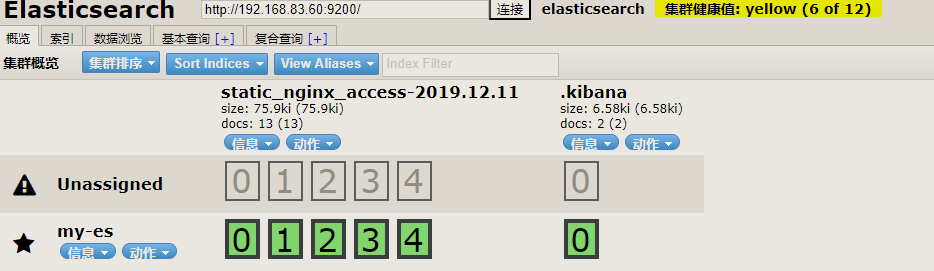
Elasticsearch Head Plugin Installation
Description: An interface-based cluster operation and management tool to perform silly operations on Clusters Displays the topology of the cluster and is able to perform index and node-level operations Search interfaces can query retrieved data in the original json or tabular format in a cluster Ability to quickly access and display the state of a cluster There is an input window that allows any call to the RESTful API.This interface has several options that can be combined to produce interesting results
Official documents: https://github.com/mobz/elasticsearch-head
rpm -vih https://rpm.nodesource.com/pub_10.x/el/7/x86_64/nodejs-10.15.3-1nodesource.x86_64.rpm
npm install -g pm2
cd /usr/local
git clone https://github.com/mobz/elasticsearch-head.git
cd elasticsearch-head/
#Note that executing the following commands requires execution in the elasticsearch-head directory
npm install
npm run start
#Run nohup npm run start &in the background, or you can make a shell start and stop script for npm start and stop
vim /usr/local/elasticsearch/elasticsearch.yml
http.cors.enabled: true        # Enable CORS in elastic search
http.cors.allow-origin: "*"    #Permitted IP Address Segment, * Accessible for all IPs
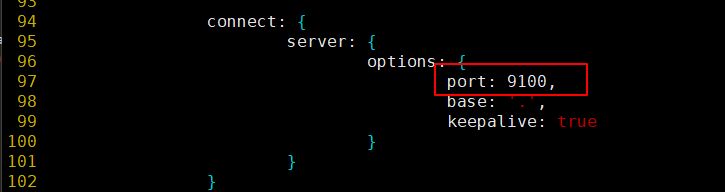
Modify Startup Default Port
vim /usr/local/elasticsearch-head/Gruntfile.js
Modify the ip address of the connection
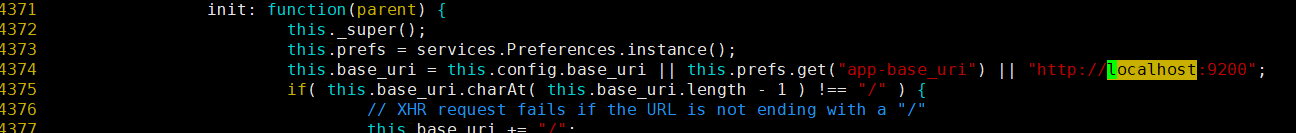
vim /usr/local/elasticsearch-head/_site/app.js
NPM run start & after modification is complete