The following article will teach you to build a simple stock public opinion analysis system, in which you will first crawl the news of the specified stock over a period of time through the financial website, and then use Baidu emotion analysis interface to evaluate the proportion of positive and negative news of the specified stock, so as to determine whether the stock is in a good or bad state.
1. Environmental preparation
Local environment:
Python 3.7
IDE:Pycharm
Library version:
re 2.2.1
lxml 4.6.3
requests 2.24.0
aip 4.15.5
matplotlib 3.2.1
Then, import all the libraries you need:
import requests
import matplotlib.pyplot as plt
import pandas as pd
from lxml import etree
from aip import AipNlp
2. Code implementation
1. Get news data
First, we need to go through the financial community( http://stock.jrj.com.cn/share )Our website crawls for stock news information. The interface form for obtaining news information of specified stocks is:
http://stock.jrj.com.cn/share, stock code, ggxw shtml
 For example: http://stock.jrj.com.cn/share,600381,ggxw.shtml
For example, the news information of 600381 stock is shown in the figure below:
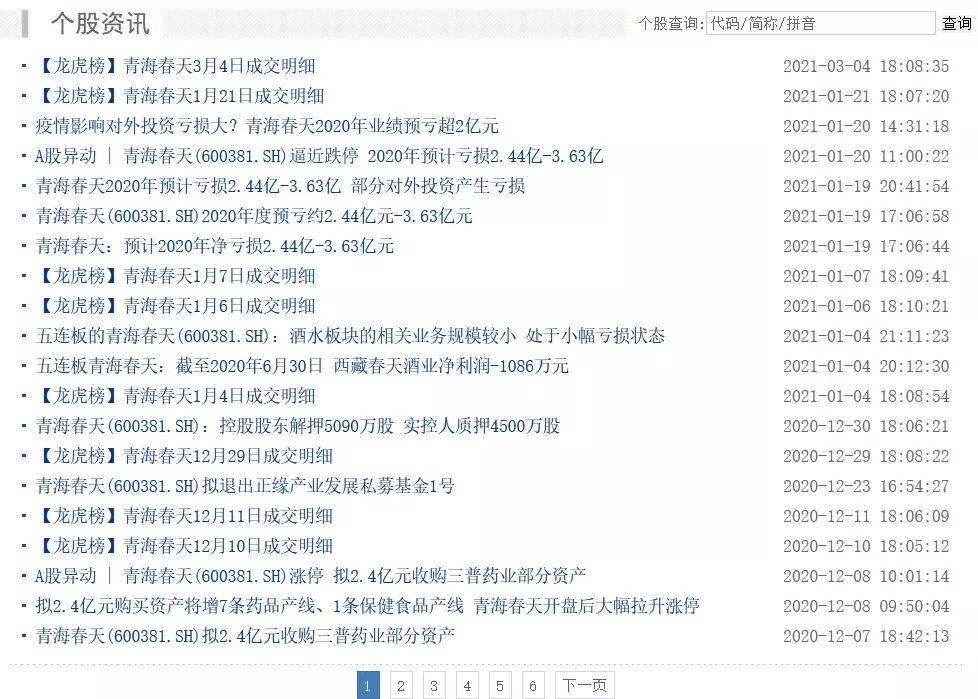
It should be noted that when obtaining the news in the following pages, the interface needs to add a suffix in the following form:
http://stock.jrj.com.cn/share,600381,ggxw_page.shtml
 If you get the second page, http://stock.jrj.com.cn/share,600381,ggxw_2.shtml
First, we define a function to pass in a list of stock codes to represent the codes used to download local stock news. Then the code of each stock is spliced into api and then called parse_. The pages () function is used to crawl the data in the web page under the api.
# Download the news data of the specified stock
def download_news(codes):
    for code in codes:
        print(code)
        url = "http://stock.jrj.com.cn/share," + str(code) + ",ggxw.shtml"
        parse_pages(url, code)
Next, we implement the above parse_ The pages() function. It is necessary to obtain the total number of pages of each page of news data, then splice the corresponding api interface for each page, and finally download the news data of each page.
# Parse data for each page
def parse_pages(url, code):
    max_page = get_max_page(url)
    for i in range(1, max_page + 1):
        if i != 1:
            url = "http://stock.jrj.com.cn/share," + str(code) + ",ggxw_" + str(i) + ".shtml"
        download_page(url, code)
The function to obtain the maximum number of pages is as follows, in which the etree module under lxml is used to parse the html code, and then the maximum number of pages is obtained through regular expression.
# Get the maximum number of page s under url
def get_max_page(url):
    page_data = requests.get(url).content.decode("gbk")
    data_tree = etree.HTML(page_data)
    if page_data.find("page_newslib"):
        max_page = data_tree.xpath("//*[@class=\"page_newslib\"]//a[last()-1]/text()")
        return int(max_page[0])
    else:
        return 1
Next, download is implemented_ Page() function, which matches the news headlines in the page through regular expressions and saves the obtained headline data to a local file.
# Parse the data of the specified page and save it locally
def download_page(url, code):
    try:
        page_data = requests.get(url).content.decode("gbk")
        data_tree = etree.HTML(page_data)
        titles = data_tree.xpath("//*[@class = \"newlist\"]//li/span/a/text()")
        for title in titles:
            title = title + "\r\n"
            with open(str(code) + ".txt", "a") as file:
                file.write(title)
                file.flush()
        return
    except:
        print("server time-out ")
Next, by calling download above_ The news () function and pass in the stock code list that needs to crawl the news to crawl the news data locally.
codes = [600381, 600284, 600570, 600519, 600258, 601179]
download_news(codes)
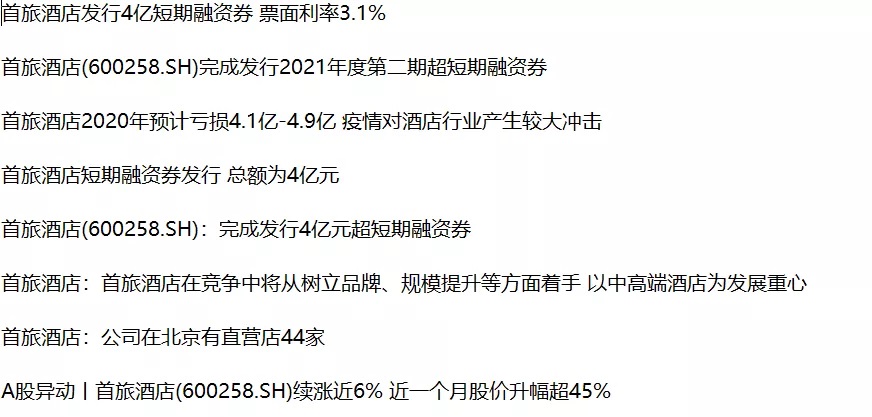
The form of news data obtained is shown in the figure below:
2. News emotion analysis and statistics
After obtaining the news data of the stock, we need to make an emotional analysis of all the news of each stock. aipNLP under Baidu artificial intelligence interface aip is used for natural language processing of all news data and emotional analysis. It should be noted that you need to register and obtain the app before emotional analysis through Baidu artificial intelligence interface_ ID,API_KEY and SECRET_KEY. The method of obtaining is as follows:
First, log in and register Baidu artificial intelligence platform( https://ai.baidu.com/ ):
 Then, find natural language processing in your console and create an application, as shown in the following figure:
 After creation, you can get your own APP_ID,API_KEY and SECRET_KEY, as shown in the figure below:

Next, a function is used to analyze the emotion of the specified stock and save it locally:
# Analyze the emotion of the specified stock and save it locally
def analyze_stocks(codes):
    df = pd.DataFrame()
    for code in codes:
        print(code)
        stock_dict = analyze(code)
        df = df.append(stock_dict, ignore_index=True)
    df.to_csv('./stocks.csv')
The analyze() function is implemented as follows. The previously applied app needs to be_ ID,API_KEY and SECRET_KEY. Then read the file containing all the news of each stock, in which each line represents a news title. Then, conduct Emotional Analysis on each title through aipNLP, count the number of positive news and negative news based on the analysis results, and finally return the analysis results for each stock:
# Conduct emotional analysis and statistics on all news data of designated stocks
def analyze(code):
    APP_ID = 'your app id'
    API_KEY = 'your api key'
    SECRET_KEY = 'your secret key'
    positive_nums = 0
    nagative_nums = 0
    count = 0
    aipNlp = AipNlp(APP_ID, API_KEY, SECRET_KEY)
    lines = open(str(code) + '.txt').readlines()
    for line in lines:
        if not line.isspace():
            line = line.strip()
            try:
                result = aipNlp.sentimentClassify(line)
                positive_prob = result['items'][0]['positive_prob']
                nagative_prob = result['items'][0]['negative_prob']
                count += 1
                if positive_prob >= nagative_prob:
                    positive_nums += 1
                else:
                    nagative_nums += 1
            except:
                pass
    avg_positive = positive_nums / count
    avg_nagative = nagative_nums / count
    print('Stock Code:',code, 'Negative ratio:', avg_nagative, 'Positive ratio:',avg_positive)
    return {'Stock code':code, 'Negative ratio':avg_nagative, 'Positive proportion':avg_positive}
Call the following code to analyze and generate statistical results:
codes = [600381, 600284, 600570, 600519, 600258, 601179]
analyze_stocks(codes)
3. Data visualization
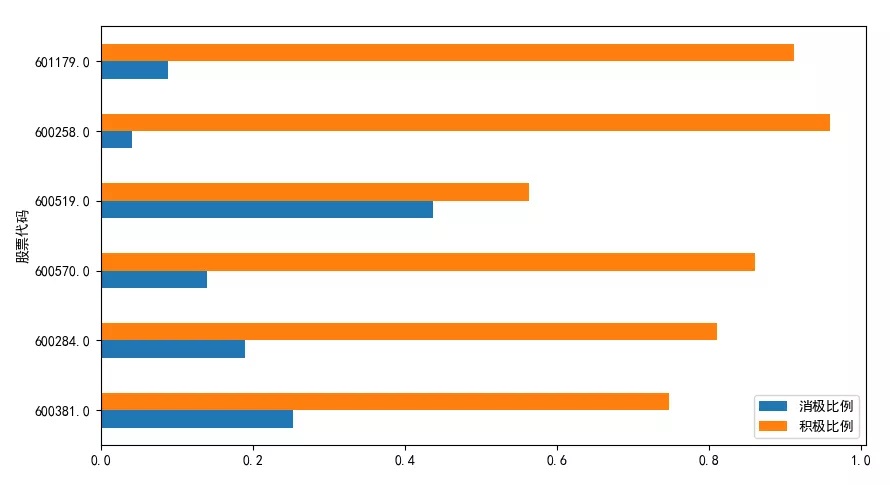
Finally, we visualize the results obtained, and we can intuitively see the proportion of negative news and positive news of each stock.
def show():
    matplotlib.rcParams['font.sans-serif'] = ['SimHei']
    matplotlib.rcParams['axes.unicode_minus'] = False
    df = pd.read_csv('./stocks.csv', index_col='Stock code', usecols=['Stock code', 'Negative ratio','Positive proportion'])
    df.plot(kind='barh', figsize=(10, 8))
    plt.show()
The renderings are as follows:
3. Summary
In this article, we introduce how to build a simple stock public opinion analysis system based on python. First, we will crawl the news of the specified stock for a period of time through the financial website, then analyze the news through Baidu emotion analysis interface, and finally calculate the proportion of positive and negative news of the stock, To determine whether the stock is in a good or bad state. Based on this system, we can further expand to apply.