When it comes to maps, you must be familiar with them. You should have used Baidu maps, Gaode maps, Tencent maps, etc. if map related development needs are involved, there are many choices. For example, the previous maps will provide a set of js API. In addition, there are some open-source map frameworks that can be used, such as OpenLayers, Leaflet, etc.
So have you ever thought about how these maps are rendered? Why can the corresponding map be displayed according to a longitude and latitude? I don't know. It doesn't matter. This paper will take you to implement a simple map engine from zero to help you understand the basic knowledge of GIS and the implementation principle of Web map.
Choose a latitude and longitude
First, let's go to Gaode map and select a latitude and longitude as the center point of our later map. Open it Gaud coordinate picking Tool, select any point:
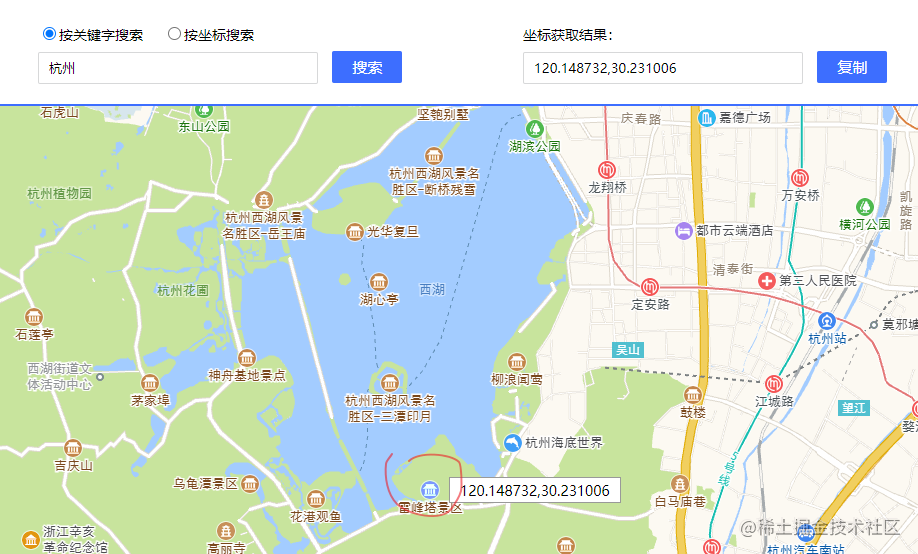
The author chose Leifeng Tower in Hangzhou, with longitude and latitude of [120.148732,30.231006].
Tile url analysis
Map tile we use Gaode's online tile at the following address:
https://webrd0{1-4}.is.autonavi.com/appmaptile?x={x}&y={y}&z={z}&lang=zh_cn&size=1&scale=1&style=8At present, the tile services of major map manufacturers follow different rules:
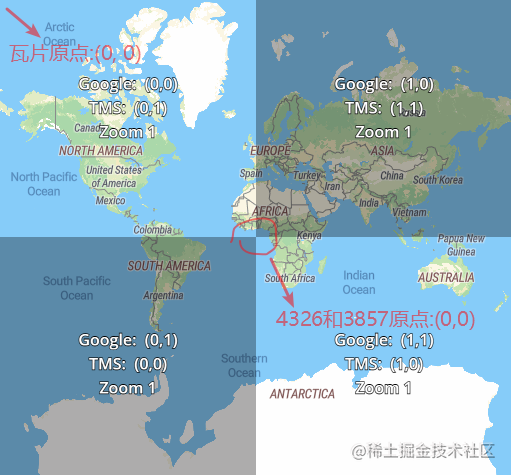
Google XYZ specification: Google map, OpenStreetMap, Gaode map, geoq, sky map, with the coordinate origin in the upper left corner
TMS specification: Tencent map, the coordinate origin is in the lower left corner
WMTS specification: the origin is in the upper left corner. The tiles are not square, but rectangular. This should be the official standard
Baidu map is quite independent. The projection, resolution and coordinate system are different from those of other manufacturers. The origin is at the position where the longitude and latitude are 0, that is, in the middle, the right is the positive X direction and the up is the positive Y direction
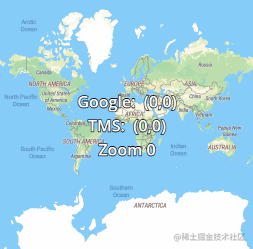
The difference between Google and TMS tiles can be visually viewed through this address: Map tile.
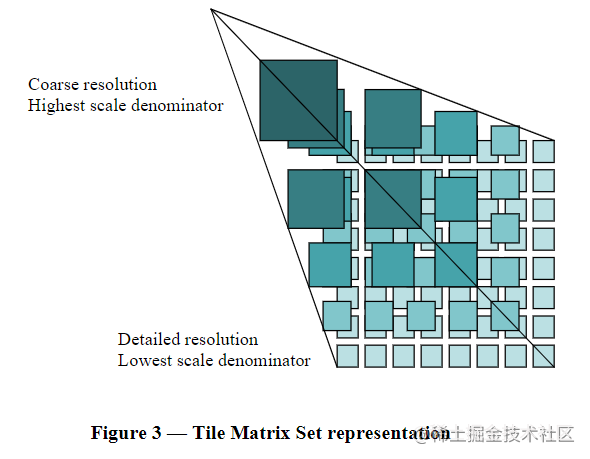
Although the specifications are different, the principles are basically the same. The earth is projected into a huge square world plan, and then cut in layers according to the quadtree. For example, on the first layer, there is only one tile to display the information of the whole world, so basically only the names and boundary lines of continents and seas can be seen. On the second layer, four tiles are cut, A little more information is displayed, and so on. Like a pyramid, the bottom resolution is the highest, the details are the most, the number of tiles is the most, the top resolution is the lowest, the information is few, and the number of tiles is the least:
Calculation formula of tile quantity of each layer:
Math.pow(Math.pow(2, n), 2)// Row * column: 2^n * 2^n
The 18th floor needs 68719476736 tiles, so the overall number of map tiles is very large.
After the tiles are cut, they are saved by row and column number and zoom level, so you can see that there are three variables in the tile address: x, y and z
x: Line number
y: Column number
z: Resolution, generally 0-18
Through these three variables, you can locate a tile. For example, the following address has a row number of 109280, a column number of 53979, and a zoom level of 17:
https://webrd01.is.autonavi.com/appmaptile?x=109280&y=53979&z=17&lang=zh_cn&size=1&scale=1&style=8
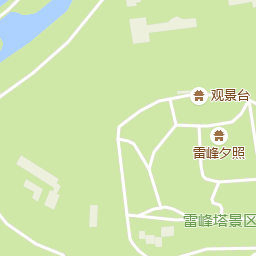
The corresponding tiles are:
More information about tiles can be read Tile Map principle.
Introduction to coordinate system
Gaode map uses GCJ-02 coordinate system, also known as Mars coordinate system, which was released by China National Bureau of Surveying and mapping in 2002. It is encrypted based on GPS coordinates (WGS-84 coordinate system), that is, it adds nonlinear offset to make you uncertain about the real position. For national security, domestic map service providers need to use GCJ-02 coordinate system.
WGS-84 coordinate system is an international standard with EPSG number of EPSG:4326. Generally, the original longitude and latitude obtained by GPS equipment and foreign map manufacturers use WGS-84 coordinate system.
These two coordinate systems are geographical coordinate systems, spherical coordinates, in degrees. This coordinate is convenient for positioning on the earth, but it is not convenient to display and calculate the area distance. We have the impression that the maps are plane, so there is another plane coordinate system. The plane coordinate system is converted from the geographical coordinate system by projection, Therefore, it is also called projection coordinate system, usually in meters. There are many kinds of projection coordinate systems according to different projection methods. In the scene of Web development, Web Mercator projection, numbered EPSG:3857, is usually used. It projects WGS-84 coordinate system into a square based on Mercator projection:
This is achieved by abandoning the areas above the latitude of 85.051129 from north to south. Because it is a square, a large square can be easily divided into smaller squares.
For more detailed information about coordinate system, please refer to Coordinate system of GIS For details of EPSG:3857, please refer to EPSG:3857.
Longitude and latitude positioning line number
In the previous section, we briefly introduced the coordinate system. According to the standard of web map, our map engine also chooses to support EPSG:3857 projection, but what we get through Gaode tool is the longitude and latitude coordinates of Mars coordinate system, so the first step is to convert the longitude and latitude coordinates into Web Mercator projection coordinates. Here, for simplicity, first directly take Mars coordinates as WGS-84 coordinates, Let's look at this later.
The conversion method can be found online:
// Angle to radian
const angleToRad = (angle) => {
    return angle * (Math.PI / 180)
}

// Radian rotation angle
const radToAngle = (rad) => {
    return rad * (180 / Math.PI)
}

// Earth radius
const EARTH_RAD = 6378137

// 4326 to 3857
const lngLat2Mercator = (lng, lat) => {
    // Longitude first turns to radian, and then because radian = arc length / radius, the arc length is arc length = radian * radius
    let x = angleToRad(lng) * EARTH_RAD;
    // Latitude first turn radian
    let rad = angleToRad(lat)
    // Now I can't understand it. Feel free...
    let sin = Math.sin(rad)
    let y = EARTH_RAD / 2 * Math.log((1 + sin) / (1 - sin))
    return [x, y]
}

// 3857 to 4326
const mercatorTolnglat = (x, y) => {
    let lng = radToAngle(x) / EARTH_RAD
    let lat = radToAngle((2 * Math.atan(Math.exp(y / EARTH_RAD)) - (Math.PI / 2)))
    return [lng, lat]
}
3857 coordinates are in meters, so how can they be converted into row and column numbers of tiles? This involves the concept of resolution, that is, how many meters a pixel on the map represents. If the resolution can be obtained from the map manufacturer's documents, it is the best. If it can't be found, You can also make a simple calculation (if you can't use the calculated one, you can only turn to the search engine). We know that the radius of the earth is 6378137 meters. The 3857 coordinate system treats the earth as a round sphere, so you can calculate the circumference of the earth, and the projection is close to the equator of the earth:
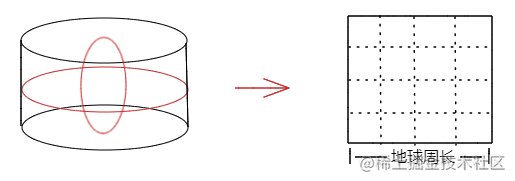
Therefore, the side length of the world plan projected into a square represents the perimeter of the earth. We also know the calculation method of the number of tiles at each level, and the size of a tile is generally 256 * 256 pixels. Therefore, we can know the actual number of meters represented by each pixel on the map by dividing the perimeter of the earth by the side length of the expanded world plan:
// earth circumference
const EARTH_PERIMETER = 2 * Math.PI * EARTH_RAD
// Tile pixel
const TILE_SIZE = 256
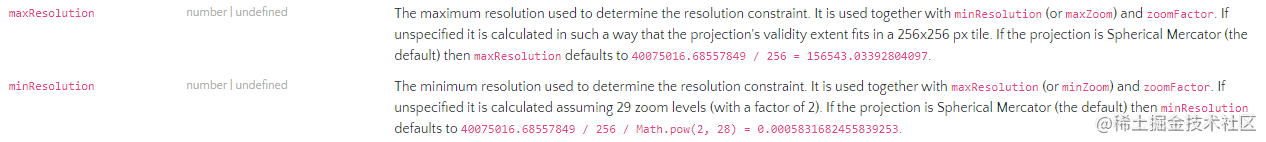
// Gets the resolution at a certain level
const getResolution = (n) => {
const tileNums = Math.pow(2, n)
const tileTotalPx = tileNums * TILE_SIZE
return EARTH_PERIMETER / tileTotalPx
}The circumference of the earth is 40075016.68557849. It can be seen that OpenLayers calculates it in this way:
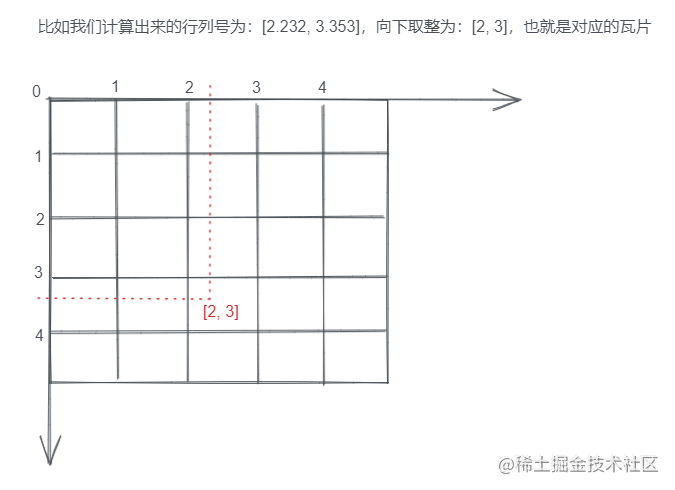
The unit of 3857 coordinates is meter. Then divide the coordinates by the resolution to get the corresponding pixel coordinates, and then divide by 256 to get the row and column number of tiles:
The functions are as follows:
// Calculate tile row and column number according to 3857 coordinates and zoom level
const getTileRowAndCol = (x, y, z) => {
    let resolution = getResolution(z)
    let row = Math.floor(x / resolution / TILE_SIZE)
    let col = Math.floor(y / resolution / TILE_SIZE)
    return [row, col]
}
Next, we fix the level to 17, then the resolution is 1.194328566955879, the longitude and latitude of Leifeng Tower is converted to the coordinates of 3857: [13374895.665697495, 3533278.205310311], and the row and column number calculated by the above function is: [43744, 11556]. We substitute these data into the tile address for access:
https://webrd01.is.autonavi.com/appmaptile?x=43744&y=11556&z=17&lang=zh_cn&size=1&scale=1&style=8
The origin of 4326 and 3857 coordinate systems is at the intersection of the equator and the prime meridian, the sea off Africa, and the origin of tiles is in the upper left corner:
It will be easier to understand by looking at the following figure:
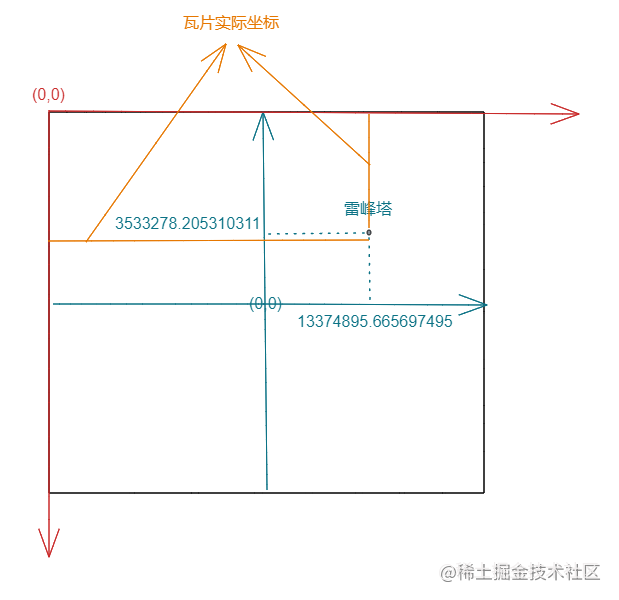
The origin of the 3857 coordinate system is equivalent to the middle of the world plan. The right is the positive direction of the x axis and the up is the positive direction of the y axis, while the origin of the tile map is in the upper left corner. Therefore, we need to calculate the distance of the [orange solid line] according to the distance of the [green dotted line] on the map, which is also very simple. The horizontal coordinate is the length of the horizontal green dotted line plus half of the world plan, The vertical coordinate is half of the world plan minus the length of the vertical green dotted line. Half of the world plan is half of the circumference of the earth. Modify the getTileRowAndCol function:
const getTileRowAndCol = (x, y, z) => {
  x += EARTH_PERIMETER / 2     // ++
  y = EARTH_PERIMETER / 2 - y  // ++
  let resolution = getResolution(z)
  let row = Math.floor(x / resolution / TILE_SIZE)
  let col = Math.floor(y / resolution / TILE_SIZE)
  return [row, col]
}
The calculated tile row and column number is [109280, 53979], which is substituted into the tile address:
https://webrd01.is.autonavi.com/appmaptile?x=109280&y=53979&z=17&lang=zh_cn&size=1&scale=1&style=8
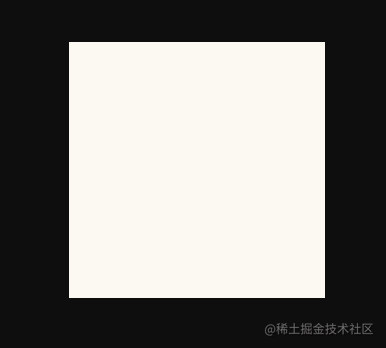
The results are as follows:
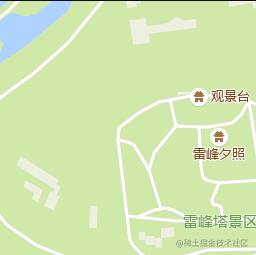
You can see Leifeng Tower coming out.
Tile display position calculation
We can now find the corresponding tiles according to a longitude and latitude, but this is not enough. Our goal is to display them in the browser, which needs to solve two problems: one is how many tiles are loaded, and the other is to calculate the display position of each tile.
When rendering tiles, we use canvas canvas, and the template is as follows:
<template>
  <div class="map" ref="map">
    <canvas ref="canvas"></canvas>
  </div>
</template>
The size of the map canvas container map can be easily obtained:
// Container size
let { width, height } = this.$refs.map.getBoundingClientRect()
this.width = width
this.height = height
// Set canvas size
let canvas = this.$refs.canvas
canvas.width = width
canvas.height = height
// Get drawing context
this.ctx = canvas.getContext('2d')
The center point of the map is located in the middle of the canvas. In addition, the longitude and latitude center and zoom level zoom of the center point are also known because they are set by ourselves. Then we can calculate the tile corresponding to the center coordinate:
// Tiles corresponding to the center point
let centerTile = getTileRowAndCol(
    ...lngLat2Mercator(...this.center),// 4326 to 3857
    this.zoom// Zoom level
)
The zoom level is still set to 17, and the center point still uses the longitude and latitude of Leifeng Tower, so the corresponding tile row and column number has been calculated earlier, which is [109280, 53979].
If we know the tile row and column number corresponding to the center coordinate, we can also know the pixel position of the upper left corner of the tile in the world plan:
// Pixel coordinates corresponding to the upper left corner of the center tile
let centerTilePos = [centerTile[0] * TILE_SIZE, centerTile[1] * TILE_SIZE]
Calculated as [27975680, 13818624]. How to convert this coordinate to the screen? Please see the figure below:
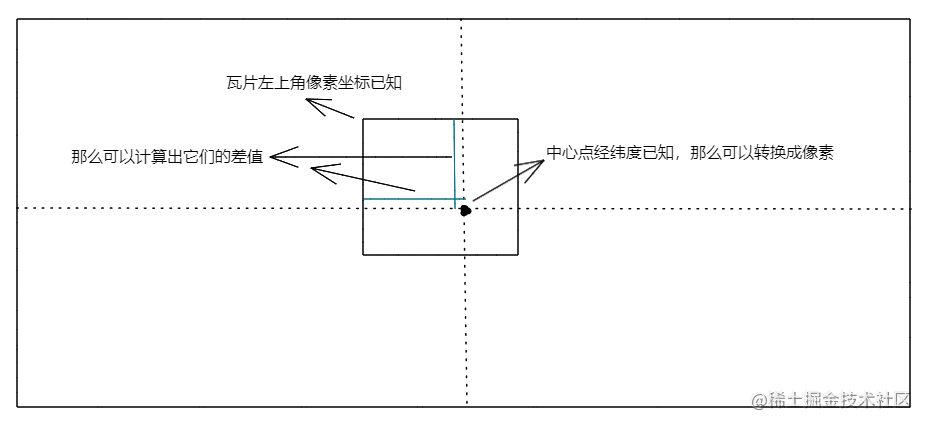
We have calculated the tile of the central longitude and latitude, and we know the pixel coordinates of the upper left corner of the tile. Then we can calculate the pixel coordinates corresponding to the central longitude and latitude itself, and the difference with the upper left corner of the tile can be calculated, Finally, we move the origin of the canvas to the middle of the canvas (the default origin of the canvas is the upper left corner, the positive direction of the x axis is right, and the positive direction of the y axis is down), that is, take the central longitude and latitude as the coordinate origin, and the display position of the central tile is the difference.
Add the method of converting longitude and latitude into pixels:
// Calculate the pixel coordinates corresponding to 4326 longitude and latitude
const getPxFromLngLat = (lng, lat, z) => {
  let [_x, _y] = lngLat2Mercator(lng, lat)// 4326 to 3857
  // Convert to world plan coordinates
  _x += EARTH_PERIMETER / 2
  _y = EARTH_PERIMETER / 2 - _y
  let resolution = resolutions[z]// Resolution at this level
  // M / resolution to get pixels
  let x = Math.floor(_x / resolution)
  let y = Math.floor(_y / resolution)
  return [x, y]
}
Calculate the pixel coordinates corresponding to the longitude and latitude of the center:
// Pixel coordinates corresponding to the center point
let centerPos = getPxFromLngLat(...this.center, this.zoom)
Calculated difference:
// The difference between the coordinates of the central pixel and the upper left corner of the central tile
let offset = [
    centerPos[0] - centerTilePos[0],
    centerPos[1] - centerTilePos[1]
]
Finally, use canvas to render the central tile:
// Move the canvas origin to the middle of the canvas
this.ctx.translate(this.width / 2, this.height / 2)
// Load tile picture
let img = new Image()
// Splice tile address
img.src = getTileUrl(...centerTile, this.zoom)
img.onload = () => {
    // Render to canvas
    this.ctx.drawImage(img, -offset[0], -offset[1])
}
Let's take a look at the implementation of getTileUrl method:
// Splice tile address
const getTileUrl = (x, y, z) => {
  let domainIndexList = [1, 2, 3, 4]
  let domainIndex =
    domainIndexList[Math.floor(Math.random() * domainIndexList.length)]
  return `https://webrd0${domainIndex}.is.autonavi.com/appmaptile?x=${x}&y=${y}&z=${z}&lang=zh_cn&size=1&scale=1&style=8`
}
There are four sub domains randomly: webrd01, webrd02, webrd03 and webrd04. This is because the browser has a limit on the number of resources requested for the same domain name at the same time. When the map level becomes larger, the number of tiles to be loaded will be more. Then the request can be evenly distributed to each sub domain to render all tiles faster and reduce the queuing time, Basically, the tile service addresses of all map manufacturers support multiple sub domains.
In order to easily see the position of the center point, we render two additional center auxiliary lines. The effect is as follows:
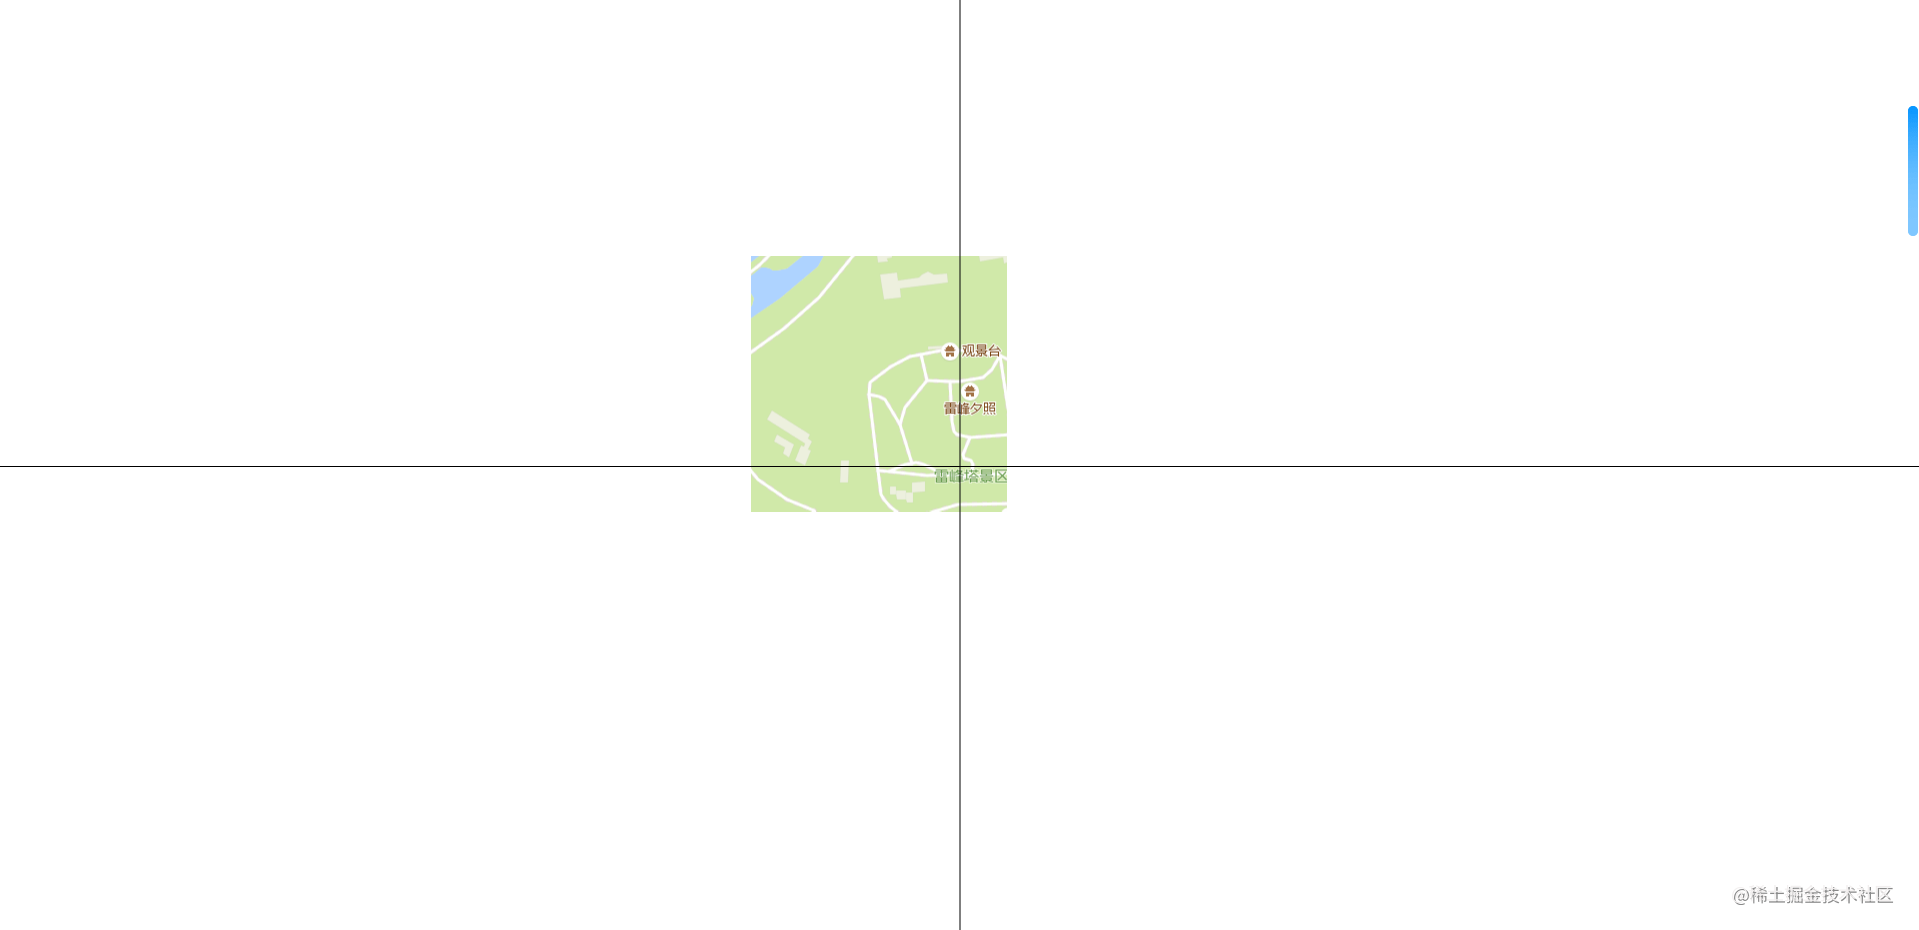
It can be seen that the central point is indeed Leifeng Tower. Of course, it only renders the central tile. What we want is that the tiles are spread all over the canvas. For other tiles, we can calculate according to the central tile, such as the one on the left of the central tile. Its calculation is as follows:
// Tile row and column number, row number minus 1, column number unchanged
let leftTile = [centerTile[0] - 1, centerTile[1]]
// Tile display coordinates, x-axis subtracts the size of a tile, and y-axis remains unchanged
let leftTilePos = [
    offset[0] - TILE_SIZE * 1,
    offset[1]
]
Therefore, we only need to calculate how many tiles are required in each of the four directions of the central tile, and then use a double cycle to calculate all the tiles required for the canvas. It is very simple to calculate the number of tiles required. Please see the following figure:
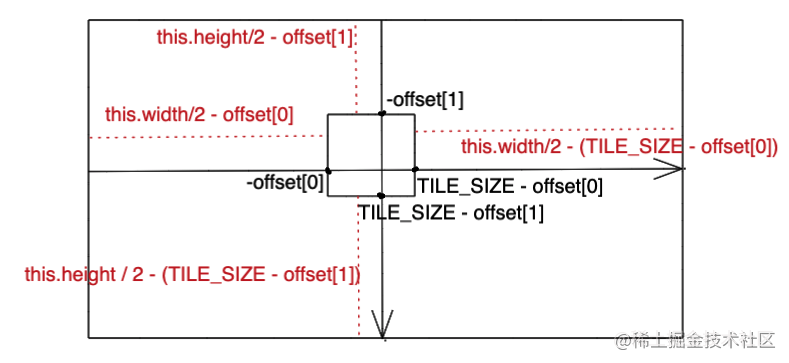
The remaining space in this direction can be obtained by subtracting the space occupied by the central tile from half of the width and height of the canvas, and then divided by the size of the tile to know how many tiles are needed:
// Calculate the number of tiles
let rowMinNum = Math.ceil((this.width / 2 - offset[0]) / TILE_SIZE)// Left
let colMinNum = Math.ceil((this.height / 2 - offset[1]) / TILE_SIZE)// upper
let rowMaxNum = Math.ceil((this.width / 2 - (TILE_SIZE - offset[0])) / TILE_SIZE)// right
let colMaxNum = Math.ceil((this.height / 2 - (TILE_SIZE - offset[1])) / TILE_SIZE)// lower
We take the central tile as the origin and the coordinates are [0,0], and we can render all tiles by double cycle scanning:
// Load tiles from top to bottom and from left to right
for (let i = -rowMinNum; i <= rowMaxNum; i++) {
    for (let j = -colMinNum; j <= colMaxNum; j++) {
        // Load tile picture
        let img = new Image()
        img.src = getTileUrl(
            centerTile[0] + i,// Line number
            centerTile[1] + j,// Column number
            this.zoom
        )
        img.onload = () => {
            // Render to canvas
            this.ctx.drawImage(
                img,
                i * TILE_SIZE - offset[0],
                j * TILE_SIZE - offset[1]
            )
        }
    }
}
The effects are as follows:
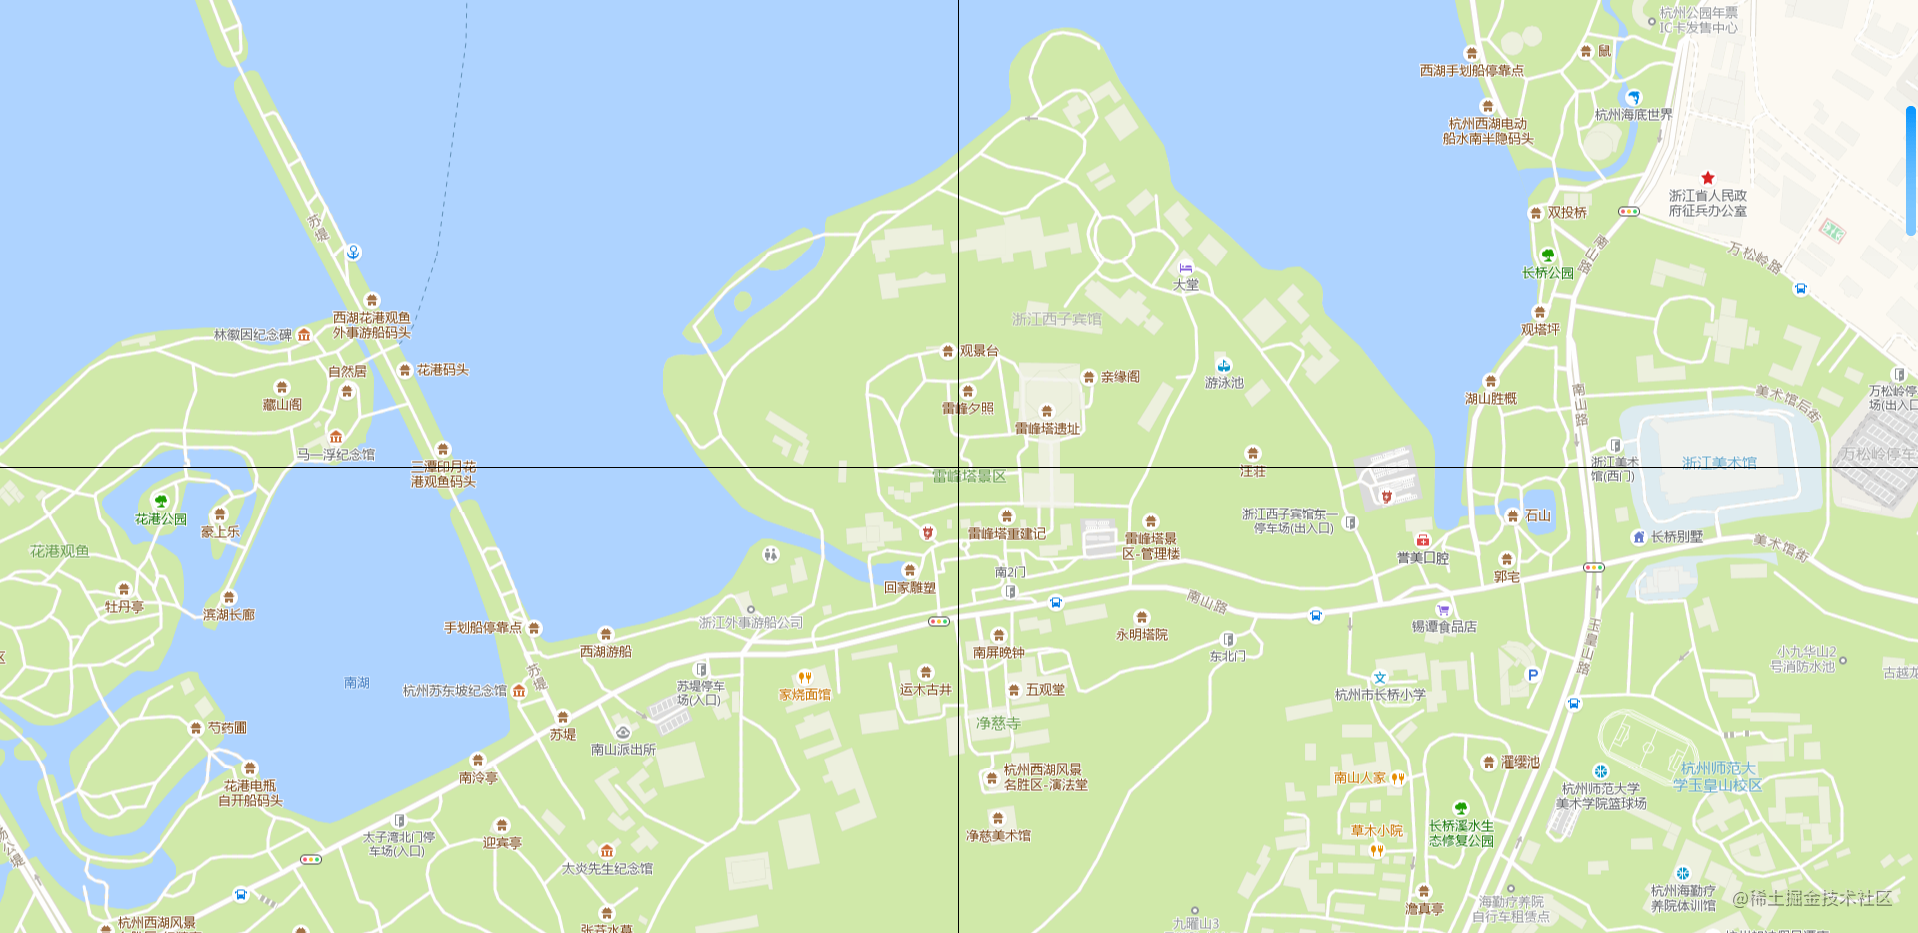
It's perfect.
drag
Dragging can be considered in this way. We have realized the rendering of tiles with specified latitude and longitude. When we press and hold to drag, we can know the sliding distance of the mouse, and then convert the distance, that is, the pixel, into the value of latitude and longitude. Finally, we update the latitude and longitude of the current center point, empty the canvas, and call the previous method to re render, Constant redrawing creates a visual illusion that is moving.
Listen for mouse related events:
<canvas ref="canvas" @mousedown="onMousedown"></canvas>
export default {
    data(){
        return {
            isMousedown: false
        }
    },
    mounted() {
        window.addEventListener("mousemove", this.onMousemove);
        window.addEventListener("mouseup", this.onMouseup);
    },
    methods: {
        // Mouse down
        onMousedown(e) {
            if (e.which === 1) {
                this.isMousedown = true;
            }
        },

        // Mouse movement
        onMousemove(e) {
            if (!this.isMousedown) {
                return;
            }
            // ...
        },

        // Mouse release
        onMouseup() {
            this.isMousedown = false;
        }
    }
}
Calculate the center longitude and latitude after dragging in the onMousemove method and re render the canvas:
// Calculate the longitude and latitude data corresponding to the drag distance
let mx = e.movementX * resolutions[this.zoom];
let my = e.movementY * resolutions[this.zoom];
// Convert the longitude and latitude of the current center point to 3857 coordinates
let [x, y] = lngLat2Mercator(...this.center);
// Updates the latitude and longitude of the dragged center point
center = mercatorToLngLat(x - mx, my + y);
The movementX and movementY attributes can obtain the movement values in this and last mouse events. The compatibility is not very good, but it is also very simple to calculate the value yourself. Please move on for details MDN . Multiply the current resolution to convert the pixel into meters, then convert the longitude and latitude of the current center point into meter coordinates of 3857, offset the moving distance, and finally turn back to the longitude and latitude coordinates of 4326 as the updated center point.
Why is x minus and y plus? It's very simple. When we move the mouse to the right and down, the distance is positive, and the corresponding map will move to the right or down. The right and up of the 4326 coordinate system are positive directions. When the map moves to the right, the center point obviously moves to the left. Because the right is the positive direction, the longitude direction of the center point is reduced, Therefore, the moving distance is subtracted. When the map moves downward, the center point moves upward relatively. Because the upward direction is a positive direction, the latitude direction of the center point is increased, so the moving distance is added.
After updating the center latitude and longitude, empty the canvas and draw again:
// Empty canvas
this.clear();
// Redrawing, the renderTiles method is the code logic encapsulation in the previous section
this.renderTiles();
The effects are as follows:
We can see that it is messy. Why? In fact, the picture loading is an asynchronous process. When we move the mouse, we will constantly calculate the tiles to be loaded for loading, but the last batch of tiles may not be loaded yet. The mouse has moved to a new position, and a new batch of tiles will be calculated for loading, At this time, the previous batch of tiles may have been loaded and rendered, but some of these tiles may have been removed from the canvas and do not need to be displayed, and some may still be in the canvas, but the previous position is used, and the rendering is also wrong. At the same time, a new batch of tiles may also be loaded and rendered, which naturally leads to the confusion of the final display.
It's easy to know the reason. First, we add a cache object, because during the drag process, many tiles only change their position and do not need to be reloaded. The same tile is loaded once, and then only its position can be updated; In addition, set another object to record the tiles that should be displayed on the current canvas to prevent rendering of tiles that should not appear:
{
    // Cache tile
    tileCache: {},
    // Record the tiles needed on the current canvas
    currentTileCache: {}
}
Because we need to record the location, loading status and other information of tiles, we create a tile class:
// Tiles
class Tile {
  constructor(opt = {}) {
    // Canvas context
    this.ctx = ctx
    // Tile row number
    this.row = row
    this.col = col
    // Tile level
    this.zoom = zoom
    // Display location
    this.x = x
    this.y = y
    // A function that determines whether a tile should be rendered
    this.shouldRender = shouldRender
    // Tile url
    this.url = ''
    // Cache key
    this.cacheKey = this.row + '_' + this.col + '_' + this.zoom
    // picture
    this.img = null
    // Is the picture loading complete
    this.loaded = false

    this.createUrl()
    this.load()
  }

  // Generate url
  createUrl() {
    this.url = getTileUrl(this.row, this.col, this.zoom)
  }

  // Load picture
  load() {
    this.img = new Image()
    this.img.src = this.url
    this.img.onload = () => {
      this.loaded = true
      this.render()
    }
  }

  // Render the picture to canvas
  render() {
    if (!this.loaded || !this.shouldRender(this.cacheKey)) {
      return
    }
    this.ctx.drawImage(this.img, this.x, this.y)
  }

  // Update location
  updatePos(x, y) {
    this.x = x
    this.y = y
    return this
  }
}
Then modify the logic of the previous double loop rendering tile:
this.currentTileCache = {}// Empty cache object
for (let i = -rowMinNum; i <= rowMaxNum; i++) {
    for (let j = -colMinNum; j <= colMaxNum; j++) {
        // Row and column number of the current tile
        let row = centerTile[0] + i
        let col = centerTile[1] + j
        // Display position of the current tile
        let x = i * TILE_SIZE - offset[0]
        let y = j * TILE_SIZE - offset[1]
        // Cache key
        let cacheKey = row + '_' + col + '_' + this.zoom
        // Record the tiles currently needed for the canvas
        this.currentTileCache[cacheKey] = true
        // The tile has been loaded
        if (this.tileCache[cacheKey]) {
            // Update to current location
            this.tileCache[cacheKey].updatePos(x, y).render()
        } else {
            // Not loaded
            this.tileCache[cacheKey] = new Tile({
                ctx: this.ctx,
                row,
                col,
                zoom: this.zoom,
                x,
                y,
                // Judge whether the tile is on the current canvas cache object. If yes, it means it needs to be rendered
                shouldRender: (key) => {
                    return this.currentTileCache[key]
                },
            })
        }
    }
}
The effects are as follows:
It can be seen that dragging is normal. Of course, the above implementation is still very rough, and there are many areas that need to be optimized, such as:
1. Generally, it will be arranged first, and the central tiles will be loaded first
2. More and more tiles in the cache will certainly affect the performance, so some cleaning strategies are needed
Those interested in these questions can think for themselves.
zoom
Drag to update the longitude and latitude of the center point in real time, then zoom to update the zoom level naturally:
export default {
    data() {
        return {
            // Zoom level range
            minZoom: 3,
            maxZoom: 18,
            // Anti shake timer
            zoomTimer: null
        }
    },
    mounted() {
        window.addEventListener('wheel', this.onMousewheel)
    },
    methods: {
        // Mouse scrolling
        onMousewheel(e) {
            if (e.deltaY > 0) {
                // The level becomes smaller
                if (this.zoom > this.minZoom) this.zoom--
            } else {
                // The level becomes larger
                if (this.zoom < this.maxZoom) this.zoom++
            }
            // Add an anti shake to prevent rapid rolling loading of tiles in the middle process
            this.zoomTimer = setTimeout(() => {
                this.clear()
                this.renderTiles()
            }, 300)
        }
    }
}
The effects are as follows:
The function is yes, but the effect is very general, because the map zooming we usually use has a transition animation of zooming in or out, and this is directly blank and then re rendered. We don't know whether to zoom in or out without looking carefully.
So we might as well add a transition effect. When we scroll with the mouse, first enlarge or reduce the canvas, and then render the required tiles according to the final scaling value after the animation.
The default zoom value of the canvas is 1. When zooming in, it is multiplied by 2, when zooming out, it is divided by 2, and then it is animated to the target value. During the animation, set the zoom value of the canvas, empty the canvas, and repaint the existing tiles on the canvas to achieve the visual effect of zooming in or out. After the animation, call renderTiles to re render the tiles required for the final zoom value.
// Animation uses the popmotion library, https://popmotion.io/
import { animate } from 'popmotion'

export default {
    data() {
        return {
            lastZoom: 0,
            scale: 1,
            scaleTmp: 1,
            playback: null,
        }
    },
    methods: {
        // Mouse scrolling
        onMousewheel(e) {
            if (e.deltaY > 0) {
                // The level becomes smaller
                if (this.zoom > this.minZoom) this.zoom--
            } else {
                // The level becomes larger
                if (this.zoom < this.maxZoom) this.zoom++
            }
            // The hierarchy has not changed
            if (this.lastZoom === this.zoom) {
                return
            }
            this.lastZoom = this.zoom
            // Update the scale, that is, the target scale value
            this.scale *= e.deltaY > 0 ? 0.5 : 2
            // Stop the last animation
            if (this.playback) {
                this.playback.stop()
            }
            // Turn on animation
            this.playback = animate({
                from: this.scaleTmp,// Current zoom value
                to: this.scale,// Target scaling value
                onUpdate: (latest) => {
                    // Updates the current zoom value in real time
                    this.scaleTmp = latest
                    // There are two reasons for the status before saving the canvas:
                    // 1. The scale method will be superimposed on the previous state. For example, the initial value is 1.scale(2,2) is executed for the first time, and scale(3,3) is executed for the second time. The final scaling value is not 3, but 6. Therefore, the state is restored after each scaling, which is equivalent to scaling from the initial value 1 every time. The effect is right
                    // 2. Ensure that the scaling effect only takes effect on the re rendering of existing tiles and will not affect the final renderTiles()
                    this.ctx.save()
                    this.clear()
                    this.ctx.scale(latest, latest)
                    // Refreshes the tiles on the current canvas
                    Object.keys(this.currentTileCache).forEach((tile) => {
                        this.tileCache[tile].render()
                    })
                    // Restore to the state before canvas
                    this.ctx.restore()
                },
                onComplete: () => {
                    // Reset the scale value to 1 when the animation is complete
                    this.scale = 1
                    this.scaleTmp = 1
                    // Recalculate the tiles you need based on the final scaling value and render
                    this.renderTiles()
                },
            })
        }
    }
}
The effects are as follows:
Although the effect is still general, at least you can see whether it is zooming in or out.
Coordinate system conversion
There is also a small problem left in the front, that is, we directly regard the longitude and latitude selected on Gaode tool as 4326 longitude and latitude. As mentioned earlier, there is an offset between them. For example, the longitude and latitude obtained by mobile phone GPS is generally 84 coordinates. If it is directly displayed on Gaode map, it will be different from your actual position, so it needs to be converted, There are some tools that can help you do something, such as Gcoord,coordtransform Wait.
summary
The above effect looks general. In fact, as long as you add a little tile fade out animation on the basis of the above, the effect will be much better. At present, canvas is generally used to render 2D maps. If it is not convenient to realize animation by yourself, there are also some powerful canvas Libraries to choose from. The author finally uses it Konva.js A new version of the library is redone with tile fade out animation. The final effect is as follows:
In addition, as long as we understand the tile rules of each map, we can slightly modify and support more map tiles:

The specific implementation is limited to space and will not be expanded. Those who are interested can read the source code of this article.
This paper introduces a simple web map development process in detail. The above implementation principle is only the author's personal idea and does not represent the principle of openlayers and other frameworks. Because the author is also a beginner of GIS, it is inevitable that there will be problems or better implementation. Welcome to point out.
Online demo: https://wanglin2.github.io/web_map_demo/
Complete source code: https://github.com/wanglin2/web_map_demo