background
The previous articles are all about the low code platform mentioned earlier.
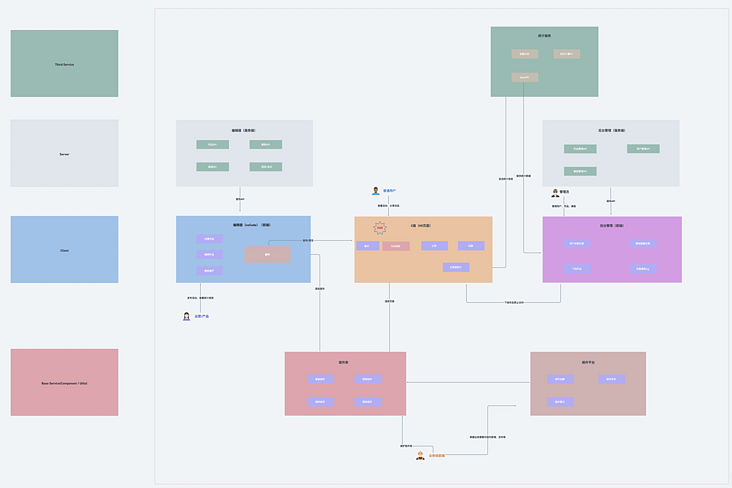
This large project takes low code as the core, including nine systems: Editor front end, editor back end, C-end H5, component library, component platform, background management system front end, background management system back end, statistical service and self-developed CLI.
Let's talk about the statistical service today: the purpose is to realize the sub channel statistics of H5 page (in fact, it's not just sub channel statistics, the core is to make a user-defined event statistics service, but there is a demand for sub channel statistics), and check the PV of each channel prop body. (the details will be reflected on the url, with page name, id, channel type, etc.)
Let's start with the overall flow chart:
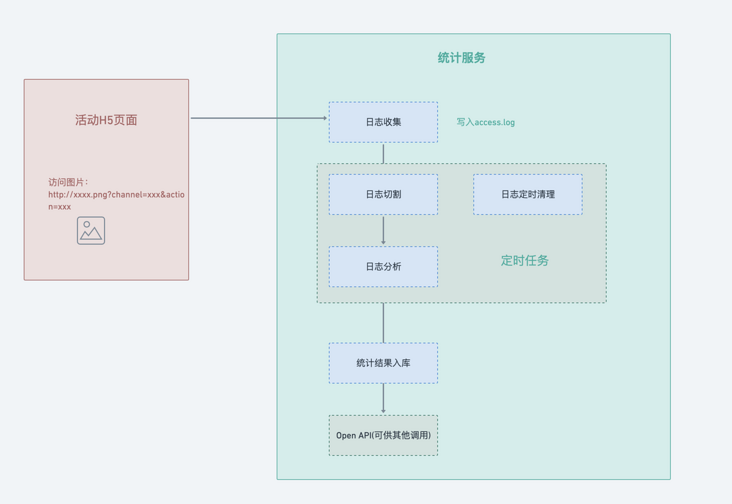
Log collection
The common log collection methods include manual buried point and automatic buried point. Here, we don't focus on how to collect logs, but how to send the collected logs to the server.
In common buried point schemes, sending buried point requests through pictures is often adopted, which has many advantages:
- No cross domain
- Small volume
- Able to complete the entire HTTP request + response (although no response content is required)
- No blocking during execution
The solution here is to put a 1px * 1px static picture on nginx, and then access the picture( http://xxxx.png?env=xx&event=xxx ), and put the buried point data on the query parameter to drop the buried point data into the nginx log.
The url length of get request will be limited on iOS, but we will not send too much data in the real scene, so this scheme is adopted for the time being
Here is a brief explanation of why the query key of the picture address should be designed in this way. If it is only for the purpose of counting channels and works, it is likely to design the key as channel and workId. However, as mentioned above, we want to make a custom event statistics service, so we should consider the scalability of the field and the field should have more general semantics. Therefore, we refer to the design of many statistical services. The fields used here are:
- env
- event
- key
- value
After that, nginx will automatically log to access every time you visit the page_ Log.
With logs, let's take a look at how to split them.
Log split
Why split logs
access. By default, the log will not be split, but will accumulate more and more, and the space of the system disk will be consumed more and more. In the future, it may face the problems of log write failure and abnormal service.
There are too many log files, which will make it difficult for subsequent troubleshooting and analysis.
Therefore, it is necessary and necessary to split the log.
How to split logs
The core idea of splitting logs here is to add the current access Log copy a new log file and then empty the old log file.
Depending on the traffic (the greater the traffic, the faster the log files accumulate), split it by day, hour and minute. You can split access.log into a folder by day.
log_by_day/2021-12-19.log
log_by_day/2021-12-20.log
log_by_day/2021-12-21.log
However, the above copy - > empty operation must be processed automatically. Here, you need to start a scheduled task at a fixed time every day (I'm here at 00:00 a.m. every day).
Timed task
In fact, scheduled tasks are used not only in log splitting, but also in log analysis and log clearing. Here is a brief introduction, and finally the splitting, analysis and clearing will be integrated.
The cron process built in linux is used to handle scheduled tasks. In node, we usually use node schedule or cron to handle scheduled tasks.
What is used here is cron:
/**
    cron Timing rule https://www.npmjs.com/package/cron
    *    *    *    *    *    *
    ┬    ┬    ┬    ┬    ┬    ┬
    │    │    │    │    │    │
    │    │    │    │    │    └ day of week (0 - 6) (Sun-Sat)
    │    │    │    │    └───── month (1 - 12)
    │    │    │    └────────── day of month (1 - 31)
    │    │    └─────────────── hour (0 - 23)
    │    └──────────────────── minute (0 - 59)
    └───────────────────────── second (0 - 59)
 */
The specific use method will not be explained.
code
With the above reserves, let me write this code. First, sort out the logic:
one ️⃣ Read the source file access log
two ️⃣ Create a split folder (it needs to be created automatically if it does not exist)
three ️⃣ Create a log file (day dimension, which needs to be created automatically if it does not exist)
four ️⃣ Copy source log to new file
five ️⃣ Empty access log
/**
 * Split log file
 *
 * @param {*} accessLogPath
 */
function splitLogFile(accessLogPath) {
  const accessLogFile = path.join(accessLogPath, "access.log");

  const distFolder = path.join(accessLogPath, DIST_FOLDER_NAME);
  fse.ensureDirSync(distFolder);

  const distFile = path.join(distFolder, genYesterdayLogFileName());
  fse.ensureFileSync(distFile);
  fse.outputFileSync(distFile, ""); // To prevent repetition, empty it first

  fse.copySync(accessLogFile, distFile);

  fse.outputFileSync(accessLogFile, "");
}
Log analysis
Log analysis is to read the files split in the previous step, and then process and drop them according to certain rules. Here is a very important point to mention: when node processes large files or unknown memory file sizes, do not use readFile, which will break the V8 memory limit. Considering this situation, the way to read the log file here should be: createReadStream creates a readable stream to readline Line by line read processing
readline
The readline module provides an interface for reading data one line at a time from a readable stream. You can access it in the following ways:
const readline = require("readline");The use of readline is also very simple: create an interface instance and pass in the corresponding parameters:
const readStream = fs.createReadStream(logFile);
const rl = readline.createInterface({
  input: readStream,
});
Then listen to the corresponding event:
rl.on("line", (line) => {
  if (!line) return;

  // Get url query
  const query = getQueryFromLogLine(line);
  if (_.isEmpty(query)) return;

  // Cumulative logic
  // ...
});
rl.on("close", () => {
  // After reading line by line, it is stored in the database
  const result = eventData.getResult();
  resolve(result);
});
line and close events are used here:
- Line event: the 'line' event is triggered whenever the input stream receives end of line input (\ n, \ r or \ r\n)
- close event: this event is usually triggered at the end of transmission
Analyze log results line by line
After understanding the use of readline, let's analyze the log results line by line.
First, let's take a look at access Log format in log:
Let's take one of the lines to analyze:
127.0.0.1 - - [19/Feb/2021:15:22:06 +0800] "GET /event.png?env=h5&event=pv&key=24&value=2 HTTP/1.1" 200 5233 "-" "Mozilla/5.0 (Macintosh; Intel Mac OS X 11_0_1) AppleWebKit/537.36 (KHTML, like Gecko) Chrome/88.0.4324.150 Safari/537.36" "-"
What we need to get is the query part of the url, that is, the data we customized in h5.
By regular matching:
const reg = /GET\s\/event.png\?(.+?)\s/;
const matchResult = line.match(reg);
console.log("matchResult", matchResult);

const queryStr = matchResult[1];
console.log("queryStr", queryStr);
The print result is: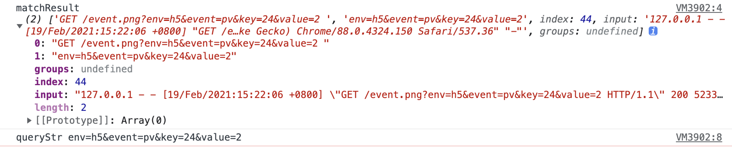
queryStr can be through querystring. In node Parse() to handle:
const query = querystring.parse(queryStr);

console.log('query', query)
{
  env: 'h5',
  event: 'pv',
  key: '24',
  value: '2'
}
The rest is to accumulate the data.
However, we need to think about how to do accumulation. At the beginning, we also said to do sub channel statistics, so the final results should clearly see two data:
- Data from all channels
- Separate data for each channel
Only such data is valuable for operation, and the quality of the data directly determines the strength of investment in each channel.
Here I refer to the in Google Analytics Multichannel funnel Record the data of each dimension from top to bottom, so that you can clearly know the situation of each channel.
The specific implementation is not troublesome. Let's take a look at the useful data just obtained from a link:
{
  env: 'h5',
  event: 'pv',
  key: '24',
  value: '2'
}
Env here represents the environment. All statistics here are from h5 pages, so env is h5. However, this field is set for expansion.
Event indicates the name of the event. It is mainly used to count the traffic, so it is pv.
key is the work id.
value is code, which is tiktok: 1- WeChat, 2- little red book, 3- shake.
Let's look at the final statistical results:
{
  date: '2021-12-21',
  key: 'h5',
  value: { num: 1276}
}
{
  date: '2021-12-21',
  key: 'h5.pv',
  value: { num: 1000}
}
{
  date: '2021-12-21',
  key: 'h5.pv.12',
  value: { num: 200}
}
{
  date: '2021-12-21',
  key: 'h5.pv.12.1',
  value: { num: 56}
}
{
  date: '2021-12-21',
  key: 'h5.pv.12.2',
  value: { num: 84}
}
{
  date: '2021-12-21',
  key: 'h5.pv.12.3',
  value: { num: 60}
}
This is the data intercepted on December 21, 2021. I'll analyze it for you:
one ️⃣ h5: the total number of custom event reports on the h5 page of the day is 1276
two ️⃣ h5.pv: all pv (i.e. h5.pv) is 1000
three ️⃣ h5.pv.12: There are 200 PVS with work id 12
four ️⃣ h5.pv.12.1: if the work id is 12, the PV in wechat channel is 56
five ️⃣ h5.pv.12.2: if the work id is 12, the PV in xiaohongshu channel is 84
six ️⃣ h5.pv.12.2: the PV of the id in tiktok channel is 12, 60.
In this way, we can clearly get the access of a work in a certain channel one day, and then make a visual report based on these data, and the effect will be clear at a glance.
Statistics result warehousing
At present, this part of the data is placed in mongoDB. I won't expand on the use of mongoDB in node. For those unfamiliar, please refer to another article Koa2+MongoDB+JWT actual combat -- Restful API best practice
Paste the model here:
/**
 * @description event data model
 */
const mongoose = require("../db/mongoose");

const schema = mongoose.Schema(
  {
    date: Date,
    key: String,
    value: {
      num: Number,
    },
  },
  {
    timestamps: true,
  }
);

const EventModel = mongoose.model("event_analytics_data", schema);

module.exports = EventModel;
Log deletion
With the continuous access of the page, the log files will increase rapidly, and the value of log files that exceed a certain time is not great, so we should clear the log files regularly.
This is actually relatively simple. Traverse the file. Because the file names are named by date (Format: 2021-12-14.log), delete the log file as long as the time interval is greater than 90 days.
Post the core implementation:
// Read log file
const fileNames = fse.readdirSync(distFolder);
fileNames.forEach((fileName) => {
  try {
    // fileName format '2021-09-14 log'
    const dateStr = fileName.split(".")[0];
    const d = new Date(dateStr);
    const t = Date.now() - d.getTime();
    if (t / 1000 / 60 / 60 / 24 > 90) {
      // If the time interval is greater than 90 days, the log file will be deleted
      const filePath = path.join(distFolder, fileName);
      fse.removeSync(filePath);
    }
  } catch (error) {
    console.error(`Log file format error ${fileName}`, error);
  }
});
Timed task integration
Now that we have finished splitting, analyzing and clearing logs, we need to integrate them with cron.
First, create a scheduled task:
function schedule(cronTime, onTick) {
  if (!cronTime) return;
  if (typeof onTick !== "function") return;

  // Create scheduled task
  const c = new CronJob(
    cronTime,
    onTick,
    null, // onComplete when to stop a task
    true, // Execute immediately after initialization
    "Asia/Shanghai" // time zone
  );

  // When the process ends, stop the scheduled task
  process.on("exit", () => c.stop());
}
Then each stage is processed in different time stages (scheduled splitting - > scheduled analysis - > scheduled deletion)
Timing split
function splitLogFileTiming() {
  const cronTime = "0 0 0 * * *"; // 00:00:00 every day
  schedule(cronTime, () => splitLogFile(accessLogPath));
  console.log("Scheduled split log file", cronTime);
}
Regular analysis and warehousing
function analysisLogsTiming() {
  const cronTime = "0 0 3 * * *"; // At 3:00:00 every day, in the early morning, there are few visits and the server resources are idle
  schedule(cronTime, () => analysisLogsAndWriteDB(accessLogPath));
  console.log("Analyze logs regularly and put them into storage", cronTime);
}
Scheduled deletion
function rmLogsTiming() {
  const cronTime = "0 0 4 * * *"; // At 4:00:00 every day, in the early morning, there are few visits and the server resources are idle
  schedule(cronTime, () => rmLogs(accessLogPath));
  console.log("Regularly delete expired log files", cronTime);
}
Then call in sequence at the application entry:
// Scheduled split log file
splitLogFileTiming();
// Analyze logs regularly and put them into storage
analysisLogsTiming();
// Regularly delete expired log files
rmLogsTiming();
summary
ok, here, a simple statistical service is completed.